Your ACoS jumped to 38% yesterday. Leadership has a check-in on Friday, so you cut bids and pause two campaigns. By Friday, the numbers look better. You call it a win.
Except conversions from last weekend are still inside Amazon’s 14-day attribution window. That spike was a one-day blip. The campaigns you paused were your best performers. The “recovery” had nothing to do with your bid changes.
This is the most common problem with Amazon Ads analytics — not missing data, but good data acted on too soon. Most channel managers know the metrics. What they’re missing is a framework for knowing when a number is real versus when it’s too early to call. That’s what this guide is for.
What is Amazon Ads analytics?
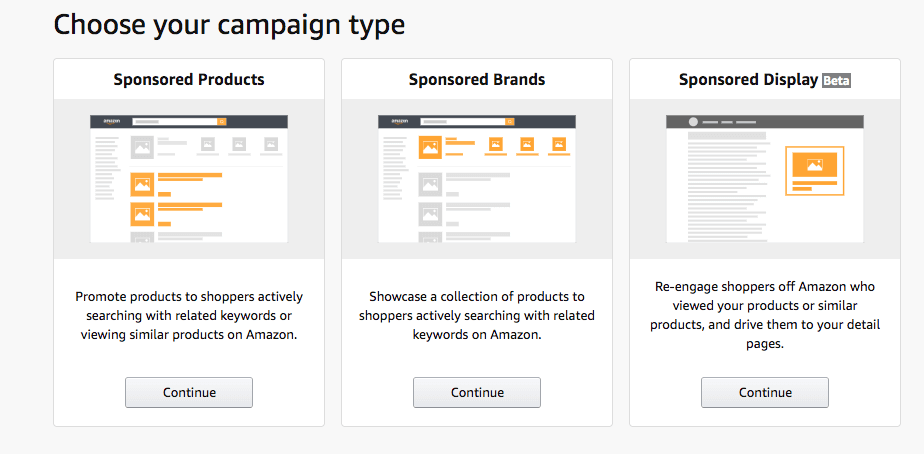
Amazon advertising analytics is the ecosystem of data Amazon gives you to measure whether your paid marketing campaigns are working across Sponsored Products, Sponsored Brands, Sponsored Display, and DSP.

Unlike Google or Meta, where the click and the purchase happen in different places, Amazon’s loop is closed. Someone searches, clicks your ad, and buys — all on the same platform. That makes Amazon ad data more directly connected to revenue than almost any other channel.
What you can do with that data splits into two tiers:
Native analytics covers everything inside Amazon’s own consoles: campaign performance reports, search term data, placement performance, and audience insights. For an account spending $5,000–$10,000/month primarily on Sponsored Products, native reporting is enough.
The ceiling shows up as you scale. Sponsored Products, Sponsored Brands, and DSP each live in separate consoles. Search term reports lag 24–72 hours. Nothing correlates with your Google traffic, Shopify revenue, or organic rank changes. For accounts managing serious spend across multiple ad types, that fragmentation becomes a real operational problem.
Custom analytics means your Amazon Ads data lives outside Amazon’s ecosystem. You can combine it with Google Ads, Meta, and Shopify data to see full business performance in one place. Coupler.io handles this with the Amazon Ads connector that automates data flows into Google Sheets, Looker Studio, Power BI, or another destination. And because Coupler.io supports over 400 data sources, you can build cross-channel Amazon advertising reports that combine Amazon Ads with other ad platforms, ecommerce tools, or financial data in a single dashboard.
Automate Amazon Ads analytics and reporting with Coupler.io
Get started for freeBuild a complete Amazon Ads analytics stack with Coupler.io
Most Amazon PPC managers start with native reports. But the ones who scale past $20–30K/month in spend eventually build something more to improve Amazon Ads performance. Here’s what that stack looks like when the goal is decisions, not just data.
Live Amazon advertising dashboards instead of CSV exports
Native Amazon Ads reporting keeps your data inside its own consoles, on its own schedule, in its own format. By the time you’ve logged in, downloaded the report, and opened it in a spreadsheet, your data is old. The click data is already 24–72 hours old, and your conversion data may still be settling for up to 14 days.
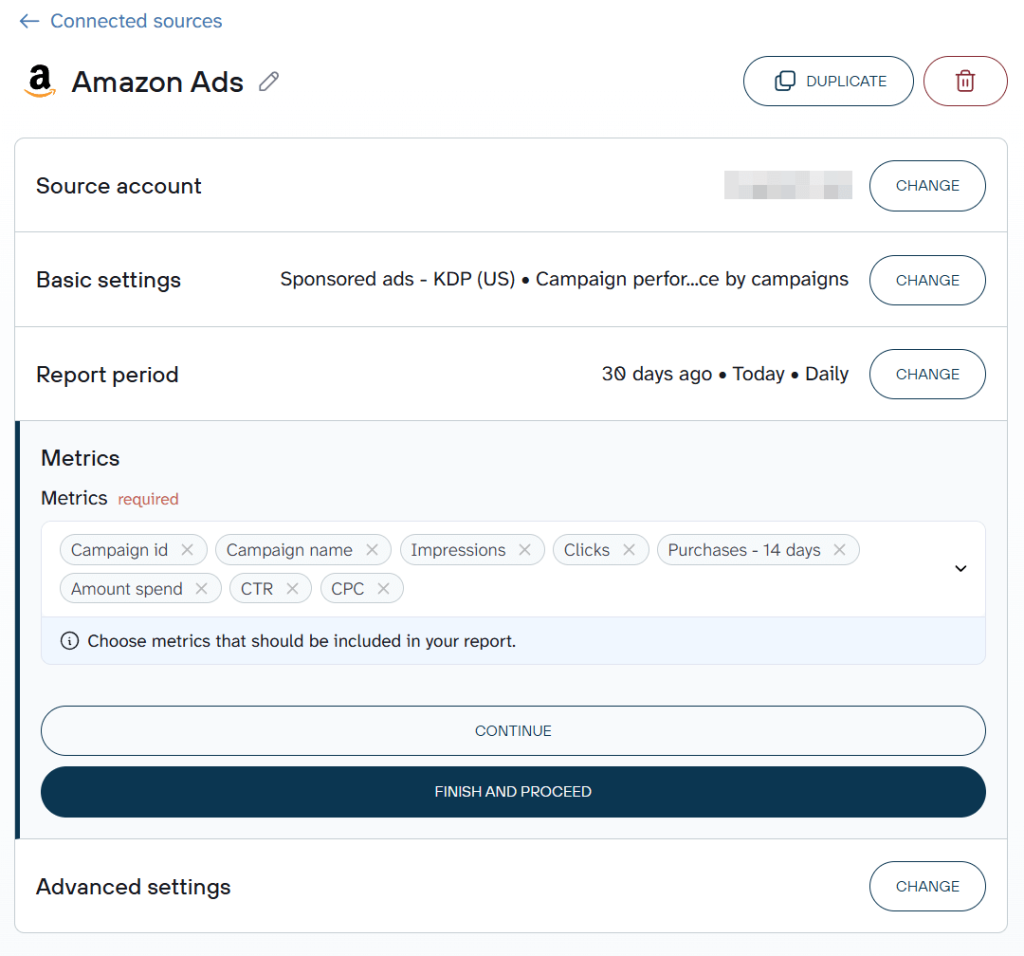
Coupler.io automates Amazon Ads reporting with scheduled data flows from your Amazon Ads account. It exports the report type you need (Campaign, Search Term, Placement, or others) and delivers it to whichever BI tool your team works in. You select metrics, set a reporting period, and choose a refresh frequency up to every 15 minutes.

Before data reaches your dashboard, you can transform it inside Coupler.io: rename columns, filter fields, add formula columns, aggregate by month, and more. Your data arrives analysis-ready. No reformatting a CSV every Monday before actual work begins. With Coupler.io, SellThru, a digital marketing agency, cut reporting time by over 20 hours a month across its client base after switching to automated pipelines.
Multi- and cross-channel reports
If you’re running Meta campaigns, Google Shopping, and influencer links to Amazon, each platform reports in isolation. The customer journey is lost between the click and the purchase.
Coupler.io connects Amazon Ads data with Google Ads, Facebook Ads, TikTok Ads, Shopify, and 400+ other sources. There are two ways to bring them together:
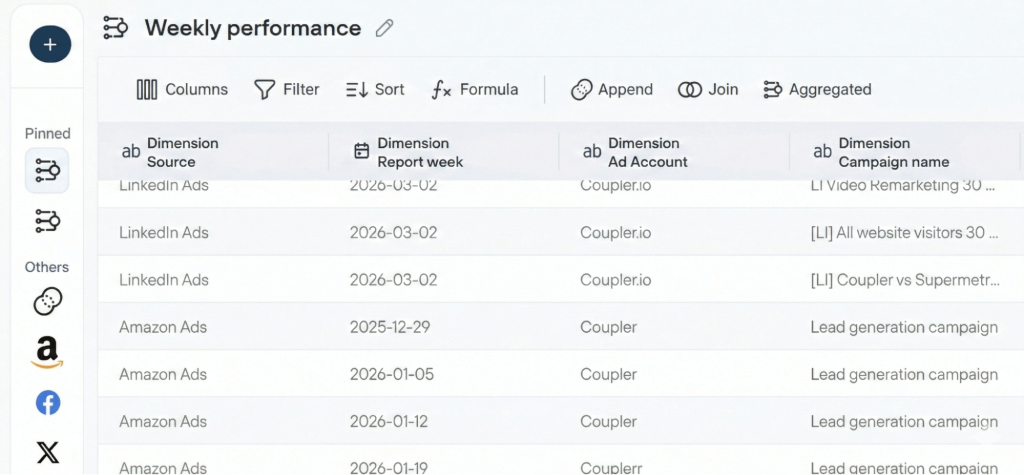
Append stacks campaign-level rows from each platform into one dataset, with shared metrics (impressions, clicks, CTR, CPC, spend) aligning automatically. You get one table to monitor Amazon Ads campaigns spend against Meta or Google spend without manual reformatting.

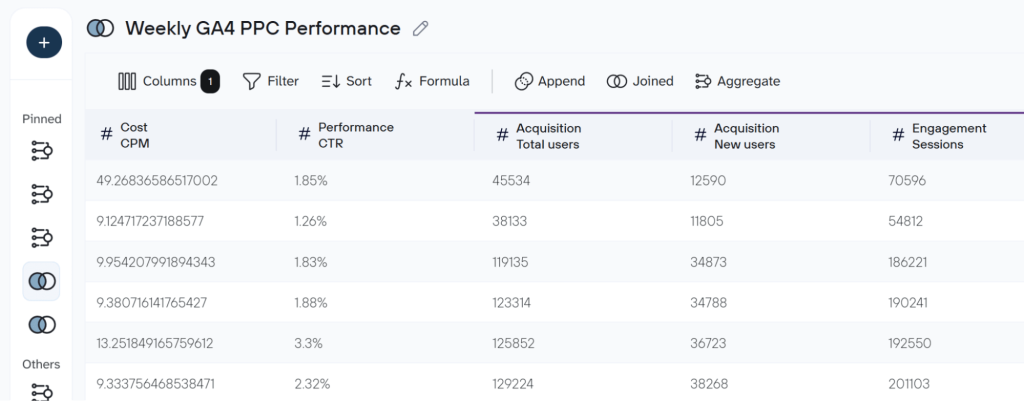
Join blends datasets from different sources on a shared key to answer cross-channel questions. For example, you can join Amazon Ads campaign data with GA4 session data to see how ad spend maps to actual site engagement in a single view. Instead of switching between Amazon’s console and GA4, you get one table that shows whether your ad clicks are translating into real traffic and engagement.

Coupler.io processes and transforms the data before it reaches your BI tool. Moreover, it offers over 170 ready-to-use dashboard templates for paid advertising, marketing, SEO, finance, and so on.
You can try out Coupler.io right away for free. Choose the desired reporting tool or destination in the form below and click Proceed. Sign up for free with no credit card required and create your first data flow.

AI-powered analysis of Amazon Ads data
With Coupler.io AI integrations, you can analyze your Amazon ads data in Claude, ChatGPT, Gemini, or other AI tools. Whichever question you ask, like “where should I shift spend based on the last 30 days?”, the AI translates your question into a structured query, Coupler.io’s analytical engine runs the calculation on your actual data, and returns verified results for the AI to interpret. No hallucinated numbers.

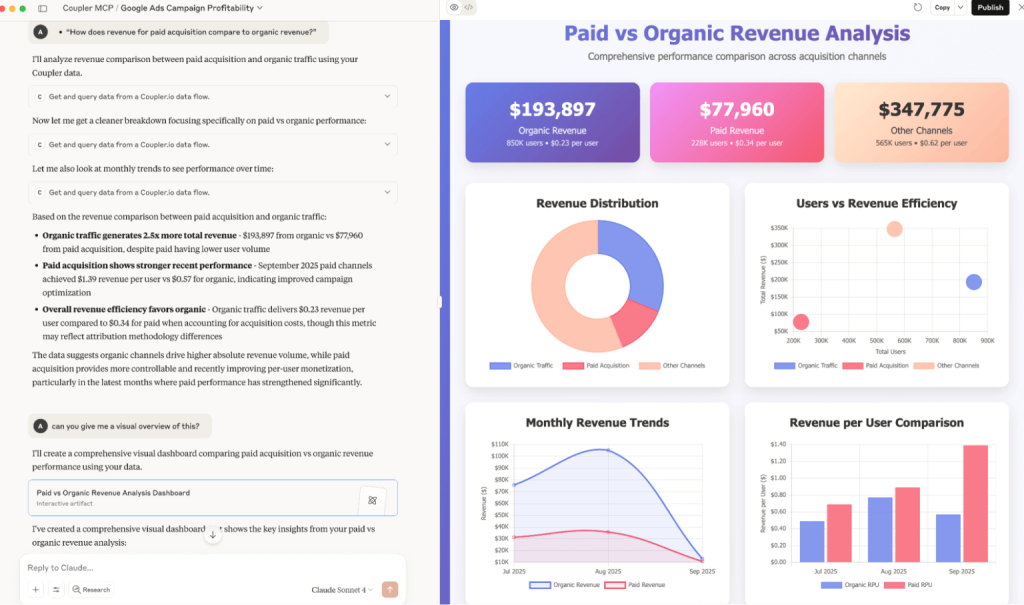
If you’d rather stay in one tool, Coupler.io’s built-in AI Agent lets you ask questions directly inside the platform. Click Ask AI next to your Amazon Ads data flow and start the conversation directly inside Coupler.io without any additional setup.

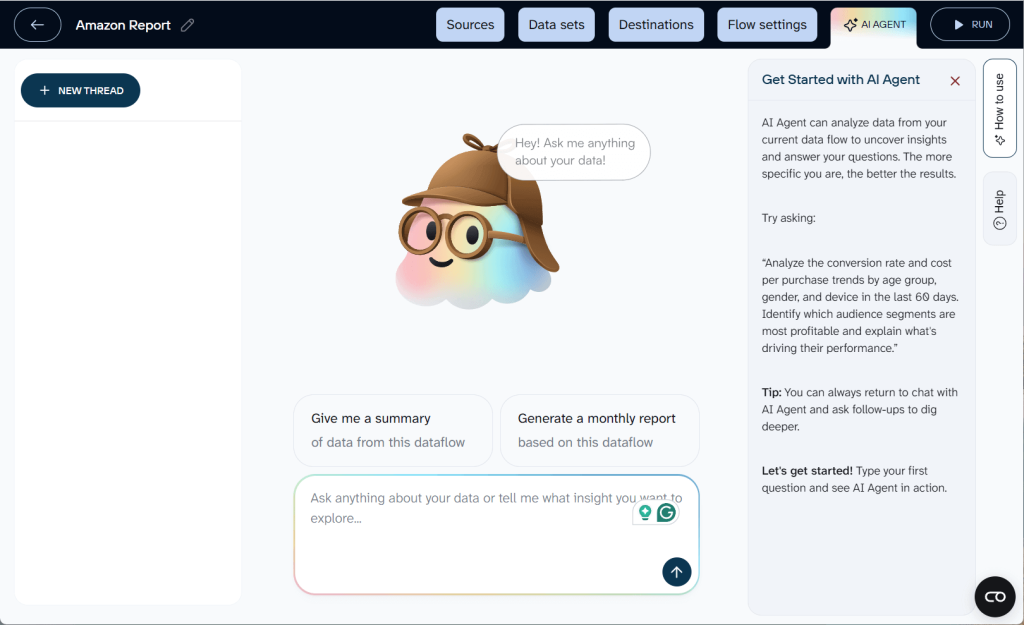
For Amazon ads managers who’ve been manually uploading spreadsheets every time they want AI-assisted analysis, this is a meaningfully different workflow. Your Amazon data stays current, your questions get answered from live data, and the analysis that used to take an afternoon takes minutes.
Multi-account Amazon advertising reporting
For agencies managing Amazon advertising analytics across multiple client accounts, or brand aggregators running portfolios of Amazon-native brands, the native reporting problem compounds fast. Each client account is a separate login with its own naming conventions, reporting periods, and ad type mix.
Coupler.io handles this by pulling data from multiple Amazon Ads accounts into a single data set using the Append method. Campaign-level rows from each account stack into one unified dataset with a consistent structure. One dashboard, all accounts side by side, same metrics, same refresh schedule.

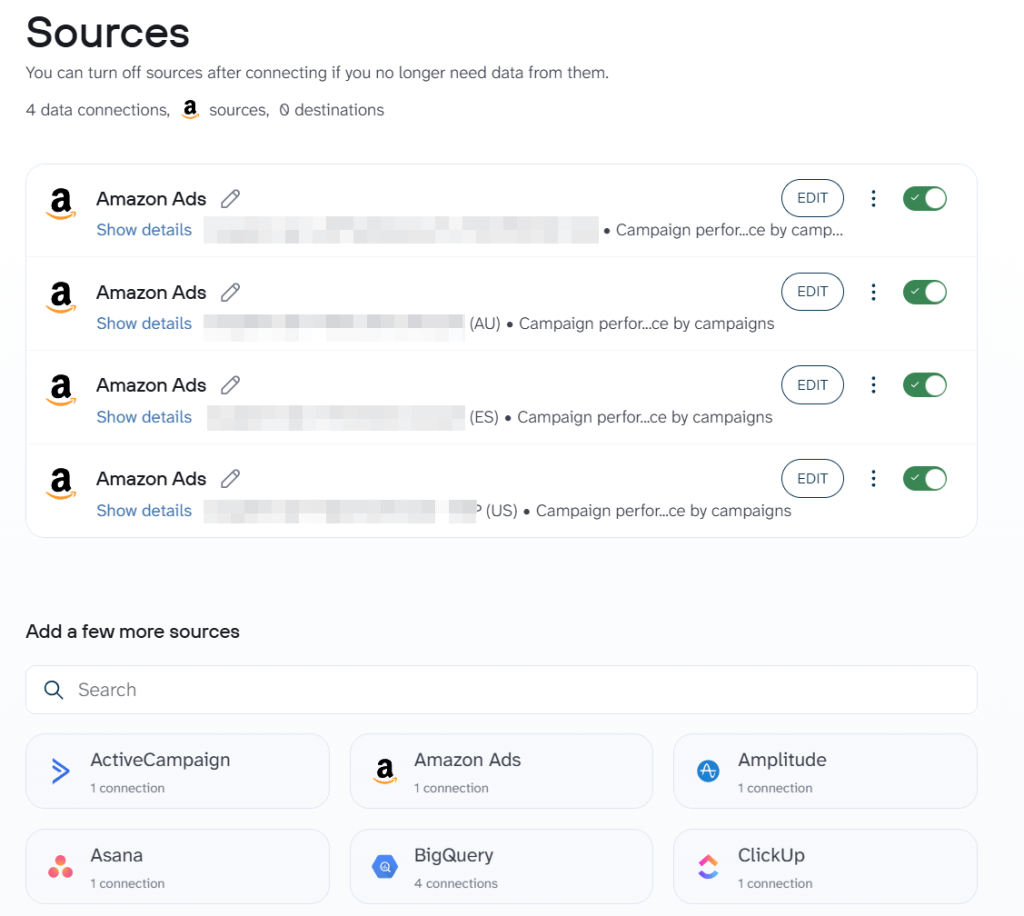
For agencies, this turns client reporting from a weekly production task into a standing dashboard that updates itself.
Coupler.io turns Amazon Ads data from something you download and wrangle into something that works for you automatically. With one platform, you get live dashboards, cross-channel visibility, AI-ready analysis, and multi-account scale, all without writing code.
With the custom marketing analytics stack covered, here’s what Amazon gives you natively and where each tool fits.
Native Amazon advertising reports worth your time
Amazon’s reporting goes far beyond the Ads Console. It has six other tools and Amazon Ads reports that are not used very often.
The essentials
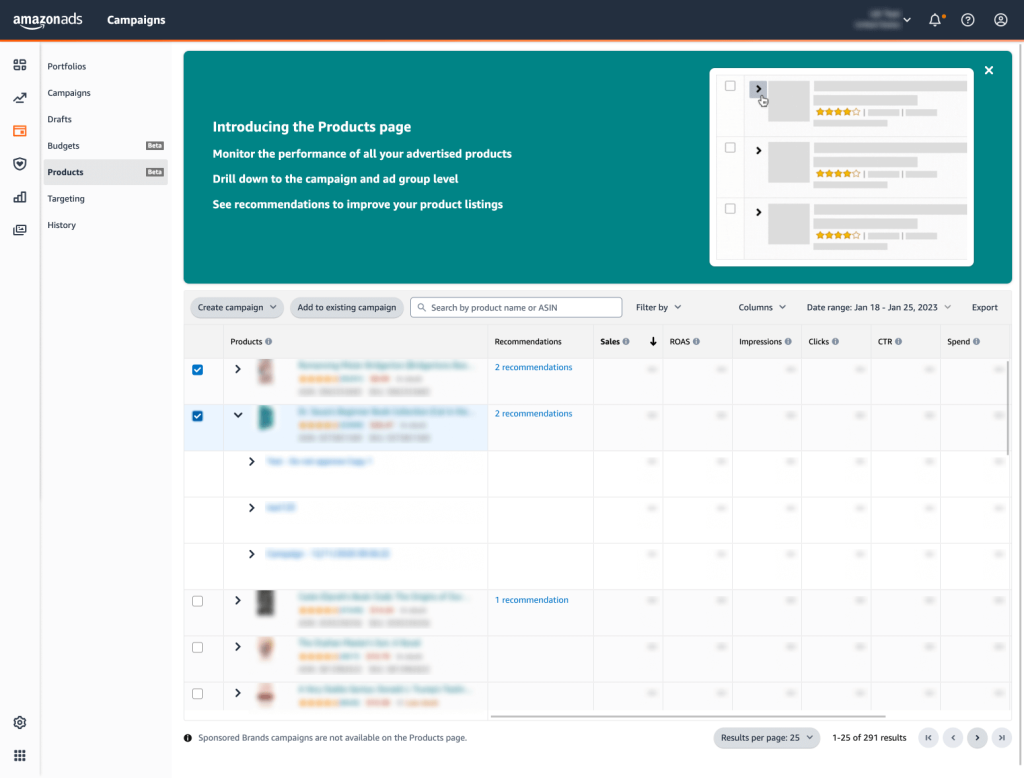
Amazon Ads Console is the starting point. Campaign metrics, budget pacing, placement data, basic performance charts. It handles day-to-day campaign management. The structural limitation: each ad type has its own reporting environment, so a unified view across Sponsored Products, Sponsored Brands, and DSP means multiple logins and manual reconciliation.

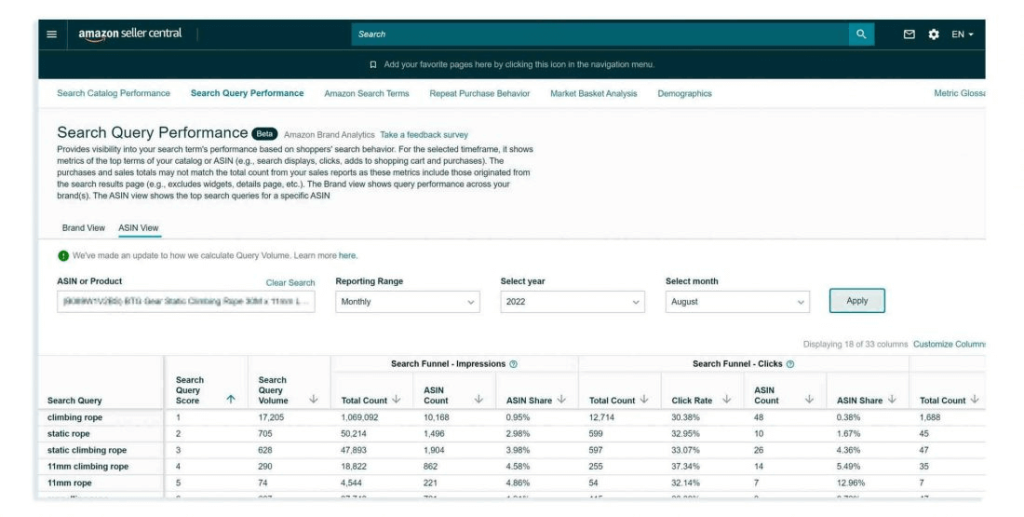
Search Query Performance Report is the most underrated report in Amazon’s toolkit. Where the Ads Console shows how your campaigns perform, Search Query Performance shows the full funnel. You get answers to how often a search term was used, how often your product appeared, how often it was clicked and bought, with competitive context alongside. It tells you exactly why people are or aren’t buying your product compared to the competition on any given term. If you’re not pulling this report regularly, you’re making keyword decisions with half the picture.

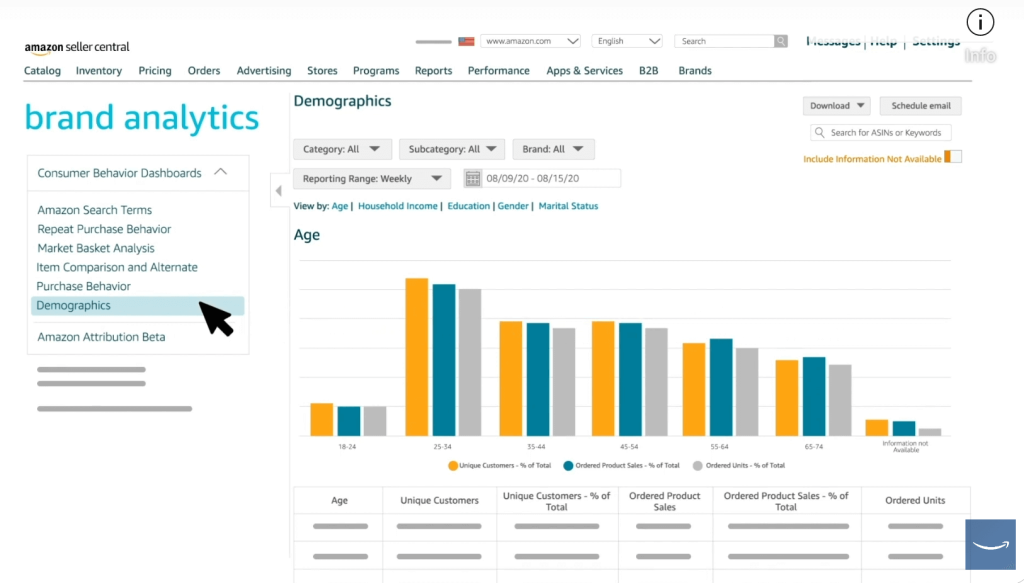
Amazon Brand Analytics (ABA) is free for brand-registered sellers and underused. It shows search frequency rank, click share, conversion share, and demographic data. The market basket analysis reveals what products your buyers purchase alongside yours. It is useful for bundling advertising strategy, cross-sell opportunities, and understanding who your actual customer is.

The power tools
Amazon Marketing Cloud (AMC) is worth paying attention to if you’ve written it off as too technical.
Until recently, AMC required SQL skills, a DSP relationship with minimum spend, and data engineering resources. For most Amazon ads managers, it was off-limits. That changed in September 2025 when Amazon opened AMC inside the Ads Console with pre-built no-code templates and an AI-assisted query tool. In November 2025, the lookback window extended from 13 to 25 months, enabling proper year-over-year comparisons for the first time.

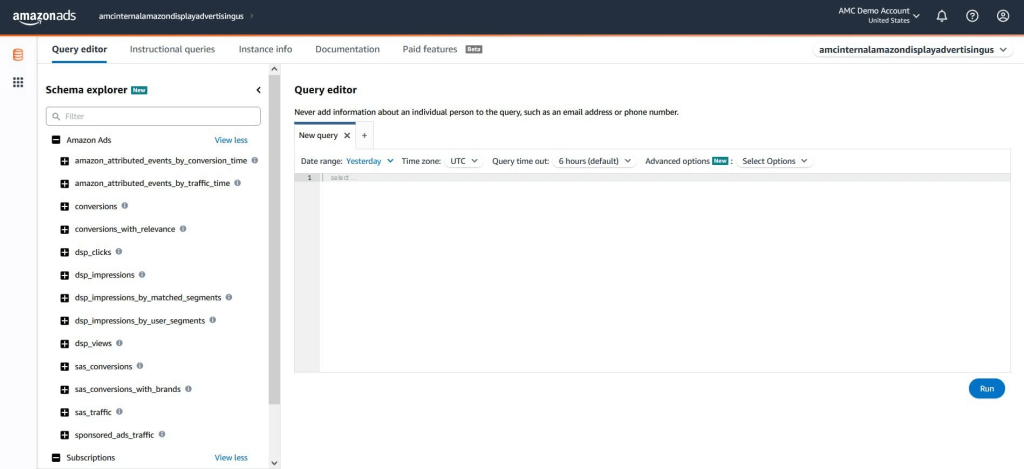
What AMC gives you: cross-channel attribution, audience overlap reports, conversion path mapping, and the ability to see what percentage of your conversions are genuinely new customers. These are the Amazon Ads insights that standard campaign reports have never been able to surface.
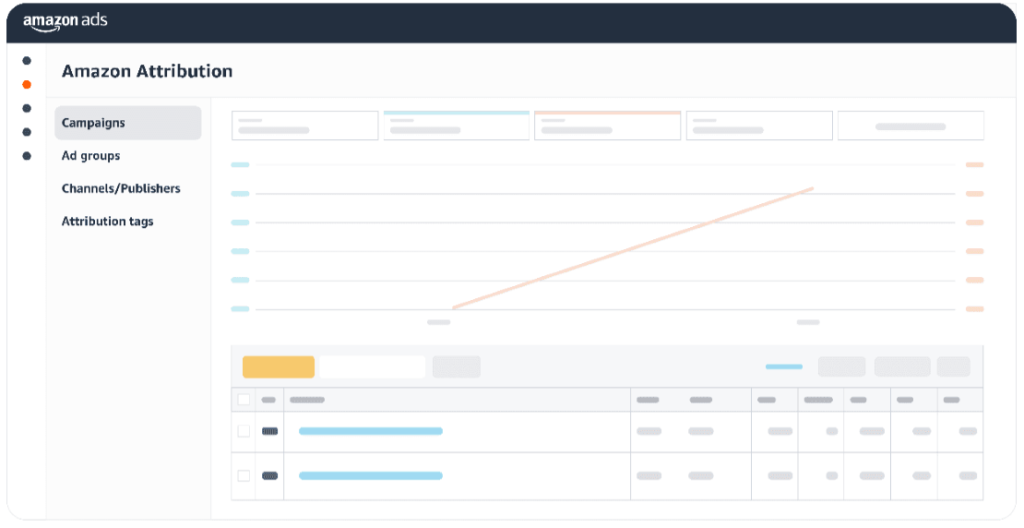
Amazon Attribution measures how off-Amazon marketing efforts, such as Google Ads, Meta, email, influencer campaigns, drives traffic and conversions on Amazon. Free for brand-registered sellers. If you’re running external traffic to Amazon listings without Attribution, you have no way of knowing what’s working. Setup requires adding tracking tags to external campaigns; the data is worth the one-time effort.

The niche tools
Amazon Ads Agent is a conversational AI tool launched in 2025 for launching campaigns, adjusting settings, and pulling performance summaries through natural language prompts. It reduces time spent on routine tasks but won’t replace strategic thinking.

Amazon Marketing Stream delivers real-time, hourly performance data via API. Useful for dayparting analysis and custom alerting, but requires developer resources. For most managers, it’s good to know it exists.
Where native Amazon Ads Analytics hits its ceiling
Native Amazon advertising analytics gets you far. But as spend, ad types, and stakeholder questions grow, specific gaps become operational problems.
You can’t tell what’s actually incremental
Your ROAS looks healthy. But how much of that attributed revenue would have happened anyway? Amazon’s attribution takes credit for every purchase within a 14-day window after a click, regardless of whether the ad drove the decision. Amazon Marketing Cloud has made incrementality analysis accessible since September 2025, but for accounts not yet using it, the question remains open.
Data is fragmented and always late
Sponsored Products data lives in one console. Sponsored Brands in another. DSP in a third. Search Term Reports are delayed 24–72 hours. Campaign naming conventions don’t always match across report types. This results in building a single coherent picture of your account by downloading multiple CSVs, running VLOOKUPs across tabs, and manually reconciling numbers.
That process eats time that should go toward actual analysis. In one account audit published by Amazon advertising agency Sell Global, found that 69% of unbranded Sponsored Products spend was generating zero orders, i.e., roughly $17,000 a year in pure waste. That kind of leak doesn’t get found when you’re spending your week moving data between spreadsheets.
This is where Coupler.io changes the workflow. Instead of Monday morning CSV downloads, you connect your Amazon Ads account once, and data flows automatically on a refresh schedule you control. The setup takes about five minutes, no coding required. Before data hits your dashboard, you can transform it inside Coupler.io: rename columns, filter fields, add formula columns, aggregations, and more. Your data arrives analysis-ready.
Automate Amazon Ads data flows with Coupler.io
Get started for freeThe right targets are harder to set than they look
Leadership sets a blanket ACoS target of 25%, and you optimize toward it. But the right ACoS depends on margin, product lifecycle, and campaign objective. A 40% ACoS on a new product launch building organic rank can be exactly right. A 15% ACoS on a mature product with strong organic velocity might mean overspending on buyers who were coming anyway.
When you optimize for the metric you’re measured on rather than actual profit, you under-invest in new launches and over-invest in branded defense. The account hits its ACoS target while market share quietly erodes. Native reporting gives you the metric but not the context to know whether hitting it is good or bad news.
You can’t see what competitors are doing until it’s too late
Amazon is an auction. Your performance depends on what competitors are doing. When a competitor launches an aggressive campaign or a new entrant floods your category, your Amazon Ads metrics shift overnight with no warning. Brand Analytics gives you click share and conversion share, but it updates weekly and covers only the top three brands per search term. By the time you’ve spotted the shift, you’ve already lost ground.
Nine Amazon Ads metrics to track
Amazon gives you dozens of performance metrics. To track Amazon Ads performance effectively, you need to go beyond knowing what the numbers mean in isolation. Here are the nine Amazon Ads KPIs that actually matter.
| Metric | What it tells you | The trap to avoid |
| Impressions | Whether your bid is competitive and Amazon considers your ad relevant. As a trend, falling impressions without campaign changes means your bid is losing or relevance dropped. | Impressions don’t tell you if you’re winning on the right terms. 75% of Amazon searches are generic. If impression share on unbranded high-volume terms isn’t growing, more spend won’t fix it. |
| Clicks | How many shoppers found your ad relevant enough to act on. High clicks with low conversion is a listing problem — check images, pricing, reviews, and A+ content before touching bids. | A broad, poorly targeted keyword can drive high clicks while quietly draining budget. Volume without intent is waste. |
| Click-through rate (CTR) | Ad-to-listing fit. Low CTR on a high-impression keyword means your creative isn’t matching shopper intent. Test a new main image or headline before raising bids. | CTR varies significantly by placement. Top-of-search rates are much higher than product page rates. A universal CTR target across placements leads to bad decision-making. |
| Cost-per-click (CPC) | Competitive intensity in the auction. When CPC rises, diagnose before reacting: competitor bidding up? Seasonal demand? Relevance drop? Cutting bids reflexively usually makes the underlying problem worse. | Watch for the weighted average error. If Campaign A spent $1,000 at $2.00 CPC and Campaign B spent $100 at $5.00 CPC, your average CPC is $2.27, not $3.50. |
| Advertising cost of sales (ACoS) | Ad spend as a percentage of ad-attributed revenue. At 25% ACoS, you spent $0.25 to generate $1.00 in attributed sales. | ACoS takes credit for every purchase within 14 days of a click. A 40% ACoS on a launch campaign can be right; a 15% ACoS on a mature product may mean overspending. Obsessing over reduction produces accounts that hit targets while losing market share. |
| Return on ad spend (ROAS) | The inverse of ACoS (25% ACoS = 4x ROAS). Know which metric your leadership prefers and why. | Don’t let the reframing change how you make decisions. ROAS and ACoS tell you the same thing expressed differently. |
| Conversions | Whether campaigns are driving purchases, and at what rate per click. Track by ad type, placement, and time of day. | A campaign that converts well on product pages but poorly at top-of-search may need a placement bid adjustment, not a budget cut. Amazon’s data shows high-quality Brand Stores generate up to 97% more sales than low-quality ones — optimizing bids on a weak listing is filling a leaking bucket. |
| New-to-Brand | Whether your ads acquire new customers or recapture existing ones. 85% NTB means you’re growing. 10% NTB means you’re mostly serving people who already know you. | NTB is the closest native Amazon Ads analytics gets to incrementality, but it doesn’t measure lifetime value or repeat purchase behavior. Use it to distinguish demand creation from demand capture. |
| Total advertising cost of sales (TACoS) | Ad spend divided by total Amazon revenue (organic + paid). The single metric that shows whether the advertising efforts are building something durable or just buying clicks. | Watch TACoS monthly. A widening gap between ACoS and TACoS means ads are building organic rank. A shrinking gap means growing dependence on paid spend. Example: $10K spend, $40K ad revenue, $100K total revenue = 25% ACoS, 10% TACoS. That 15-point gap is organic revenue your ads helped build. |
These key metrics work best when they live in a dashboard you build once and update automatically, not in CSVs you pull every Monday. If you’re tracking all nine, you’ve outgrown spreadsheet reporting.
FAQ
What’s the difference between ACOS and TACOS?
ACoS measures the efficiency of your ads. TACoS measures the health of your business. For example, if your monthly ad spend is $10,000, your ad-attributed revenue is $40,000, and your total Amazon revenue (organic + paid) is $100,000, your ACoS is 25%, and your TACoS is 10%. The 15-point gap between them represents organic revenue your ads helped build but didn’t directly generate. A widening gap over time means your advertising is successfully building organic rank. A shrinking gap means you’re becoming more dependent on paid spend to sustain the same revenue, which is the warning sign most ACoS-only reporting completely misses.
How do I analyze Amazon Ads performance by search term?
Start with your Search Term Report. Download the last 30 days, sort by spend, and divide every term into three buckets.
- High spend and high conversion rate: keep and scale
- High spend and low conversion rate: add as a negative keyword or reduce bids
- High spend and zero orders: pause immediately. This is where most wasted spend lives.
For a more complete picture, combine it with the Search Query Performance Report from Brand Analytics. It shows your click share and conversion share against competitors on the same search terms, so you can see how you compare to whoever else is bidding on those terms.
Can I combine Amazon Ads data with Google Ads or Meta Ads analytics?
Yes, and if you’re running external traffic to Amazon, you should. Amazon Attribution measures how off-Amazon campaigns drive conversions (free for brand-registered sellers). For a full cross-channel view, use Coupler.io to analyze Amazon Ads alongside Google Ads, Meta, and Shopify data in a single BI dashboard.
The benefit: you stop reporting each channel in isolation and start seeing which external spend actually lifts Amazon organic rank.