Every ad platform claims the same Shopify sale, native store reports stop at the storefront, and the attribution and analytics tools each hand you their answer inside their own dashboard.
The best ecommerce reporting and analytics tools do different jobs. Some combine Shopify, Google Ads, and other marketing data in a packaged dashboard; others focus on customer behavior and attribution modeling. Coupler.io sits in the category of a data layer, as it prepares and blends ecommerce data for reports and AI analytics.
Check out a breakdown of 6 main options by KPIs, attribution, integrations, pricing, data ownership, and AI access to pick the right setup for your store.
How to choose the best analytics tools for ecommerce
Before choosing an analytics tool for ecommerce, decide what you need it to do.
Six things to check before you commit:
- Which KPIs it calculates: Conversion rate, average order value (AOV), customer lifetime value (LTV), CAC, ROAS, cart abandonment rate, and customer retention are standard ecommerce KPIs. The important question is whether they use real costs. ROAS that ignores COGS, 3PL shipping, or ad platform fees can make an unprofitable product look profitable.
- How it handles attribution: Some ecommerce analytics tools assign channel credit using a pixel, attribution modeling, or media mix modeling. Others give you blended data so you can check the numbers yourself. Decide which approach you need.
- Where the data ends up: Some ecommerce data analytics tools keep everything in a closed dashboard, which works until you need something the vendor does not support. Check whether you can send data to Google Sheets, Power BI, Looker Studio, BigQuery, a data warehouse, or an AI tool, instead of keeping it only in the vendor’s UI.
- Which sources it covers: Look for your store platform (Shopify, WooCommerce, Magento), ad platforms such as Google Ads and Meta, email, CRM, and the other tools in your stack. Ecommerce-specific products usually cover the ecommerce stack well but may be weaker outside it. If you sell subscriptions, check whether the ecommerce subscription analytics tool you’re evaluating handles recurring revenue, churn, and cohort LTV natively. Not all of them do.
- How pricing scales: GMV-based pricing rises with revenue, ad-spend pricing rises with media budget, and account-based pricing rises as you connect more accounts. Compare how each model will change as you grow.
- What team it assumes: Some products need an analyst or data specialist to get full value from them. For a small DTC team without a data engineer, that can decide the purchase.


Plan an ecommerce reporting setup with Coupler.io
Book a demoBest ecommerce analytics tools comparison in a table
Triple Whale, Northbeam, Polar Analytics, and Daasity are packaged analytics products. They combine store and marketing data, apply their own models, and show the results in their dashboards. Triple Whale and Northbeam focus on attribution, Polar on ecommerce BI, and Daasity on omnichannel analytics and a managed warehouse.
Google Analytics 4 (GA4) is different: it is primarily a web analytics source, not a complete ecommerce reporting layer.
Coupler.io is the data layer: it moves and blends ecommerce data into the reporting, BI, warehouse, and AI tools you already use.
Here’s how the main ecommerce analytics tools compare:
| Tool | Category | Best for | Pricing from | Attribution | Destinations | AI access | Needs a data person |
|---|---|---|---|---|---|---|---|
| Triple Whale | Packaged attribution + profit | Shopify-first DTC | Free tier; paid pricing not published | Native, Triple Pixel | Its own dashboard; warehouse export is a paid add-on | Moby (agentic) plus an MCP, both metered by tier | No |
| Northbeam | Premium ML attribution + MMM | Multi-channel DTC with real spend and an operator | $1,500/mo Starter; $3,500/mo Professional | Native, deep (MTA, MMM+, incrementality) | Its own dashboard | Read-only MCP, Professional tier and up | Yes, effectively |
| Polar Analytics | Ecommerce-native BI | Shopify/DTC brands and their agencies | $720/mo Core Plan under $5M GMV | Native multi-touch, ten models | Dedicated Snowflake; SQL access is a paid add-on | Read-only MCP, sold as a separate product | No |
| Daasity | Managed warehouse + analytics | Omnichannel brands selling DTC, Amazon, wholesale, retail | $1,499/mo Starter Essentials | Via the warehouse model | Daasity’s Snowflake, Looker as the BI layer | AI Analyst, bundled with the syndicated data add-on | Yes, or you buy their services |
| Google Analytics 4 | Web analytics source | Everyone, as a baseline | Free; 360 commonly cited around $50K/yr | Three models, data-driven and last-click only | BigQuery export; otherwise the GA4 UI | Ask Advisor, still in beta | No |
| Coupler.io | Data layer | Multi-store operators, lean DTC teams, agencies | $24/mo billed annually ($32 month-to-month) | None of its own. Blend the raw data and check theirs | Sheets, Excel, Power BI, Looker Studio, Tableau, BigQuery, Snowflake, Claude, ChatGPT, and others | Chat in-platform or in any connected LLM | No |
What are the best ecommerce analytics tools up close
Each ecommerce analytics tool in the table above solves a different problem, from DTC attribution to omnichannel measurement. Here’s what they cost, where they fall short, who should and shouldn’t buy them, and how their AI access actually works.
Triple Whale: DTC attribution and profit tracking for Shopify brands
Triple Whale combines ecommerce attribution, profit tracking, and AI tools for DTC brands. Its first-party attribution is built around Triple Pixel, while Moby adds AI analysis and automation.
Best for: Shopify-first DTC brands that want attribution and profit reporting in one platform. The free plan also makes it accessible to smaller stores.
Key features:
- Triple Pixel first-party attribution, with a mobile SDK, and a profit dashboard that nets ad spend, COGS, shipping, and fees against revenue
- Moby, an agentic assistant that routes across several model providers and can run recurring work: leadership reports, KPI alerts, ad monitoring, creative generation, even landing pages
- A Triple Whale MCP, from the Foundation tier up
- AI Visibility, tracking brand mentions, citations, and sentiment in AI search
- Sonar Send and Sonar Optimize for server-side conversion feeds back to Google and Meta
- Compass, its unified MMM, incrementality, and multi-touch attribution layer, included on Enterprise and sold as an add-on below that
- Multi-store and multi-geo reporting, a SQL editor, and cohort analysis, all from Foundation up
Pricing
As of late August 2026, Triple Whale does not publish prices for its paid tiers. It offers a free plan and three paid tiers priced by annual GMV and package, with quotes provided by sales.
As GMV rises, the account moves into a higher pricing tier.
The free plan is limited to:
- Attribution first and last click only, with a lifetime lookback window. Multi-touch attribution starts at Foundation.
- No CSV export, no data warehouse export, no ad platform controls.
- Twelve months of data retention, against unlimited on the paid tiers.
- No multi-store reporting, no cohort analysis, no product or creative analysis, no custom metrics, no SQL editor.
- AI visibility covers ChatGPT only, rather than all LLMs.
- Moby usage: none. The free tier has no AI at all.
Pros and cons
✅ The fastest route to a working profit view for a Shopify store
✅ Attribution and profit in one place, without building any of it
✅ A free tier that is a real product rather than a trial
❌ The bill climbs with GMV regardless of margin, so high volume on thin margins pays like high volume on fat ones
❌ Data warehouse export is a paid add-on on every tier, which matters if getting your own data out is part of the plan
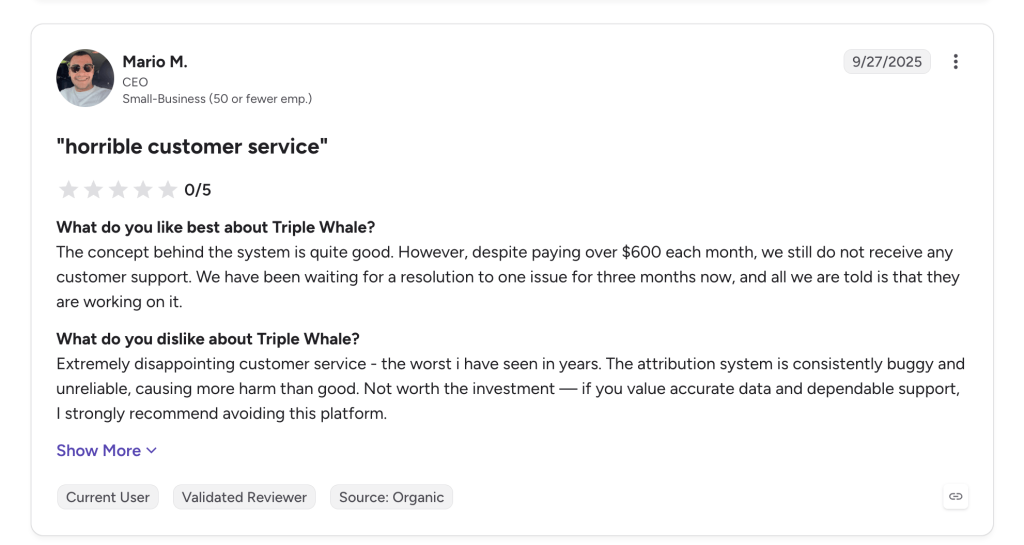
❌ Support quality after onboarding and bugs are themes showing in a lot of reviews
❌ All three paid tiers are twelve-month commitments

Northbeam: ML attribution and MMM for scaling brands
Northbeam is a premium measurement platform for DTC brands. It combines multi-touch attribution, media mix modeling (MMM), and automated incrementality testing.
Best for
Multi-channel DTC brands with significant ad spend and someone in-house who can interpret the model. Practitioner feedback suggests multi-touch attribution becomes more useful around $50K/month in ad spend, although Northbeam has no contractual minimum.
Key features:
- Multi-touch attribution with deterministic view-through, and MMM+ with seasonality and promo impact on Enterprise
- Northbeam Incrementality, launched April 2026, currently Meta-only and US-only
- Apex, which enriches first-party conversion data and feeds it back to the ad platforms
- Read-only MCP access from the Professional tier, plus Metrics Explorer, Creative Analytics, and an iOS app
- Dedicated media strategist time, which is part of the product rather than an extra
Pricing
Northbeam has four tiers: Growth is quoted through partners, Starter begins at $1,500/month, Professional at $3,500/month, and Enterprise is custom. Pricing also depends on pageview volume, so listed prices are a starting point.
No free plan and no trial.
Note: Starter is Shopify-only and support for other ecommerce platforms starts at Professional.
Pros and cons
✅ Attribution accuracy is what Northbeam is best at
✅ Dedicated strategist time is part of the product, not an upsell, and the model genuinely needs interpretation
✅ MMM, multi-touch, and incrementality in one place at the top tier
❌ Expensive, with no free plan and no trial, so there is no way to test it on your own data before committing
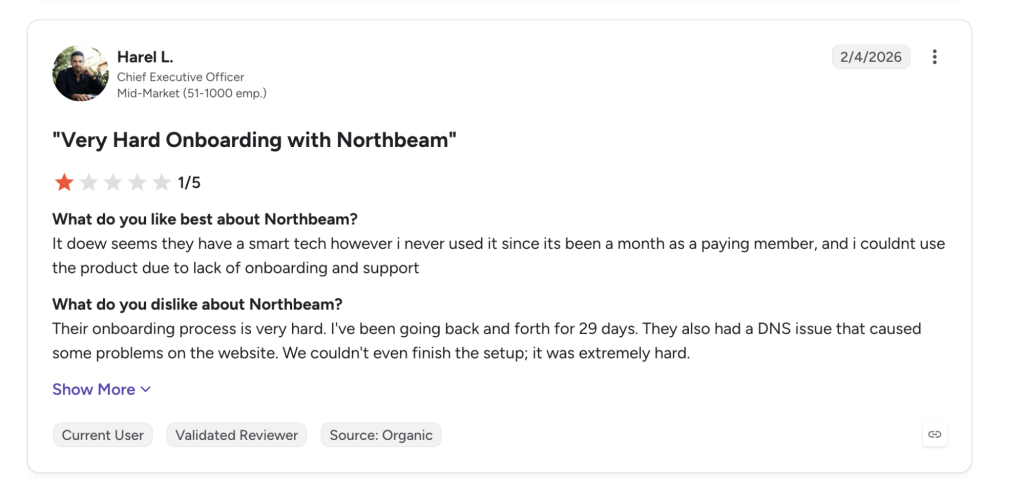
❌ Reviewers rate onboarding, support and learning curve markedly lower than they rate accuracy
❌ Integration plus model warm-up runs a few weeks before the reports are decision-grade
❌ Its numbers will not match the ad platforms. Northbeam says so upfront, which is correct and still a recurring source of internal argument
❌ Starter is effectively Shopify-only; other ecommerce platforms start at Professional

Coupler.io: the data layer for ecommerce reporting, analytics, and AI
Coupler.io is a no-code data integration and reporting automation platform. It pulls data from 400+ sources into Google Sheets, Excel, Power BI, Data Studio, Tableau, BigQuery, Snowflake, and AI tools including Claude and ChatGPT.
While you choose how to analyze and report on the data, Coupler.io organizes it and ensures that all complex transformations are executed.
The problem it solves first
Ad platforms can claim credit for the same sale, so channel revenue and ROAS may add up to more than the store actually recorded. Coupler.io lets you blend Google Ads, Meta, TikTok, Shopify, and other sources against store sales data to build one view across channels.
You can also combine orders with COGS, shipping, handling, and ad costs to report on profit rather than revenue alone.
Best for:
- Multi-store operators: Combine sales data and KPIs such as units per transaction, AOV, and gross sales across several Shopify stores while keeping per-store views. With account-based pricing, adding reporting views does not increase the bill based on combined GMV.
- Lean DTC teams: You’ve outgrown the native Shopify dashboard and self-reported ad platform numbers but do not have a data engineer or want GMV-based pricing.
- Agencies reporting across many client stores: Pull Shopify, Meta, Google Ads, Google Analytics 4, and Klaviyo data into white-label dashboards in tools such as Google Data Studio.
- Chat-first, end to end (build and analyze by chatting): You can set up your connectors and data flows conversationally and then analyze the results the same way. Ask your store data questions in plain language, inside Coupler.io or in Claude/ChatGPT/Gemini, with the Analytical Engine doing the math so you get accurate answers, not hallucinated ones off raw rows. It’s not just a chat window bolted onto a finished Shopify or WooCommerce dashboard; the whole pipeline is conversational.

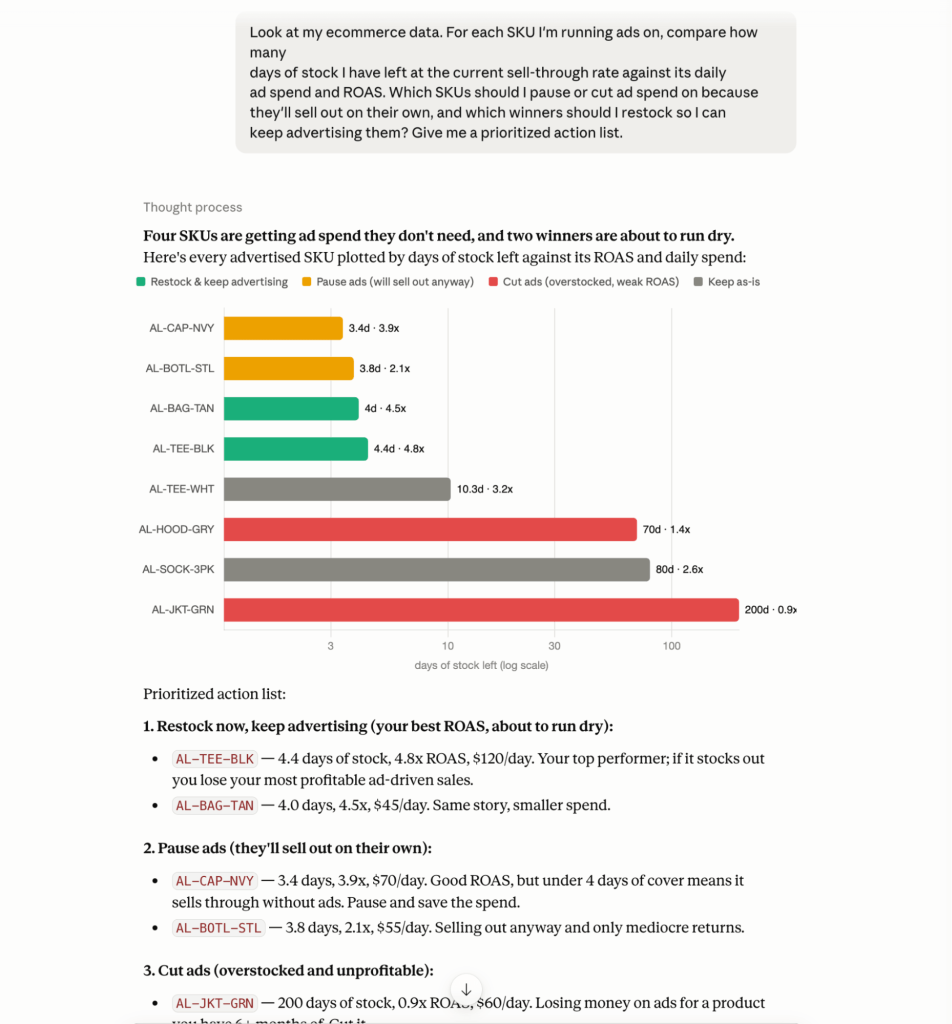
Ecommerce AI analytics tools are increasingly useful for teams that want to ask questions about Shopify sales data, customer service, marketing campaigns, and so on. The main value is that they do not need to build a new ecommerce dashboard for every question.
The Analytical Engine calculates metrics before sending results to the language model. It translates a question into SQL, runs the calculation, and returns the result for the model to explain. This reduces the risk of asking an LLM to calculate KPIs directly from raw rows.
Pricing
Pricing is account-based: you pay for connected accounts, destinations, and refresh frequency rather than GMV or the number of data flows. Plans start at $24/month billed annually or $32 month-to-month, with a free plan and a 7-day full-access trial.
Your price does not rise just because GMV rises; it changes when you connect more accounts or need a higher service level.
Pros and cons
✅ You own the schema and the destination. The data lands in tools you already open, not one more dashboard
✅ Dedicated ecommerce connectors and pre-built dashboards, so you get a working report quickly rather than a blank warehouse
✅ Multi-store and multi-client reporting is a core strength, not a workaround
✅ The whole pipeline is conversational, from setting up flows to analyzing the results
✅ Flat account-based pricing that doesn’t move when you have a good quarter, published, with no sales call to start
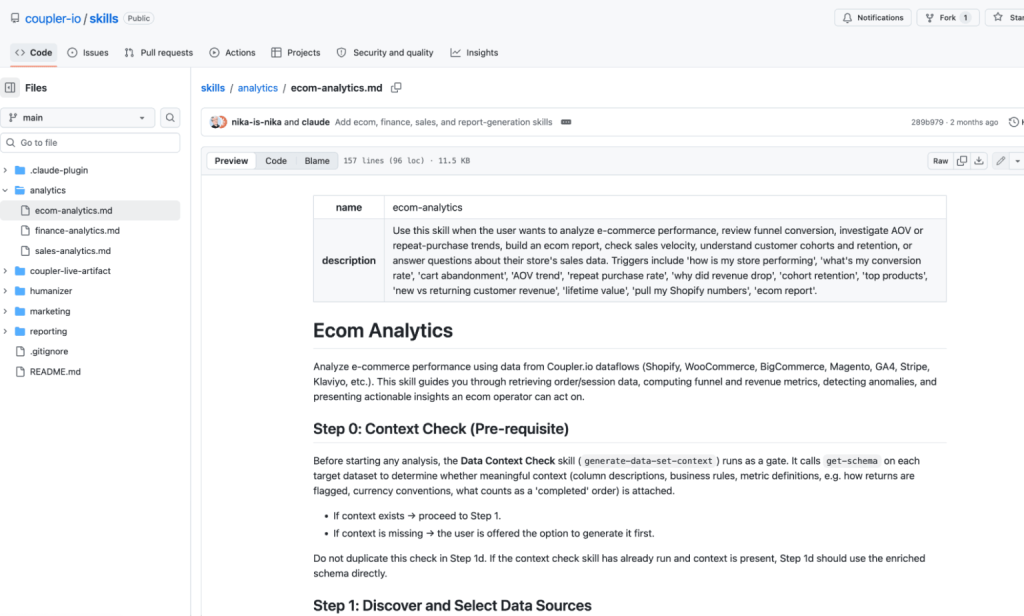
✅Coupler.io has an open-source ecom-analytics skill (on GitHub) that hands your AI agent be it Claude, ChatGPT or a custom one, a full ecommerce-analyst playbook: funnel analysis, AOV, cohort retention, and anomaly detection, all defined the way an analyst would run them

❌ Not an attribution product. No pixel, no media mix model, no ML engine deciding what a channel is worth
❌ No dedicated BigCommerce or Wix connector today, though Shopify, WooCommerce, Adobe Commerce, and Stripe are all covered among ecommerce data sources.
❌ You are assembling a reporting setup rather than buying a finished opinion, which is the point, but it is still work
Get true ROAS across every channel with Coupler.io
Get started for freePolar Analytics: ecommerce-native BI and reporting
Polar Analytics is ecommerce-focused business intelligence software with pre-built metrics, attribution modeling, cohort analysis, and a dedicated Snowflake database for each customer.
Best for
Shopify and DTC brands that want ecommerce BI without building it themselves, plus agencies that need white-label reporting.
Key features
- Several hundred pre-built ecommerce metrics over a governed semantic layer
- Multi-touch attribution with its own pixel and identity resolution, across ten attribution models
- Retention and LTV cohort analysis as a pre-built dashboard track
- A dedicated Snowflake database per customer, with SQL access available as a paid add-on
- An AI Data Engineer that reads an API’s documentation and writes a connector for it
- An MCP endpoint for Claude, reviewed and listed by Anthropic, plus a ChatGPT app
- Incrementality testing sold per test, and Klaviyo audience activation
Note: Polar’s MCP endpoint is read-only. It exposes exactly eight tools against a fixed registry of pre-approved metrics and dimensions, with no SQL passthrough. Claude can ask Polar’s data model any question Polar decided in advance was askable, and nothing outside it.
Learn more about using Claude for AI analytics.
Pricing
Pricing scales across 18 GMV bands. The Core Plan starts at $720/month for brands under $5M GMV and rises above $21,000/month at the highest published band.
Business Intelligence starts at $510/month. The MCP endpoint is a separate product at around $1,500/month. Some users report receiving higher sales quotes, so treat published prices as a starting point.

Pros and cons
✅ The most complete ecommerce BI on this list
✅ A governed semantic layer, so every metric means one thing everywhere.
✅ A dedicated Snowflake database on every plan, not just the top tier
✅ Published GMV bands, so you can work out roughly what you would pay before you call anyone
✅ A real agency partner program with white-labeling
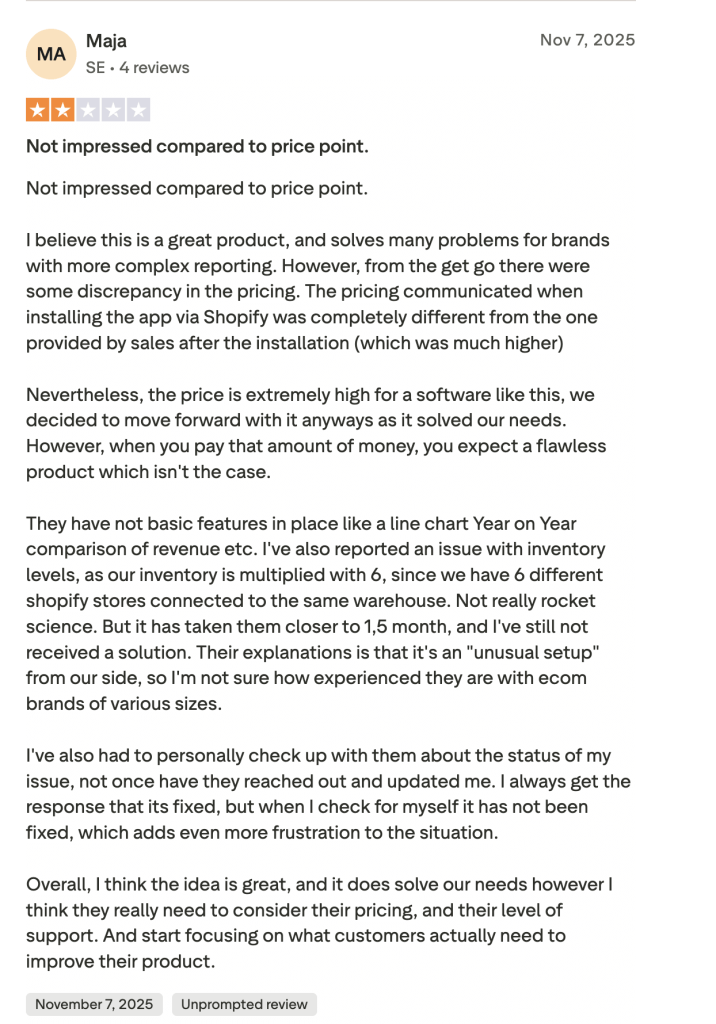
❌ Connector reliability is the most repeated complaint, and non-standard connectors need a support ticket
❌ Reporting gaps: reviewers cite missing year-over-year comparison and limited customizability
❌ Support responsiveness that reviewers describe as having declined over the past year
Daasity: managed warehouse and analytics for omnichannel brands
Daasity combines a managed data warehouse with ecommerce analytics and activation. It is built for brands that need to combine DTC, Amazon, wholesale, and retail sales data.
Best for
Omnichannel consumer brands selling across DTC, Amazon, wholesale, and physical retail, especially when the main challenge is combining data across channels.
Key features
- Managed warehouse with a standardized omnichannel data model, running on Daasity’s Snowflake instance
- Prebuilt dashboards covering digital and retail in one view, historically with Looker as the BI layer
- Syndicated retail data from SPINS, NielsenIQ, and Circana, sold as an add-on
- An AI conversational analyst and a promotion predictor
- A substantial services arm: strategy, custom development, and managed analytics engineering
Pricing
Starter Essentials costs $1,499/month and Essentials $1,999/month, with custom Enterprise pricing. A syndicated data and AI Analyst bundle costs $499/month on a 12-month agreement.
There is no published usage or GMV scaling, and implementation is scoped and billed separately.
Pros and cons
✅ If your business really is omnichannel, it has already solved a modeling problem that would take an internal team a long time to solve badly
✅ Digital and retail in one view, including syndicated retail data from SPINS, NielsenIQ, and Circana
✅ Reviewers praise the team by name more consistently than they praise the software, and the services arm is substantial
❌ You need someone data-forward internally, or you need to buy their services alongside the platform
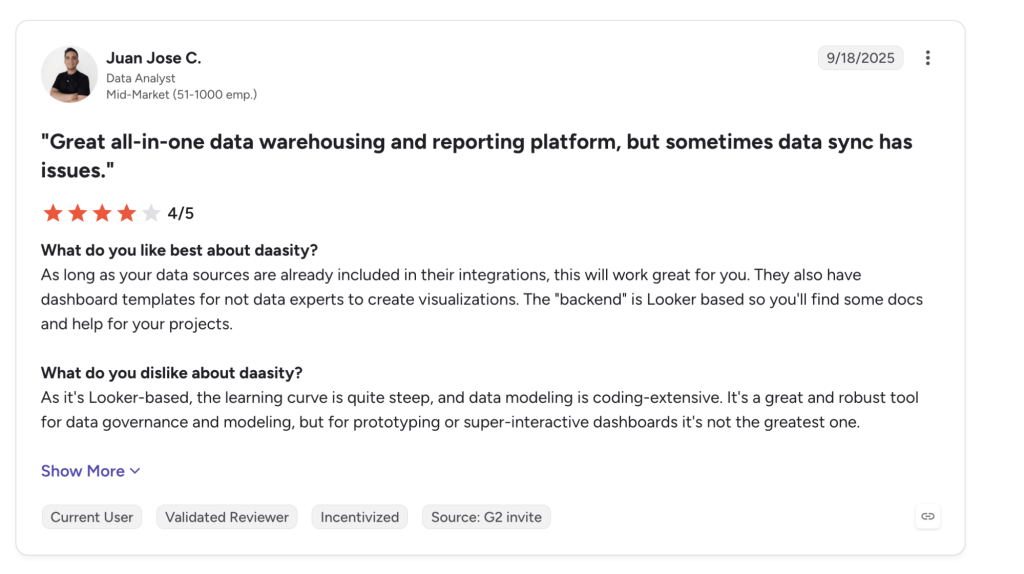
❌ Steep learning curve, with a Looker-based layer that reviewers say is coding-heavy to model against
❌ The most severe complaints are implementation timelines overrunning and extra cost to finish originally scoped work
❌ The warehouse is Daasity’s, not yours, which matters if data ownership is part of why you are buying a warehouse

Google Analytics 4: the free baseline
Google Analytics 4 is the free web analytics platform used by many ecommerce sites. It tracks website traffic and customer behavior, but it is not a complete ecommerce reporting layer.
Best for
Understanding on-site customer behavior, acquisition, and the purchase funnel. Use it for website traffic, product views, bounce rates, event tracking, funnel analysis, and cohort analysis rather than as your main revenue reporting system.
Key features
- Ecommerce reporting including the purchase journey and checkout journey funnels, and item-level product views and revenue
- Event tracking, funnel analysis, and cohort analysis in Explorations
- Channel and SEO reporting, including a new AI Assistant channel added in May 2026 that separates ChatGPT, Gemini, and Claude referrals from the rest of organic traffic
- A BigQuery export, which is the standard escape hatch out of the GA4 UI
- Google Analytics 360 for enterprise volumes, commonly cited around $50,000 a year for roughly 25M events a month, though Google publishes no official pricing
Pricing
GA4 is free. The main costs are implementation and the analyst time needed to configure and work with the data.
Pros and cons.
✅ Free, universal, and already installed
✅ The only tool here that tells you what happens on your site before someone buys. If bounce rates and product views are the question, GA4 answers it
✅ The BigQuery export is a genuine escape hatch, and it is free on the GA4 side
Main limitations:
❌ No native cart abandonment rate metric. You compute it yourself in a funnel exploration
❌ Standard properties keep event-level data for 14 months at most, which quietly caps year-over-year analysis in Explorations
❌ Sampling kicks in on larger queries, thresholding hides rows involving demographic data, and high-cardinality dimensions get bucketed into “(other),” which eats long-tail SKU detail
❌ The AI layer is real but everything in it still carries a beta or experimental label
GA4 revenue may not match Shopify or other store revenue because consent modeling, ad blockers, client-side tracking, and refund handling differ from the store’s order records.
GA4 is also a common Coupler.io source. Moving Google Analytics 4 data into Sheets, Looker Studio, BigQuery, or an AI tool lets you combine it with Shopify orders and ad spend, keep longer reporting histories, and compare it with data Google does not have.
More ecommerce analytics tools worth knowing
The six tools above cover the main ecommerce analytics decision. The products below include website analytics tools for ecommerce, behavior analytics platforms, session replay, and experimentation software that answer adjacent questions.
| Tool | Category | What it’s for | Worth knowing |
|---|---|---|---|
| Mixpanel | Product and behavior analytics | Event tracking, funnel analysis, cohort analysis, customer segmentation, and user engagement over time | Free into the millions of events a month. Shipped an AI agent and MCP server in 2026 |
| Amplitude | Product and behavior analytics | The same job at a larger scale, with experimentation attached | Also free to a few million events, also now selling itself as AI analytics |
| Kissmetrics | Product and behavior analytics | Behavior analytics with a chat interface | Rebuilt as an AI-native product. Not the tool you may remember. Reports on traffic arriving from ChatGPT, Claude, and Perplexity |
| Woopra | Product and behavior analytics | Customer journey analytics, event tracking, and user engagement | Effectively an enterprise option now, starting around $999/mo |
| Hotjar | Session replay and CRO | Heatmaps, session recordings, and session replay to see why a product page underperforms | Now part of Contentsquare. No longer sold as a standalone product |
| Optimizely | Session replay and CRO | A/B testing and experimentation for conversion rate optimization | Publishes no pricing at all, so expect a sales conversation |
| Adobe Analytics | Enterprise web analytics | Enterprise web and mobile analytics, customer journey analysis, and predictive analytics | Adobe’s 2026 development is pointed at Customer Journey Analytics instead. Treat as the legacy tier |
| Google Analytics 360 | Enterprise web analytics | GA4 with the limits raised: longer retention, higher sampling thresholds, a far larger BigQuery export | No official pricing. Commonly cited around $50,000/yr for roughly 25M events a month |
| Matomo | Privacy-first web analytics | Open-source, self-hostable analytics for full data ownership | Prices per hit, and ecommerce actions count as hits |
| Glew | Ecommerce reporting apps | Packaged store reports, product analytics, customer segmentation, and multichannel reporting | Acquired by Everest Group in March 2026. Pricing gated behind a demo |
In short, session replay and heatmaps show how people behave on a page, product analytics shows what users did across the customer journey, and revenue analytics shows what those actions produced financially. These tools often work together.
Which ecommerce analytics setup should you pick
Start with one question: do you want a tool to handle attribution modeling for you, or do you want the underlying data so you can build your own analysis?
Use the table below to match that choice to your situation.
| If this is you | Start with | Why |
|---|---|---|
| Shopify-first DTC, you want profit and attribution in one dashboard and you don’t want to build it | Triple Whale | The default answer for a reason. The free tier lets you start well below the revenue level it used to require, though it has no AI and no multi-touch attribution |
| Spending heavily across three or more channels, with someone in-house whose job includes reading the model | Northbeam | Attribution accuracy is what it’s bought for and what it rates highest on. Below roughly $50K/mo in ad spend the model doesn’t have the signal to justify the price |
| You want ecommerce BI with attribution attached, rather than attribution with reporting attached | Polar Analytics | The most complete ecommerce BI on this list, with a governed semantic layer so every metric means one thing everywhere |
| A meaningful share of revenue happens off your own storefront: Amazon, wholesale, retail | Daasity | It has already solved an omnichannel modeling problem that would take an internal team a long time to solve badly |
| You want to know what happens on your site before someone buys | GA4 | Free, and nothing else here answers that question. Just don’t run your reporting out of it |
| You run several stores, or you’re an agency running many, or you want your reports in the tools you already open | Coupler.io | Your schema, your destination, flat pricing that doesn’t move when you have a good quarter |
| You bought one of the above and keep hitting questions it won’t answer | Coupler.io, underneath it | The packaged tool keeps doing its job. The data layer handles everything outside its model |
These options are not mutually exclusive. Packaged analytics tools for ecommerce can handle attribution and standard reporting, while a data layer can cover custom KPIs, additional sources, and reporting outside their built-in models.
A packaged tool works well for the metrics, sources, and reports it supports. A data layer becomes useful when you need a custom metric, another source, a report its UI cannot build, or a view across several stores.
With a data layer underneath, those requests can be handled without waiting for a new product feature or repeating manual CSV exports.
Many teams use both: packaged analytics for standard measurement and a data layer for everything outside the packaged model.
Scope your data stack across 400+ sources
Book a demo with Coupler.ioFAQs
What’s the difference between ecommerce analytics tools and attribution tools?
Attribution tools assign credit to marketing channels using methods such as pixels, multi-touch attribution, or media mix modeling. Ecommerce analytics tools cover a broader set of KPIs, including revenue, average order value, customer lifetime value, customer retention, product performance, and customer behavior. Not every ecommerce analytics tool includes attribution.
Is Shopify’s built-in analytics enough?
For a young store, Shopify analytics may be enough. It becomes limiting when you need to reconcile marketing channels or calculate profit using costs that live outside Shopify, such as COGS, 3PL shipping, handling, and ad fees.
Do I need a data warehouse for ecommerce analytics?
Not usually. A data warehouse such as BigQuery becomes useful when you have high data volume, several years of history, or many sources to combine. Smaller teams can often run effective ecommerce reporting in Google Sheets or Looker Studio without a warehouse.
Why does my channel ROAS add up to more revenue than I actually made?
Because multiple ad platforms can claim the same sale. Google Ads, Meta, and TikTok may each report credit for one Shopify order, so adding their self-reported revenue can exceed actual store revenue. Blending channel data against store orders gives you a consistent base for ROAS and attribution analysis.
Can I analyze my store data with AI without a data team?
Yes. The important part is how the AI receives the data. Giving an LLM raw rows and asking it to calculate KPIs can produce unreliable results. A data layer can calculate the metrics first and send verified results to the model for analysis.
What KPIs should an ecommerce dashboard track?
At minimum: conversion rate, average order value (AOV), customer lifetime value (LTV), customer acquisition cost (CAC), ROAS, cart abandonment rate, and customer retention. Depending on the business, useful ecommerce KPIs can also include product views, customer segmentation, repeat purchase rate, and marketing campaign performance. Make sure profitability metrics use real costs.