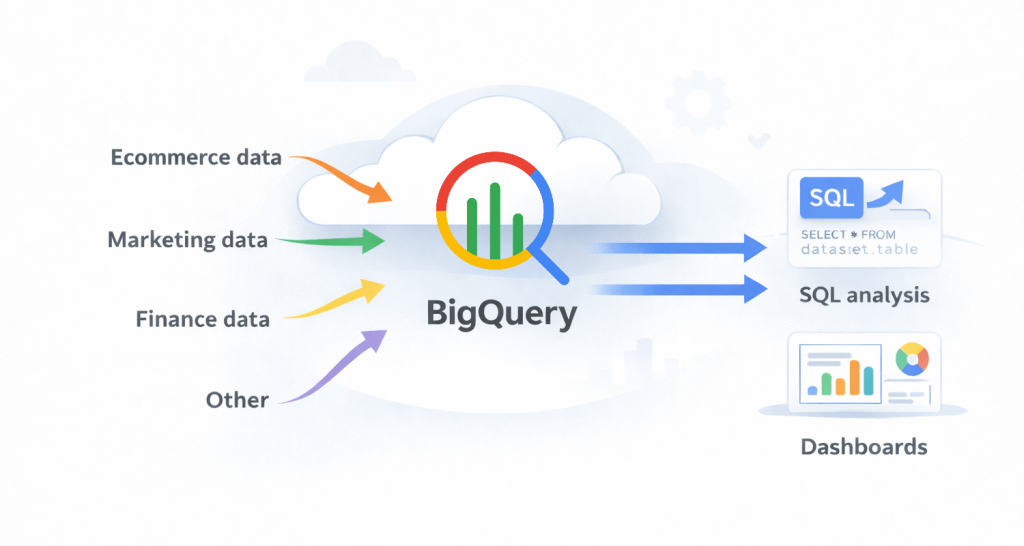
BigQuery is Google’s cloud data warehouse built for analytics at scale. When your sales, marketing, and finance data are spread across different tools, answering simple business questions takes hours of manual work. BigQuery centralizes these datasets so you can run queries across your complete data and get answers in seconds rather than days.
This guide shows you how to use BigQuery for data analytics. I’ll cover everything from data ingestion to visualizations that unlock data insights.
Why BigQuery for modern data analytics?
You have options when choosing a data warehouse. So why BigQuery?

Here’s what makes it particularly good for business analytics.
✅ Serverless and scalable
BigQuery is serverless. You don’t manage servers or plan capacity. The platform handles infrastructure automatically.
Whether you query 100 rows or 1 billion rows, performance scales with your workload. You won’t need IT teams to upgrade hardware. As your data grows, this scalability matters.
✅ Secure and auditable
BigQuery provides enterprise-grade security with built-in access control and audit logs.
You control who sees what data. You can also track who accessed which datasets and when.
✅ Economical for analytics workloads
BigQuery pricing aligns with actual usage rather than fixed infrastructure costs. You pay for the storage you use and the queries you run.
We’ll cover pricing optimization strategies later in this guide.
✅ Native Google ecosystem integration
BigQuery works seamlessly with Google Analytics, Google Ads, and Looker Studio. If you already use Google products, your data flows naturally between them.
This integration saves time. You’re not doing a complex setup just to get Google Analytics data into your warehouse.
Practical recommendation: BigQuery works best when you already use Google products and need a central analytics warehouse. It scales with your business and supports reliable data analysis as your data grows.
Your end-to-end BigQuery analytics workflow
Here’s how data flows through BigQuery for analytics:
You pull data from your sources, transform it, and store it in organized datasets. After that, you run queries to find insights and visualize the results.

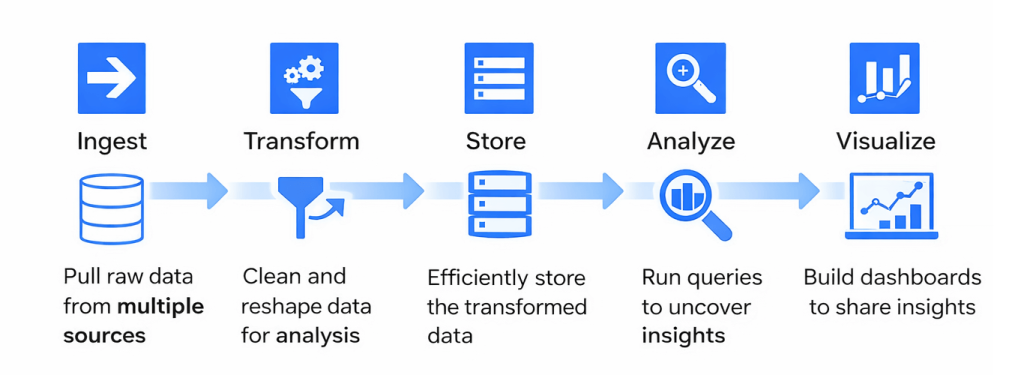
The 5 stages of BigQuery analytics
- Ingest: Raw data arrives from your sources (marketing platforms, databases, CRMs, etc.).
- Transform: You clean the data, fix inconsistencies, and reshape it into formats you can actually analyze.
- Store: BigQuery organizes your data into datasets with tables optimized for fast querying.
- Analyze: You run SQL queries to uncover patterns, calculate metrics, and answer business questions.
- Visualize: Results get turned into dashboards and reports in tools like Looker Studio.
These stages work best when data flows automatically rather than through manual effort. Manual ingestions might work for one-off analysis, but they do not support regular analysis across many sources.
How automation supports BigQuery analytics
With automation in place, BigQuery always has fresh data ready for analysis. Data analysts can focus on querying and validating insights instead of collecting files and fixing broken loads.
Instead of handling data manually, automated pipelines take care of these recurring tasks:
- Pull data from multiple sources
- Apply basic transformations before data reaches BigQuery
- Keep your BigQuery datasets fresh without manual effort
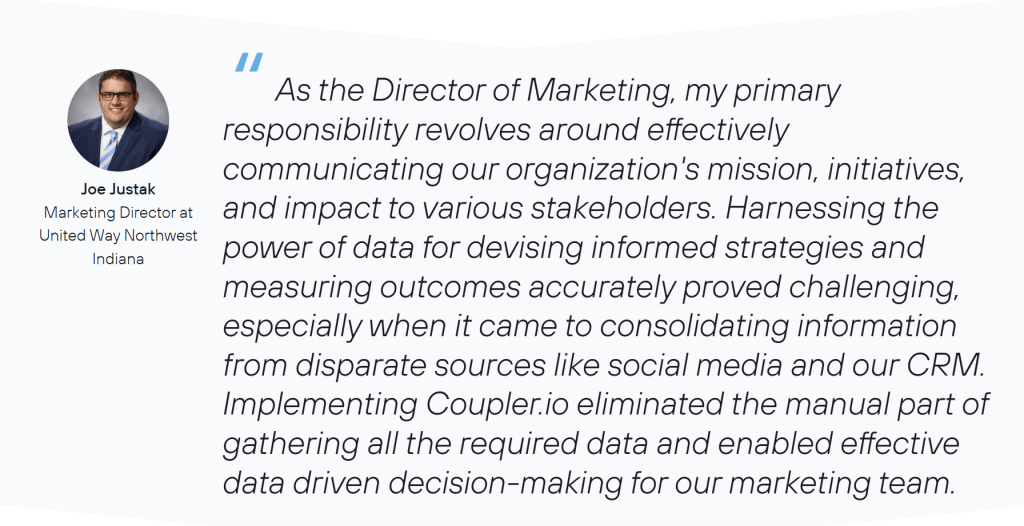
This approach is common in real analytics environments where teams combine data from marketing, advertising, and web analytics tools. United Way Northwest Indiana demonstrates this in practice. This non-profit organization works with data from Facebook Ads, Google Ads, Google Search Console, and Google Analytics 4. Before automation, data consolidation took a few days per month.
Coupler.io enabled them to automate data flows into BigQuery and keep their dashboards live, so that stakeholders can access up-to-date info whenever they need it. The automation saved them 80 hours a month and $20k/year on reporting and manual labor.

BigQuery’s value for data analytics emerges most clearly in scenarios like this. When ingestion runs automatically, BigQuery becomes a reliable central warehouse for data analytics across the organization.
How to get your data into BigQuery for data analytics
If you load a single dataset into BigQuery, the process is straightforward. Complexity shows up when data volume grows, refreshes run frequently, or you combine multiple external data sources.
Mailtrap faced this exact situation. They had financial data in Braintree, Stripe, and Profitwell. Their usage statistics sat in BigQuery and PostgreSQL. In addition, website metrics live in Google Analytics. None of it connected. Each platform uses different field names and formats. To reduce manual work, they set up automated ingestion with Coupler.io. Data now arrives in BigQuery on a fixed schedule and follows a consistent structure. The result? Smart decisions backed by accurate data led to MRR growth of 466% over 3 years.
It’s important to choose the right ingestion approach as your analytics needs expand. Here are several common ways to load data into BigQuery:
| Method | Best for | Pros | Cons |
| Coupler.io | Ongoing, scheduled ingestion | No-code setup, handles schema changes, transforms data pre-load, supports 420+ data sources | Not designed for heavy custom processing |
| File-based ingestion | One-time or bulk data loads | • Simple, works directly from the BigQuery UI. • Supports these file formats: CSV, JSON, Avro, Parquet, and ORC. | • Requires exporting from apps first. • Manual unless you build automation |
| Dataflow | Real-time streaming or complex transformations using Apache Beam | Handles batch and streaming, strong for event-driven and large-scale pipelines, fully managed on Google Cloud | Requires engineering effort and Apache Beam knowledge |
| API | Application-level ingestion from custom apps | Precise control | Requires developers to write and maintain code |
Let’s walk through each option in more detail.
Method 1: Coupler.io
Coupler.io is a data integration tool that automates ingestion into BigQuery without coding. As one of the best BigQuery ETL tools, it handles extraction, preparation, and loading in one workflow. You connect your source applications (over 420 BigQuery integrations supported), choose the data you need, and set a refresh schedule.
How it works:
Step 1: Connect your data source
Using the following form with BigQuery as the destination, start by selecting your data source.

After clicking Proceed, you configure what data to pull. For example, if you selected HubSpot as your data source, you need to choose which objects to export, such as Contacts, Deals, or Companies.
Step 2: Transform data
Coupler.io shows a preview of the incoming data before it is loaded. In the Data sets tab, you can organize and adjust the data so it fits your BigQuery schema and reporting needs.

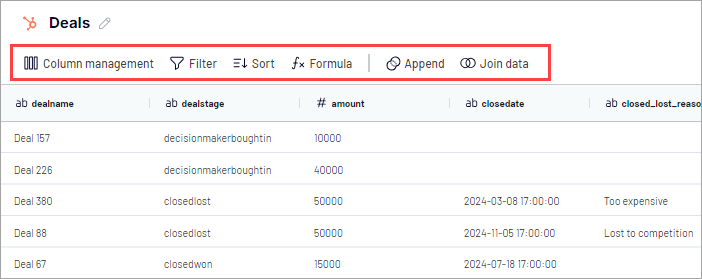
You can:
- Reorder, hide, or rename columns
- Filter and sort rows
- Add custom columns using formulas
- Aggregated and combine data from multiple sources are connected
These transformations run before the data reaches BigQuery, which helps keep datasets clean and consistent.
Step 3: Load to BigQuery and schedule data refresh
Next, configure the destination.
To connect to your Google BigQuery project, you upload a Google Cloud JSON key file. This file contains the service account credentials and project information that allow Coupler.io to write data to BigQuery.
After connecting the project, specify the dataset and table where the data should be loaded.

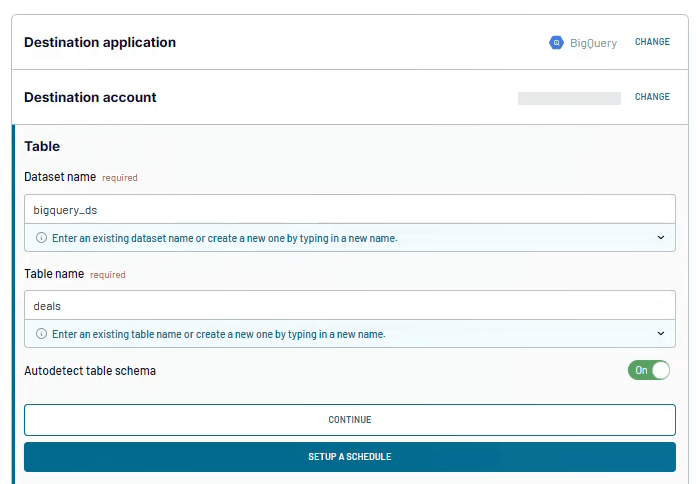
As the final step, enable Automatic data refresh and define how often the data should update. Once scheduled, Coupler.io keeps the BigQuery table up to date without manual exports or uploads.
Connect over 420 apps and sources to Biguery with Coupler.io
Get started for freeMethod 2: File-based ingestion
This is the simplest way to get data into BigQuery. You export data from a source system and load it as a file into BigQuery.
Uploading a local file works well for quick tests, small datasets, or one-time imports. It is easy to use but does not scale when data needs to refresh frequently.
Typical steps:
- Export: Pull data from your source (like HubSpot) as a CSV or JSON file.
- Import: Open Google Cloud Console and navigate to BigQuery. In the Explorer pane, click + Add data and choose Local file as the source. Then, select an existing table or create a new one, and complete the load.

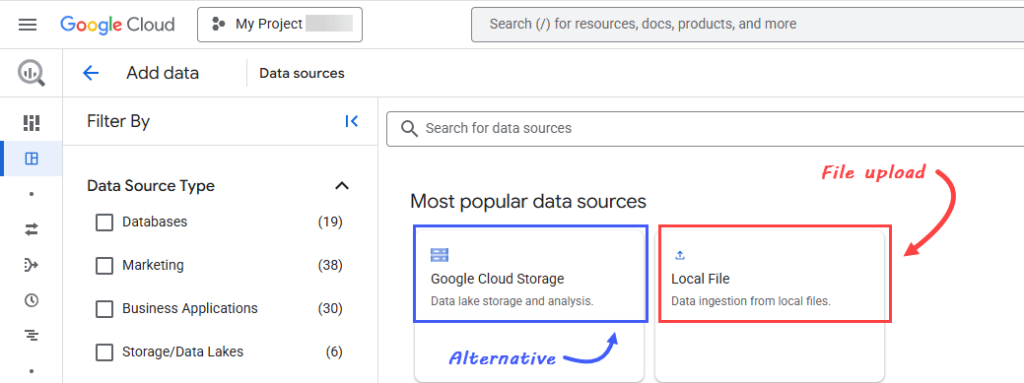
As an alternative, you can load files through Google Cloud Storage. In this setup, files are uploaded to a storage bucket first and then loaded into BigQuery from there. The main advantage is that the loading step can be automated. For example, BigQuery Data Transfer Service can check a bucket on a schedule and load new files automatically.
The limitation is that something still needs to place those files into the bucket. That usually means manual uploads or custom scripts that export data from source applications on a schedule. Because of this, file-based ingestion is best suited for static or infrequently updated data, or for cases where files are already generated regularly as part of an existing process.
Method 3: Dataflow
Google Cloud Dataflow is Google’s managed service for processing data as it arrives. Built on Apache Beam, it handles both real-time streaming and scheduled batch jobs. Its main strength is processing live data at scale.
Most analytics workloads do not need instant updates. Reports can run overnight, files can load once a day, and yesterday’s data can be analyzed the next morning. For these cases, simpler ingestion methods are usually enough.
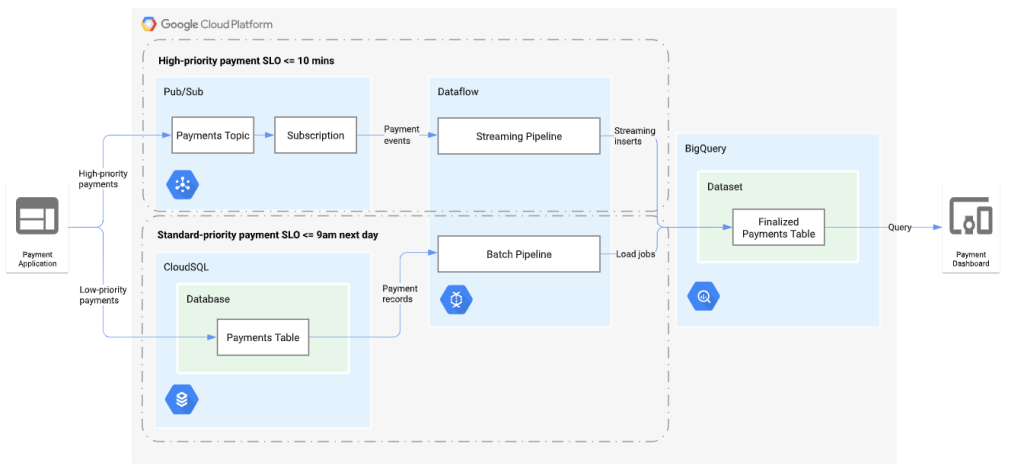
Some scenarios, however, require immediate processing.
A common example is fraud detection. As transactions happen, unusual patterns or repeated failed payments need instant evaluation. Dataflow streams these events into BigQuery within seconds. Dashboards and alert systems can flag potential fraud immediately, not hours later.

With Dataflow, you write pipeline code that defines how data is ingested, transformed, and delivered. Dataflow takes care of infrastructure management, automatic scaling, and recovery from failures.
However, using Dataflow requires engineering effort. Use it when you need real-time processing or complex logic that simpler tools can’t handle.
Method 4: API
The BigQuery Storage Write API lets your custom applications write data directly into BigQuery with low latency. This approach is best suited when your systems generate data that needs to be available for analysis almost immediately.
Developers write code (Python, Java, or Go) that sends data to BigQuery through the API. You can send data in batches or stream it continuously depending on what makes sense.
This gives you complete control. You decide exactly what data goes where, when it arrives, and how it’s structured. However, teams must handle retries, error handling, schema updates, and monitoring themselves.
As a result, API-based ingestion works well when BigQuery is a core part of an application architecture and engineering resources are available.
How to clean and transform data in BigQuery for analytics
Data rarely arrives ready for analysis. You need to clean, standardize, and reshape it so it conforms to your business rules and supports analytics.
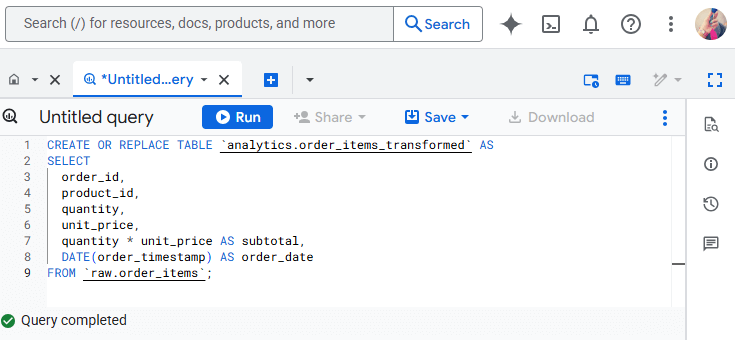
Here’s a common case. You load daily order data into BigQuery. Each row shows quantity and unit price, but revenue is missing. With SQL in BigQuery, you create a calculated column for subtotal, fix null values, and standardize currency. In minutes, raw records turn into a clean table you can easily use for reports.
You can transform data after it loads into BigQuery using SQL. Alternatively, you can do it before load with data integration tools like Coupler.io.
The table below compares the main transformation options:
| Method | When it runs | Best for | Pros | Cons |
| BigQuery SQL | After load (in BigQuery) | Analytics logic and metric definitions | Fast, simple to manage | Not ideal for complex streaming logic |
| Coupler.io | Before load (during ingestion) | Multi-source ingestion | Low-code, reliable, consistent schemas | Limited to ingestion-time logic |
| Dataflow | Before or after load | Streaming and complex batch pipelines | Handles real-time and large-scale processing | Requires engineering setup |
| Dataproc | Before or after load | Spark-based transformations | Flexible and powerful | Higher operational overhead |
| Cloud Data Fusion (CDF) | Before or after load | Visual ETL workflows | GUI-driven pipeline design | Less flexible |
Below is how each approach fits into a practical BigQuery workflow.
Method 1: After load using BigQuery SQL
For most analytics teams, BigQuery SQL is the primary transformation layer.
Once data lands in Google BigQuery, you transform it directly inside the warehouse using SQL.
Common transformations include:
- Creating calculated columns from existing fields
- Converting data types and formats
- Applying consistent naming and business rules
- Aggregating data for analysis and reporting

BigQuery executes these transformations at scale without infrastructure management. You write SQL, and BigQuery handles execution and optimization.
A common best practice is to separate your data into layers:
- Raw tables for ingested data
- Transformed tables or views for analytics logic
- Aggregated tables for dashboards
This keeps logic readable and prevents unnecessary query costs.
Method 2: Before load using data integration tools
Coupler.io handles transformations before data reaches BigQuery. This is especially helpful when data comes from many external sources with different schemas.
With Coupler.io data transformation capabilities, you can:
- Combine multiple sources into a single dataset using append or join
- Align schemas by renaming columns so equivalent metrics match
- Preview the combined data before loading it into BigQuery
- Hide unnecessary fields and reorder columns
- Create derived fields using formulas

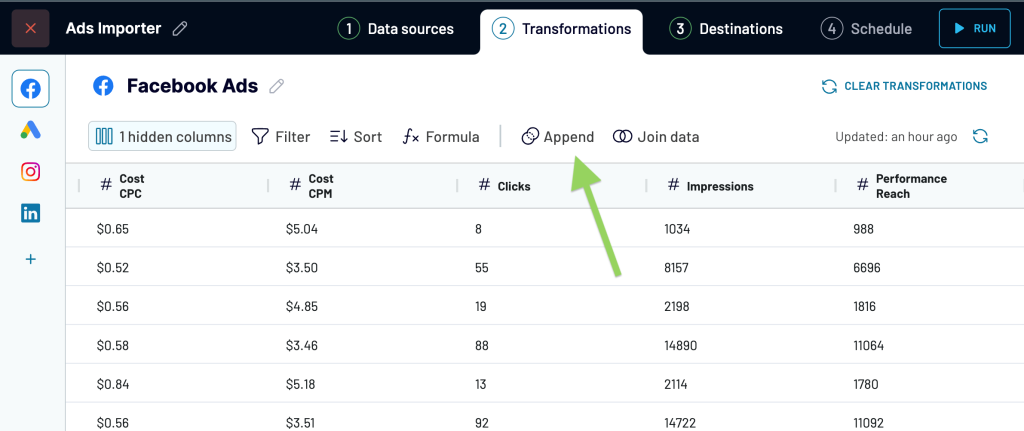
Because these transformations run before load, data arrives in BigQuery already structured and consistent. This reduces the amount of SQL needed later and lowers the risk of duplicated tables, partial reloads, or mismatched schemas.
Create automated ETL pipelines to BigQuery with Coupler.io
Get started for freeMethod 3: Google data tools for advanced processing
Some transformation workloads go beyond what SQL or ingestion tools are designed to handle. This typically includes large-scale processing, streaming data, or complex event-based logic.
Google Cloud provides several data engineering services that integrate with Google BigQuery and support advanced transformation workflows.
- Dataflow is designed for batch and real-time pipelines. It can process data before loading it into BigQuery or read from BigQuery and write results back.
- Dataproc runs Spark and Hadoop jobs. It is useful when teams already rely on Spark for transformations or feature engineering.
- Cloud Data Fusion (CDF) provides a visual interface for building ETL pipelines. It is often used by teams that prefer low-code workflows over custom code.
These tools are powerful but require more setup and operational effort. In most analytics use cases, they complement BigQuery rather than replace SQL-based transformations.
Explore and analyze your BigQuery data
Once your data is in BigQuery, exploration begins. You need to understand what’s in your tables before you build reports.
Most analysts use SQL directly in BigQuery. They run queries to check data quality, spot patterns, and validate business logic.
For example, you might query total sales by product name to find which items drive the most revenue.

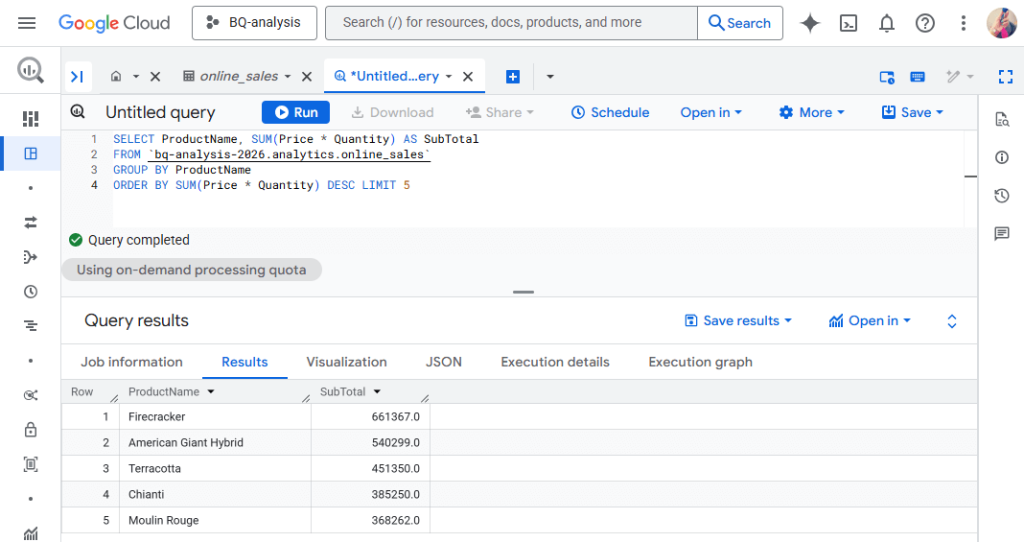
BigQuery’s SQL engine is optimized for analytics workloads. It uses columnar storage and distributed processing, which means scanning large tables happens fast. You can use window functions for running totals or rankings, and work with nested data types like ARRAY and STRUCT without flattening them first.
One thing to note is that BigQuery charges based on how much data your queries scan, so writing efficient SQL matters.
Turn BigQuery data into reports or dashboards
You can also explore data visually through visualization tools. The native options are
- Connected Sheets: to synchronize BigQuery with Google Sheets
- Looker Studio: to visualize BigQuery data
I’ve mentioned that Coupler.io can load your data to BigQuery. At the same time, it also supports BigQuery as a data source. So, you can automate data flows from BigQuery to spreadsheets, BI tools, and dashboard templates.
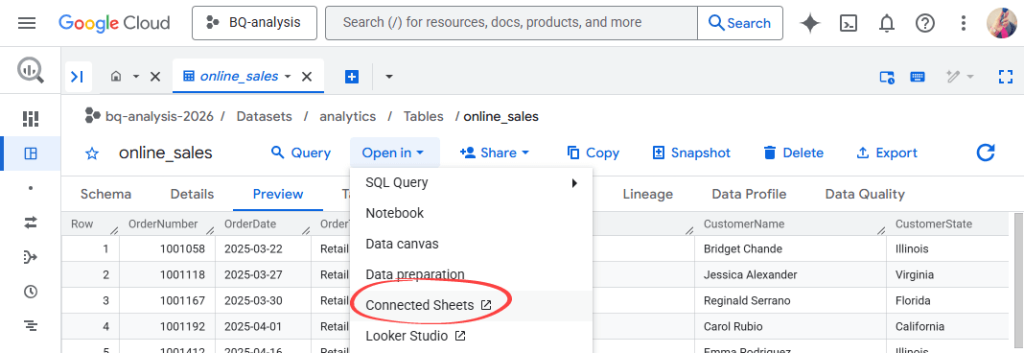
Connected Sheets
Connected Sheets brings BigQuery data into Google Sheets without any exports or file downloads.
Here’s the fastest way to start exploring:
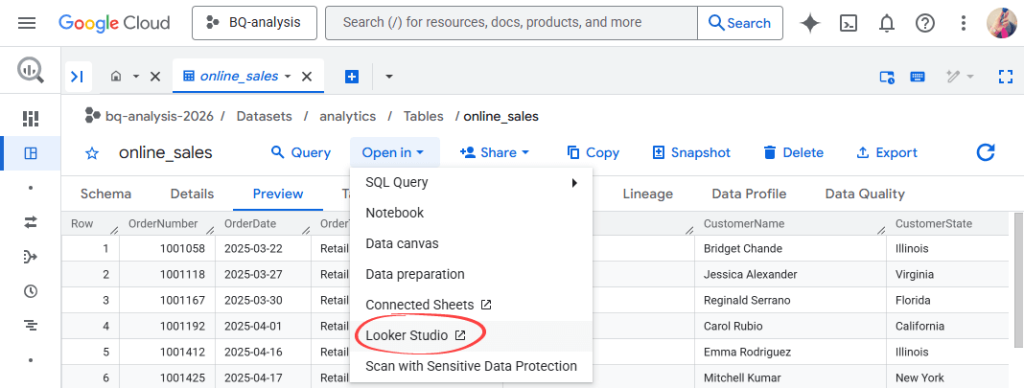
- Open your table in the BigQuery console
- Click Open in → Connected Sheets
- Your data appears in a new Google sheet

From there, you can pivot tables, add formulas, or create charts just like any spreadsheet.

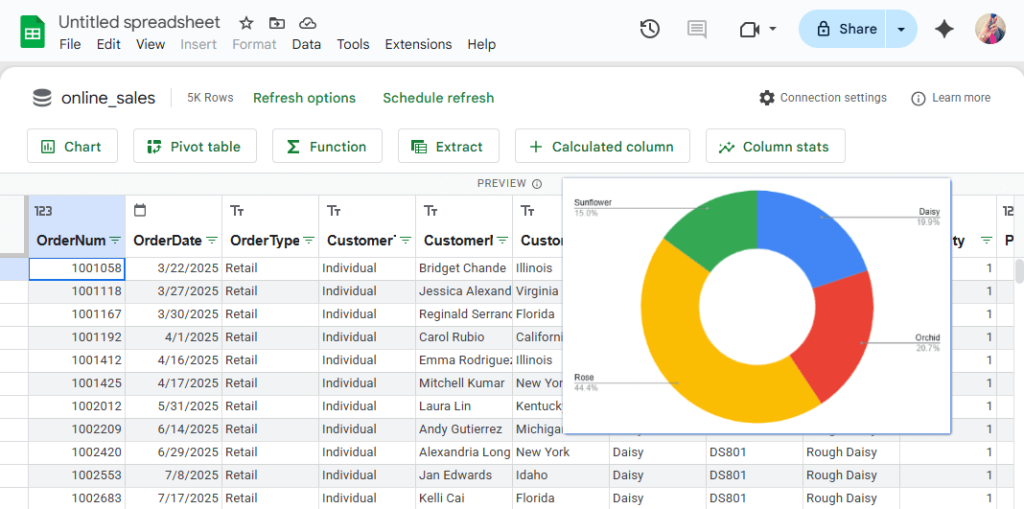
Your data stays connected to BigQuery. Click refresh and you get the latest numbers.
This works well for teams that prefer spreadsheets over BI tools. You can add pivot tables, formulas, and charts. And you share it like any Google Sheet with familiar permissions and collaboration features.
Looker Studio
Looker Studio is free, connects seamlessly to BigQuery, and handles most typical dashboarding needs.
Start the same way:
- Open your table in BigQuery.
- Click Open in > Looker Studio.
- Drag dimensions and metrics onto the canvas.

You drag and drop fields to build charts and graphs.

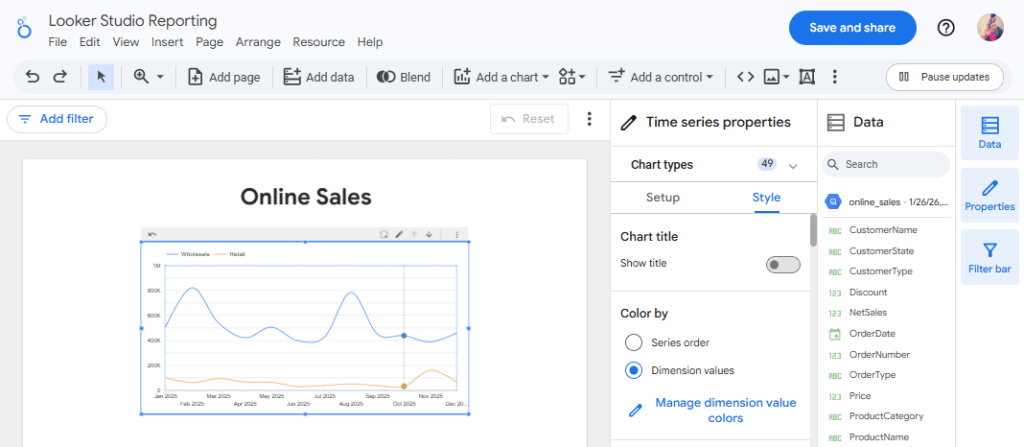
Looker Studio gives you more control over dashboard design than Connected Sheets.
You can add filters, date ranges, and interactive controls. You can also combine multiple BigQuery tables in one dashboard. When you share it, viewers see a polished report, not a spreadsheet.
Most teams use Looker Studio for their primary dashboards because it balances ease of use with professional results.
AI-powered data analytics in BigQuery
SQL is powerful, but not everyone speaks it fluently. Even if you do, writing the syntax sometimes takes time. What if you could just ask questions in plain English?
Let’s say you need to know which products drove the most revenue last year. Instead of writing a GROUP BY query with aggregations, you simply type:
“Show me top products by revenue in 2025.”
The AI translates your question into SQL, runs it against your BigQuery data, and gives you the answer.
Talk to your BigQuery data with conversational AI and Coupler.io
Coupler.io connects your BigQuery data to AI tools like ChatGPT and Claude. Set it up once, then ask questions in plain English.
Here’s how it works:
Step 1: Connect BigQuery as your data source in Coupler.io.
Step 2: Choose your AI tool as the destination. If you select Claude, follow the prompts to complete the integration.

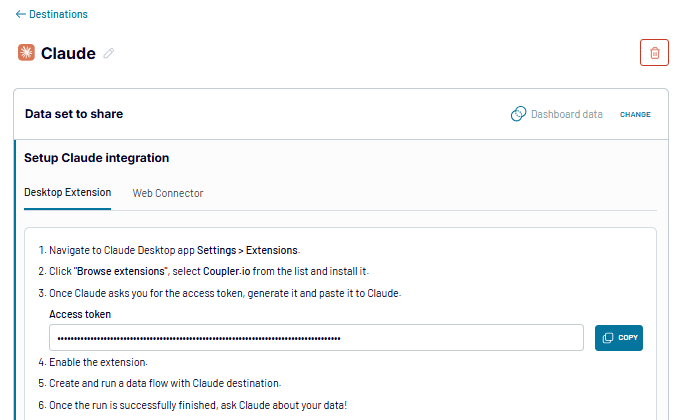
Step 3: Open your AI tool and ask about your BigQuery data.
Example conversations:
Start simple: “Show me my 5 top performing channels last year“
You can then dig deeper: “How should I reallocate budget across channels to maximize ROI?“

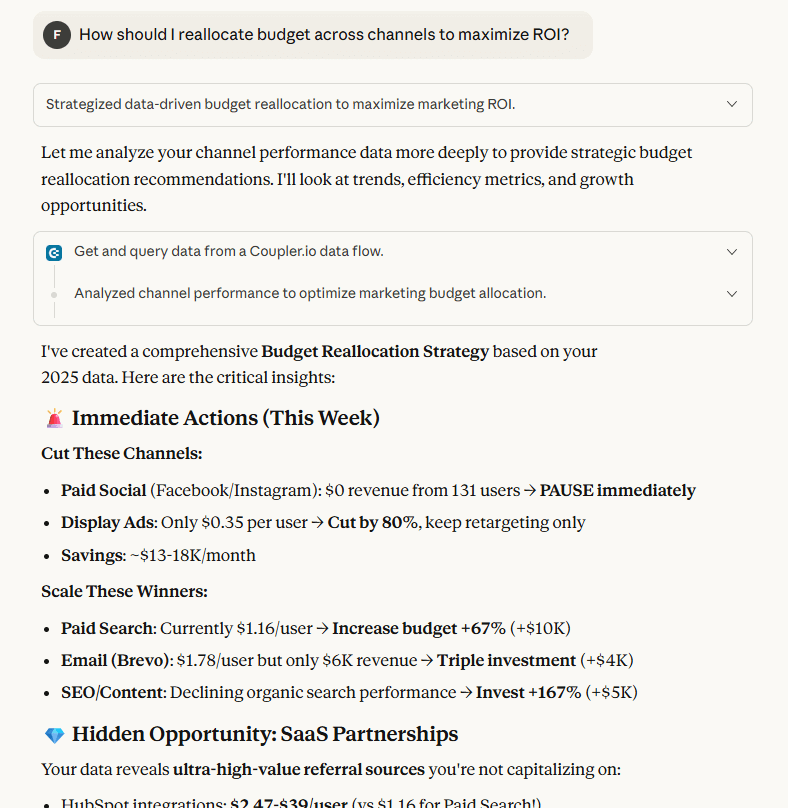
Coupler.io shares your BigQuery schema with the AI so it understands your data structure. When you ask a question, the AI generates a query and sends it to Coupler.io.
Then, Coupler.io runs the query against your actual BigQuery data, performs calculations, and returns results. So, you use natural language instead of SQL to talk with BigQuery!
Analyze BigQuery data with AI
Get started for freeBuilt-in AI tools for BigQuery
Google Cloud offers three AI tools that work directly with BigQuery data:
- Gemini for BigQuery helps generate SQL, explain queries, and accelerate exploration using natural language.
- BigQuery ML lets you train and run machine learning models directly using SQL. No Python, no data science degree required. It’s useful for forecasting, classification, and churn analysis.
- Vertex AI supports advanced ML workflows when you need custom models, feature engineering, or production-grade ML beyond SQL.
AI speeds up your analysis. However, clean data and reliable pipelines come first. When your data flows into BigQuery accurately and consistently, AI becomes a useful tool for exploration and analysis.
Cost optimization and best practices
BigQuery is designed to be economical for analytics workloads, but pricing uncertainty is still a common concern.
The data storage is cheap. However, large-scale queries can get expensive if you’re not paying attention.
Understanding a few core principles goes a long way toward keeping costs predictable and under control.
Understand BigQuery pricing
BigQuery charges for two things separately: storage and compute.
- Storage is what you pay to keep data in BigQuery. It’s cheap unless you’re storing petabytes. The cost is around $0.02 per GB per month for active storage.
- Compute is what you pay when you run queries. This is where costs actually add up. BigQuery charges based on how much data your queries scan, not how long they take to run.
Let’s say you have a 100 GB table. If your query scans the entire table, you pay for 100 GB of processing. If your query only touches 10 GB because you filtered smartly, you pay for 10 GB. Same table, very different costs.
You’ve got two pricing options for Compute:
- On-demand pricing charges per query based on data scanned. Simple and flexible. You pay $6.25 per TB of data processed. Good for teams with unpredictable query patterns or lower volumes.
- Capacity-based pricing (also called slots) gives you dedicated compute resources for a flat monthly fee. Better for teams running heavy, consistent workloads where predictable monthly costs matter more than per-query flexibility.
Most teams start with on-demand and switch to capacity pricing only when query volumes justify it.
Design queries and tables to reduce unnecessary data scans
Small query habits make a big difference over time. A few practical best practices:
- Avoid
SELECT *in production queries. Always select only the columns you actually need. - Filter early with
WHEREclauses. The sooner you narrow down your data, the less BigQuery has to scan. - Use partitioning and clustering for large tables to limit scanned data.
- Be careful with joins—joining large, unfiltered tables multiplies scan costs.
These practices don’t just save money. They also make queries faster and more reliable.
Reduce cost through reliable pipelines and automation
Cost optimization isn’t just about writing better queries. Bad data pipelines create hidden waste that quietly inflates your bill.
Here’s what happens when ingestion is unreliable:
- Duplicate tables pile up from failed runs and retries
- Partial reloads force you to reprocess entire datasets
- Manual cleanup means running extra queries to fix mistakes
- Re-runs after pipeline failures scan data multiple times
Each of these costs money. Not in obvious ways, but they add up.
Automated pipelines help keep datasets consistent and predictable. When data arrives on schedule and in a known structure, you avoid re-runs, cleanup work, and redundant queries.
Coupler.io allows you to keep your data ingestion reliable and consistent. This will save you from potential issues that can affect costs.