You’ve built an incredible brand, and now it’s time to give your data the “forever home” it deserves. While spreadsheets are great for a quick pulse check, they start to buckle under the weight of real growth. Moving to BigQuery is like upgrading from a rented apartment to a custom-built estate. With BigQuery data integration for marketing, you get the freedom to own every click and conversion indefinitely, far beyond the ‘expiry dates’ of standard platforms. Ready to see how it works in practice? This guide breaks down BigQuery’s powerhouse value for marketers, simple no-code integration tips, and the high-impact workflows that will transform your analytics.
Why BigQuery is a marketing powerhouse
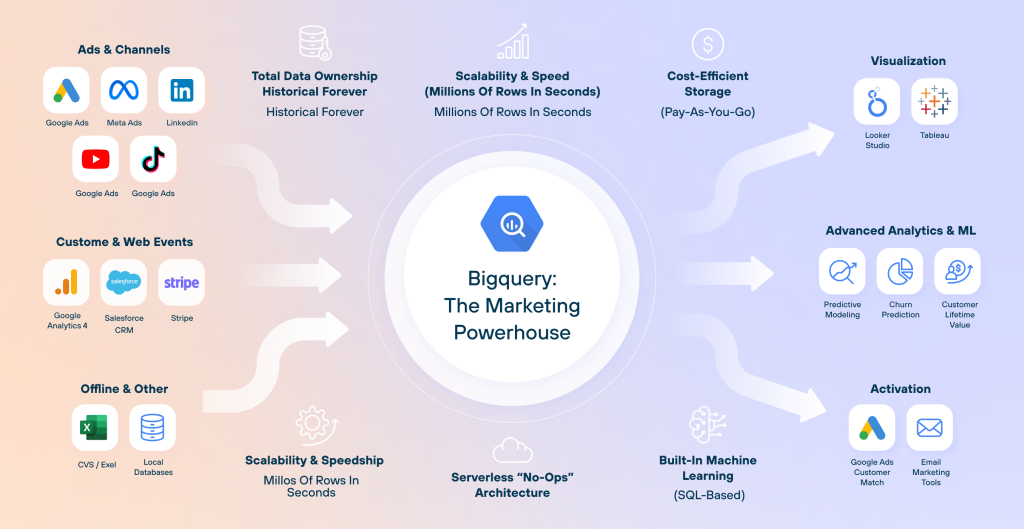
If your entire marketing strategy relies on the native reporting inside Google Ads or Meta, you are operating on borrowed time. API schemas change, platforms sunset metrics, and historical data eventually hit a delete date. If you can’t join your CRM data with your ad spend without a manual export-and-stitch process, your single source of truth is actually a fragmented lie. BigQuery changes the marketing landscape.

Here are BigQuery’s main marketing benefits worth noting:
- Data ownership
When you rely on native platform reports, you are a guest in their house. If an ad platform decides to sunset a metric or limit historical lookbacks, you lose your benchmarks. When you pipe your data into a warehouse, you create a permanent, immutable record. This level of BigQuery data integration ensures that five years from now, you can still analyze the exact path a customer took during a 2025 Black Friday sale.
- Infinite scalability & speed
A standard spreadsheet starts to chug at 50,000 rows and usually gasps its last breath at 1,000,000. BigQuery handles billions of rows in seconds. Whether you’re merging granular website event data with years of transaction history, BigQuery processes the math across thousands of Google’s servers simultaneously. It’s the difference between walking a marathon and taking a private jet.
- Cost-efficient storage
The biggest myth about “Big Data” is the big price tag. BigQuery is serverless, operates independently of traditional cloud storage, and is pay-as-you-go.. For most small-to-medium marketing teams, the storage costs are literally pennies. You aren’t paying for a massive server to sit idle; you only pay for the specific storage you use and the queries you run. It scales with your growth, not ahead of it.
- Serverless “no-ops” architecture
You’re a marketer, not a systems administrator. In the old days, most BigQuery data integration solutions required constant provisioning and manual maintenance. BigQuery is a no-op, meaning Google handles all the backend infrastructure. There are no servers to crash and no software to update. If you can write a basic SQL query (or better yet, ask an AI agent to write one for you), you have the power of an entire IT department at your fingertips.
- Built-in machine learning (BigQuery ML)
This is where the magic happens. Usually, predictive analytics requires a Data Science degree. With BigQuery ML, you can use standard SQL to build sophisticated models directly where your data lives. For example:
- Churn prediction: Identify which customers are likely to leave before they do.
- Propensity to purchase: Target users with a high likelihood of converting. It turns your data warehouse from a rearview mirror into a crystal ball.
But before you can predict the future, you need a clean history. With Coupler.io, you can automate the flow of analysis-ready data into BigQuery and provide the high-quality fuel needed for BigQuery ML to accurately predict churn or propensity to purchase.
One BigQuery connenctor for over 400 business data sources
Try Coupler.io for freeHow Coupler.io simplifies BigQuery data integration for the marketing stack
You’ve chosen BigQuery because you want a single source of truth, but getting your Meta Ads, Shopify sales, and Google Analytics to “talk” to each other can feel like a full-time job. Coupler.io, the no-code data integration platform, automates the entire flow. It acts as the intelligent translation layer for your marketing stack and ensures your data arrives in BigQuery clean, structured, and ready for analysis. Coupler.io turns your raw data into a competitive advantage without writing a single line of code.
Here is how Coupler.io turns days of data engineering into a few clicks:
- The integration layer
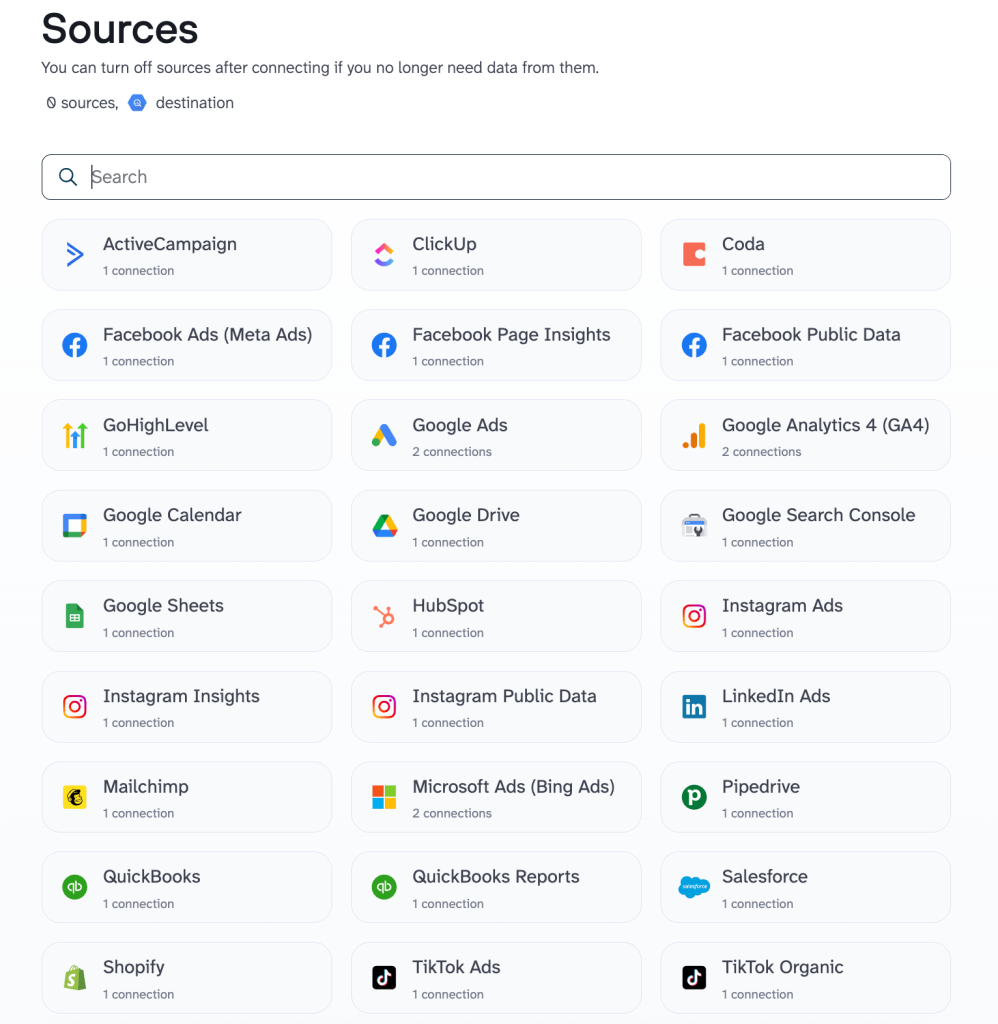
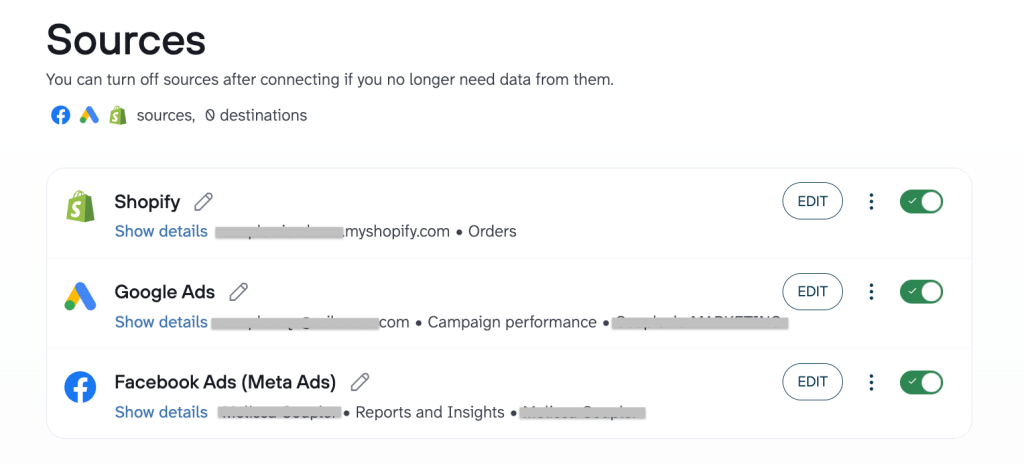
No more manual CSV exports or wrestling with buggy API docs. Coupler.io acts as a universal connector to handle the ETL process. You start with authentication to receive account permissions, and the data starts flowing from over 400 sources (including Google Ads, Meta Ads, TikTok, LinkedIn, Shopify, and Salesforce) directly into BigQuery. You simply authenticate your accounts, and the data starts flowing. No Python, no scripts, no tech skills required.

- The unified view
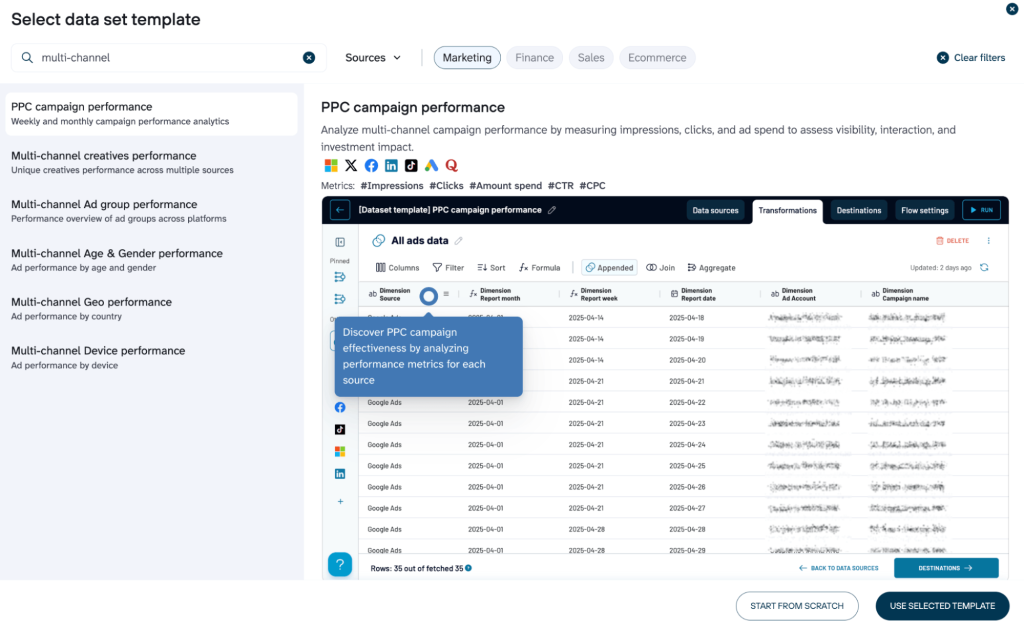
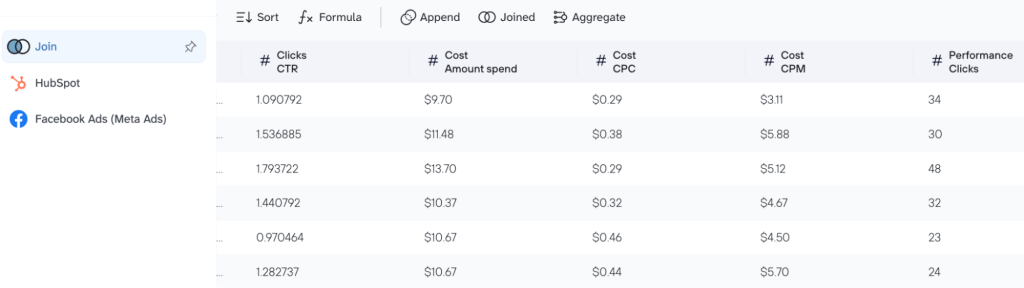
Data from different platforms is notoriously messy. Facebook might call it “Amount Spent,” while Google Ads calls it “Cost”, which leads to a mismatched data type. Coupler.io standardizes your disparate data into a clean, consistent format before it ever hits your warehouse. And you don’t even need to start from scratch. Coupler.io offers pre-built templates designed for marketing analytics that ensure your BigQuery tables are structured perfectly for analysis or business intelligence tools like Looker Studio, Power BI, or Google Sheets.

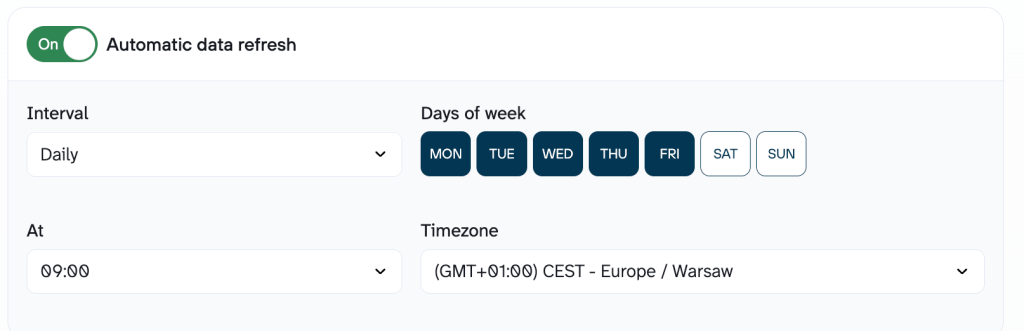
- Scheduled autorefresh
Data is only useful if it’s fresh. You can schedule your data to refresh automatically (every hour, daily, or weekly) to ensure your BigQuery warehouse is always a real-time reflection of your performance.

United Way Northwest Indiana best illustrates this real-world shift from manual exports to automatic updates. The “spreadsheet shuffle” used to cost their team several days of manual labor every month just to see their Facebook, Google Ads, and GA4 data in one place. They switched to an automated BigQuery warehouse via Coupler.io and traded those tedious exports for a live, self-updating dashboard. This approach to BigQuery data integration saved the organization 80 hours of work per month and $20,000 annually, and stakeholders got instant access to fresh insights without the need to touch a single CSV file.
- Advanced data transformation
The real power of Coupler.io lies in its ability to transform raw data into report-ready insights with the help of:
- Smart aggregation: Why look at three different dashboards to see your total spend? Coupler.io allows you to blend “Spend” and “Clicks” from Facebook, Google, LinkedIn, etc. into one table. This gives you a holistic view of your cross-channel performance without tedious manual work.

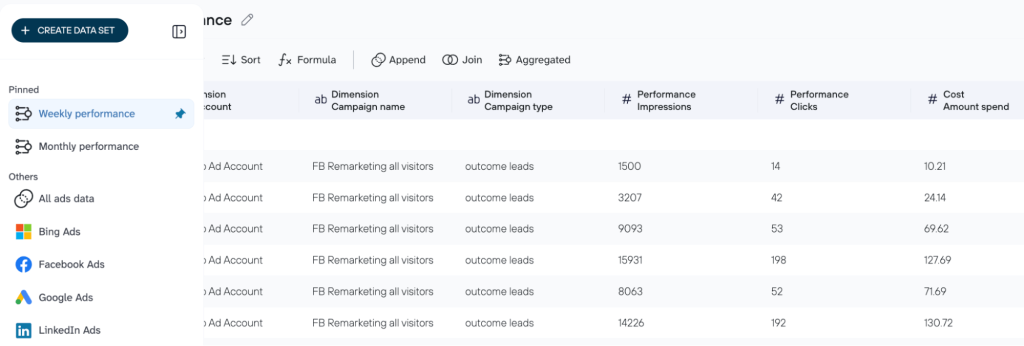
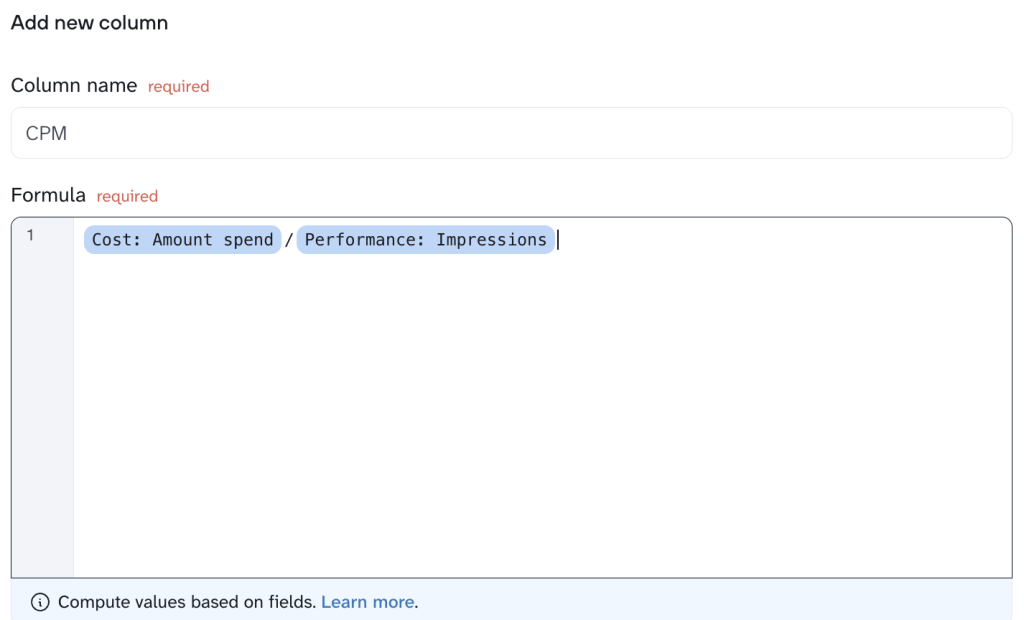
- Custom calculations: You can set up custom calculations directly within the Coupler.io interface, for example, to create automated KPIs like blended ROAS or CPM (Cost Per Mile). These metrics are calculated as the data moves, so they’re ready for analysis the second they land in BigQuery.

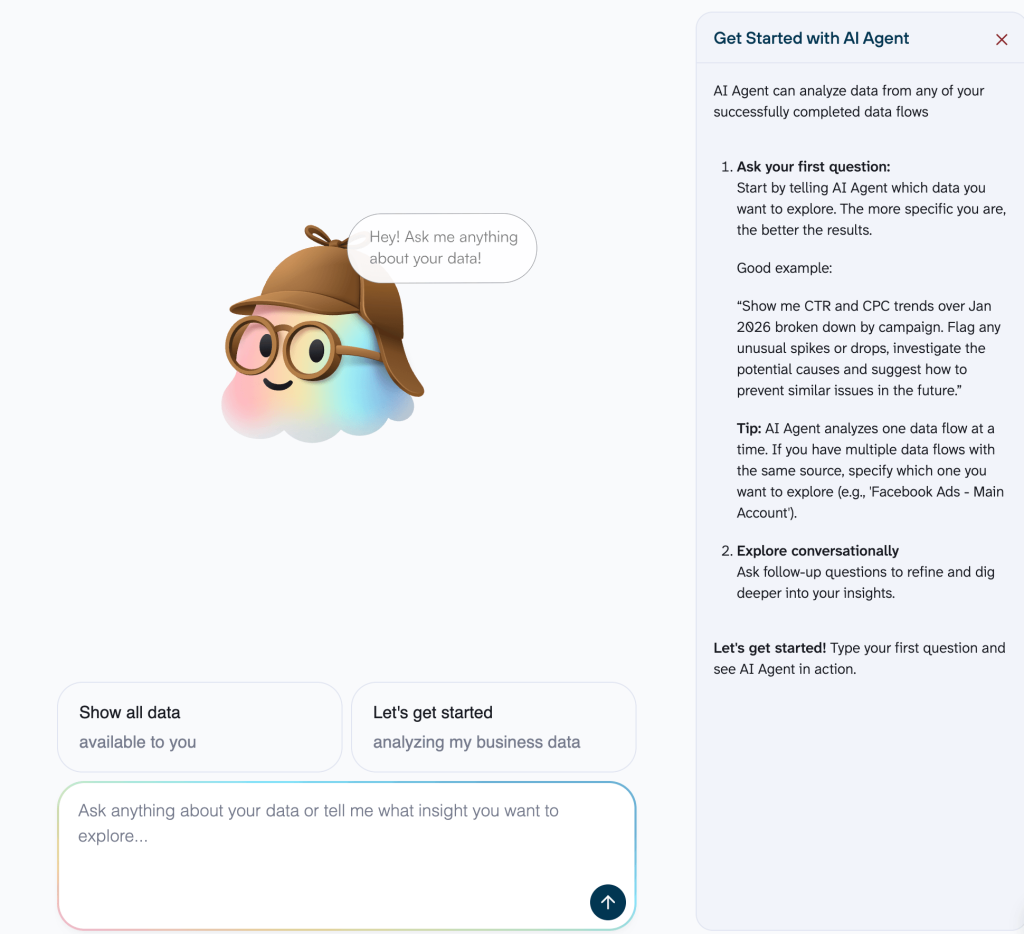
- AI-powered insights: We’ve finally reached the point where the technical gap has disappeared. With Coupler.io’s AI Agent, your curiosity for deep marketing metrics analysis is no longer limited by your coding skills. Instead of writing complex SQL queries to find a specific trend, you can use plain language:
“What was our average CAC across all video campaigns last month compared to the previous quarter?“
The AI Agent interprets your question, queries your data, and hands you the answer in seconds. It’s like having a senior data analyst on speed dial.

Load your marketing data to BigQuery with Coupler.io
Get started for freeBigQuery integration use cases: How to solve marketing’s hardest questions the simple way
A successful marketing strategy relies on accurate numbers, yet most data remains trapped in isolated platforms like Meta, Google, and Shopify. A move to BigQuery through Coupler.io ends this spreadsheet shuffle, because it turns disconnected silos into a single, automated source of truth.
#1: Unified multi-channel analysis
The challenge: Platforms often double-count the same customer, which causes Meta and Google to each claim 100% credit for a single sale. This silo effect inflates your metrics and leaves you guessing which channel actually drove your $2,800 in Shopify revenue. Integration in BigQuery deduplicates these overlaps, revealing exactly which ad did the heavy lifting.
The Fix: With Coupler.io, you can blend data flow from Meta Ads, Google Ads, and your e-commerce platform (like Shopify) into a unified, analysis-ready dataset for BigQuery. This creates a crystal-clear performance picture: Platform spend + Attributed conversions + Backend revenue = Automated, accurate marketing reporting.

How it works:
- Your team runs ads across Meta and Google, while sales are logged in Shopify. Each platform uses its own naming conventions (e.g., Meta calls it Amount spent, while Google calls it Cost).
- Coupler.io helps you automatically extract data from:
- Meta Ads & Google Ads (Spend, impressions, clicks, conversions, etc.)
- Shopify/Stripe (Actual orders, refunds, customer email, net revenue, etc.)
- In Coupler.io, you blend this data using shared keys like Date or Campaign ID. Coupler.io also allows you to transform and clean the data before it lands in BigQuery (e.g., to ensure Spend from all sources is summed up into one column).

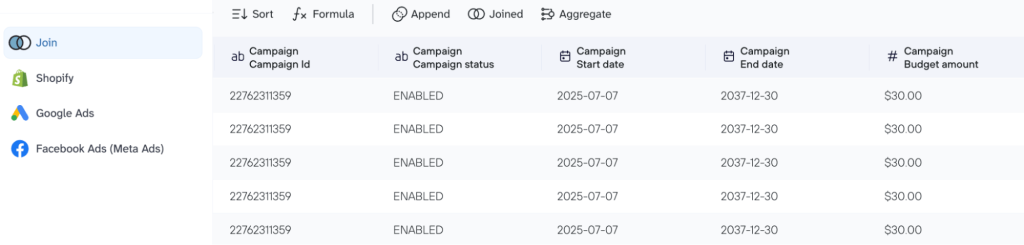
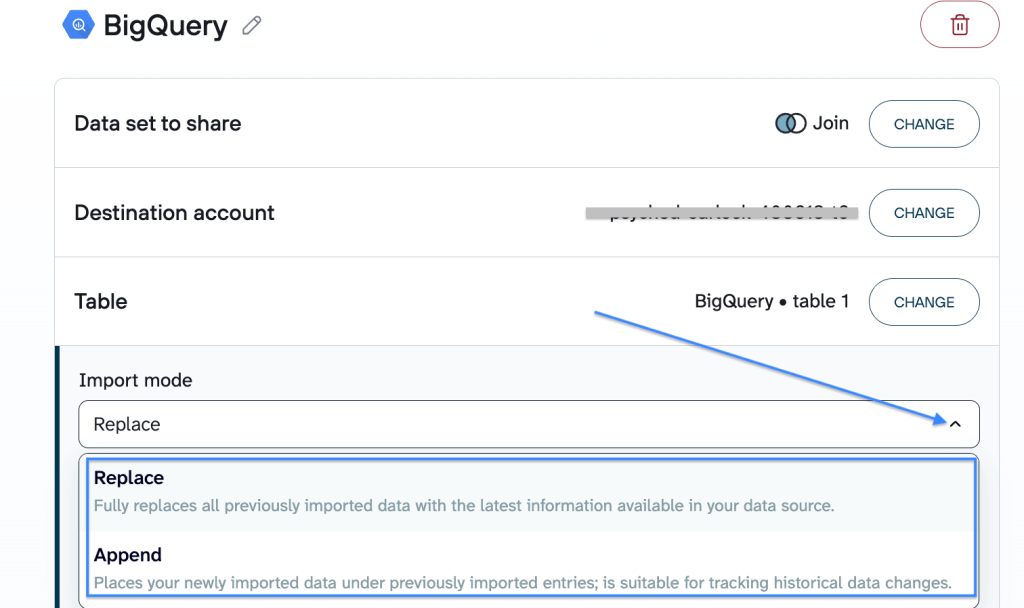
- You connect your BigQuery account, and this blended dataset instantly loads to the data warehouse, and the data updates on a schedule (e.g., daily) you set. As new clicks happen and new orders are paid, your single source of truth refreshes automatically, depending on the import mode you choose (Replace ot Append).

Result: A single, consolidated dataset that reveals the true relationship between your spend and your bank balance. Once you plug this unified view into BigQuery, you can:
- Calculate true blended ROAS (Total Shopify Revenue ÷ Total Ad Spend)
- Identify platforms that are over-reporting conversions
- Optimize small budgets for big impact (reveal which channel consistently delivers the highest-value customers to shift that extra $100 to the platform that actually moves the needle).
# 2: Ad performance meets organic reality
The challenge: Paid ads often trigger a Halo effect, which drives branded organic searches that show up as SEO wins rather than ad conversions. Without a unified BigQuery view, these overlapping journeys stay hidden and leave you unable to see how your paid spend and organic content actually power each other.
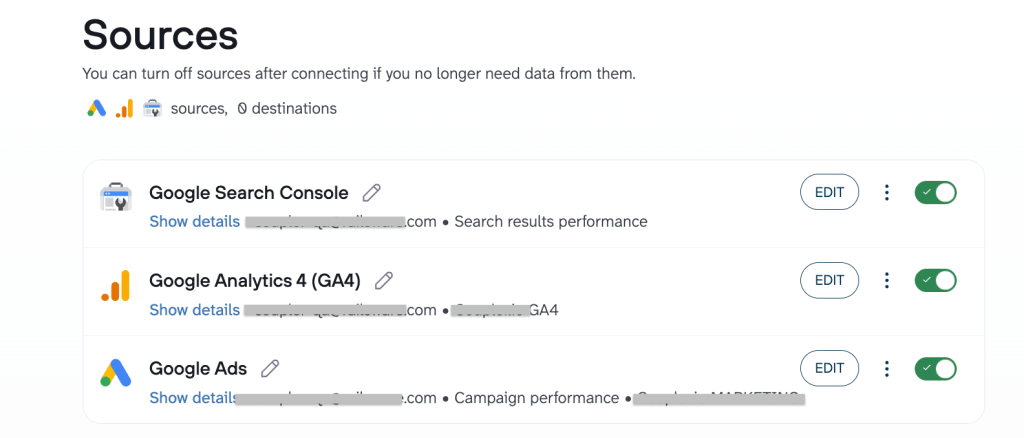
The fix: With Coupler.io, you can pull GA4 event data and GSC keyword performance into the same BigQuery environment as your paid ads. This approach to BigQuery data integration for marketing creates a unified Search & Web dataset: Ad spend + Organic keyword trends + On-site behavior = A complete contextual marketing map.

How it works:
- You’re running paid campaigns and building organic authority. GA4 tracks what users do once they arrive, and GSC tracks how they found you.
- Coupler.io automatically pulls granular data from:
- Google Ads / Meta Ads (Cost per click, campaign intent, creative performance).
- GA4 (Sessions, bounce rates, specific event conversions, user paths).
- Google Search Console (Queries, impressions, average position, organic CTR).
- In Coupler.io, you blend this data within several clicks using Landing page URL or Date as the common thread.

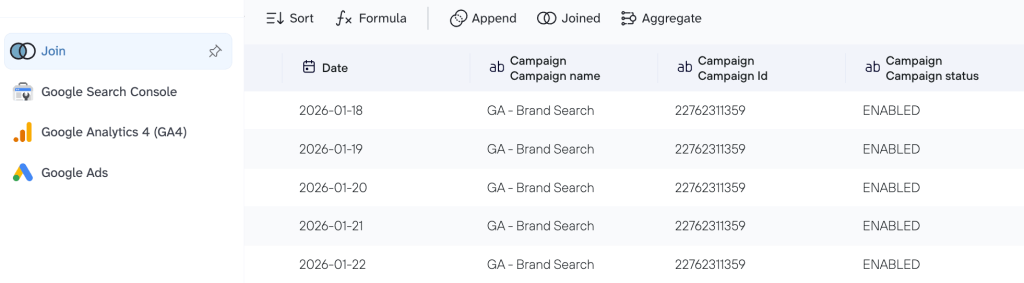
- You connect your BigQuery account, and this blended dataset instantly loads to the data warehouse, and the data updates automatically. As you launch a new ad campaign or a new blog post climbs the rankings, your BigQuery tables update to show the immediate impact on your overall site health.
Result: A consolidated dataset that bridges the gap between paid and owned media. Once you plug this unified view into BigQuery, you can:
- Calculate total search share (see your paid + organic visibility for your most important keywords to avoid bidding on terms where you already dominate organically)
- Identify LP performance
- Reveal the attribution lift (prove how paid ads influence organic branded searches)
- Optimize for quality, not just clicks (compare the time on page for paid users vs. organic users).
#3: How to connect ad spend to CRM revenue
The challenge: Your ad platforms can tell you which campaigns generate leads, but they have no idea which of those leads actually become paying customers. Without connecting your CRM to your ad spend, your marketing metrics analysis stops at the sign-up form. You might be pouring money into a Facebook campaign that generates hundreds of cheap leads that your sales team ultimately rejects, and ignoring a high-cost LinkedIn campaign that delivers your biggest deals.
The Fix: With Coupler.io, you can bridge the gap between your CRM (HubSpot, Salesforce, or Pipedrive) and your ad platforms and use BigQuery functions to create a full-funnel dataset: Initial ad click + CRM pipeline stage + Final invoice amount = Total marketing ROI.

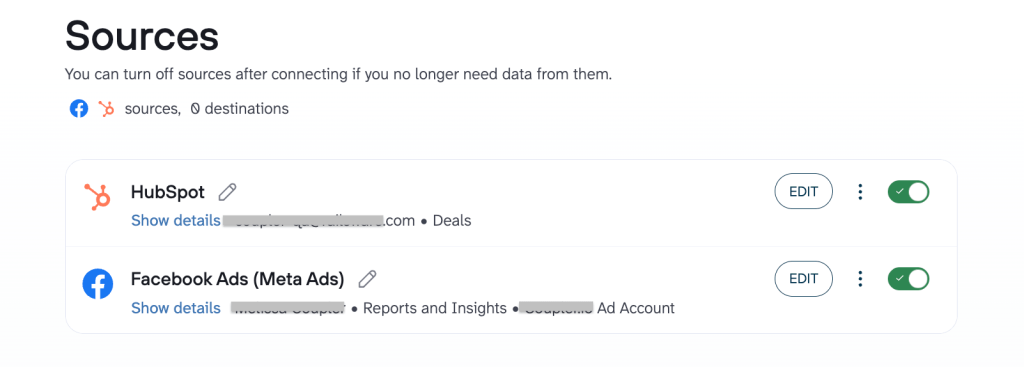
How it works:
- Your marketing team drives traffic via ads, while your sales team manages the pipeline and closes deals inside your CRM.
- Coupler.io automatically pulls data from:
- Google Ads / Meta Ads (Campaign name, ad group, and spend).
- CRM (HubSpot/Salesforce) (Deal stage, lead source, deal value, and owner).
- In Coupler.io, you join these sources using a shared UTM campaign or Email key. Coupler.io ensures the data is formatted correctly so your CRM “Deal value” can be instantly compared against your “Ad spend.”

- You connect your BigQuery account, and this blended dataset instantly loads to the data warehouse, and the data updates automatically as deals move from Qualified to Closed-Won.
Result: You finally move past cost per lead and start optimizing for profit. Once you plug this unified view into BigQuery, you can:
- Calculate true CAC
- Identify high-quality channels (which ad platforms deliver leads with the highest LTV)
- Optimize budget for revenue, not volume.
A great example of this gap between a “signed-up lead” and an “active customer” is Tradezella. The company faced this exact hurdle, with their Stripe financial data and product usage stats living in two different worlds. With Coupler.io, they funnelled both sources into BigQuery and created a unified user health dashboard that revealed exactly where users were dropping off. This data-driven clarity allowed them to refine their onboarding flow, which increased their user activation rate from 28% to 65% and significantly lowered their cost per active customer.
#4: Unifying revenue, retention, and inventory
The challenge: In e-commerce, your data is scattered across three different worlds. Your Shopify dashboard shows sales, your Ad platforms show spend, and Klaviyo shows email engagement. Without a single view, you can’t see the full picture: Does a high ROAS on Meta actually lead to profitable, repeat customers, or are you just “buying” one-time shoppers at a loss? And if you’re scaling ads for a product that’s nearly out of stock in your warehouse, you’re essentially burning your budget.
The fix: With Coupler.io, you can pull Shopify orders, Meta/Google ad spend, and GA4/Klaviyo lifecycle data into a single BigQuery environment. This creates a full-stack e-commerce dataset: Ad spend + Store revenue + Email lifetime value + inventory levels = A truly profitable store.

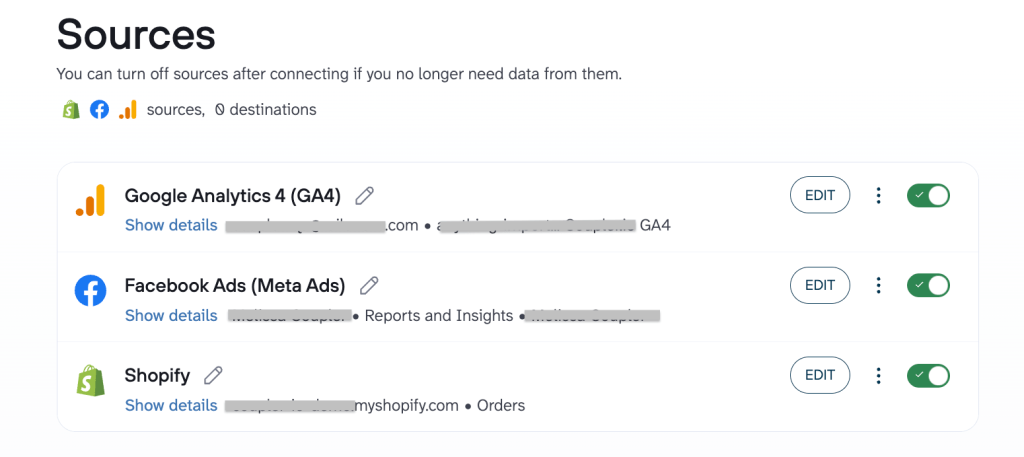
How it works:
- Your store processes orders 24/7, ads drive new traffic, and email flows work to bring customers back.
- Coupler.io automatically pulls data from:
- Shopify (Orders, refunds, COGS, and current inventory levels).
- Google Ads / Meta Ads (Spend, clicks, and platform-attributed sales).
- Klaviyo / GA4 (Email open rates, flow revenue, and on-site behavior).
- In Coupler.io, you join these sources using Customer email or Product SKU as the common thread. Also, in Coupler.io, you can standardize the data so that a Refund in Shopify correctly offsets the Revenue in your ROI calculations.

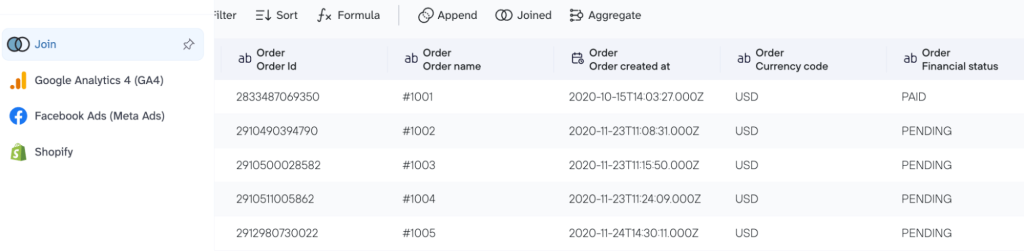
- You connect your BigQuery account, and this blended dataset instantly loads to the data warehouse, and the data updates on a schedule you choose. If a specific SKU’s inventory drops below a certain threshold in Shopify, your BigQuery table can flag it to alert you to pause the corresponding ad campaigns.
Result: You move from tracking sales to managing profitability. Once you plug this unified view into BigQuery, you can:
- Calculate net ROAS
- Track LTV by acquisition channel
- Sync ads with inventory
- Identify “hero” products (that have the highest margins and best retention rates).
This transition from fragmented tools to a single source of truth is what allowed Mailtrap to scale its operations. Their team previously struggled with financial data scattered across Braintree, Stripe, and Profitwell, while usage stats and website metrics sat isolated in BigQuery, PostgreSQL, and GA4. With Coupler.io, they funnelled these mismatched formats into a structured BigQuery environment and replaced manual guesswork with a live, consistent data stream. This shift toward high-fidelity, automated reporting became the backbone of their strategy, which contributed to an MRR growth of 466% over three years.
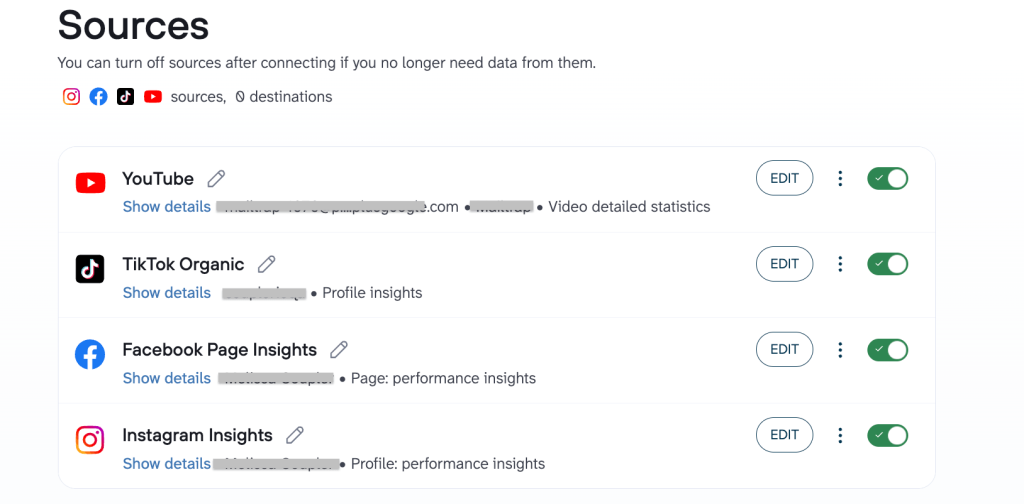
The challenge: Managing organic social media often feels like running five different businesses. Instagram tracks Likes, YouTube tracks Watch time, and LinkedIn tracks Impressions, but none of them talk to each other. Without a centralized view, you can’t see the big picture of your brand’s reach. You’re forced to log into five different native dashboards just to answer a simple question: Which platform is actually growing our community most effectively this month?
The Fix: With Coupler.io, you can bundle your organic performance from Instagram, Facebook, TikTok, and YouTube into a single BigQuery dataset. This creates a master social view: Total reach + Engagement rate + Video views + Follower growth = A unified brand authority map.

How it works:
- Your team posts content across every major social pillar, while each platform stores that data in its own unique (and often messy) API.
- Coupler.io automatically pulls data from:
- Instagram & Facebook pages (Reach, impressions, comments, and saves).
- TikTok (Profile views, video completions, and shares).
- YouTube (Subscribers gained, average view duration, and traffic sources).
- In Coupler.io, you blend these sources using Date or Content Topic as the common thread. Also, with Coupler.io, you can standardize the metrics so that an Engagement on TikTok and a Reaction on LinkedIn are counted accurately in your total brand health report.

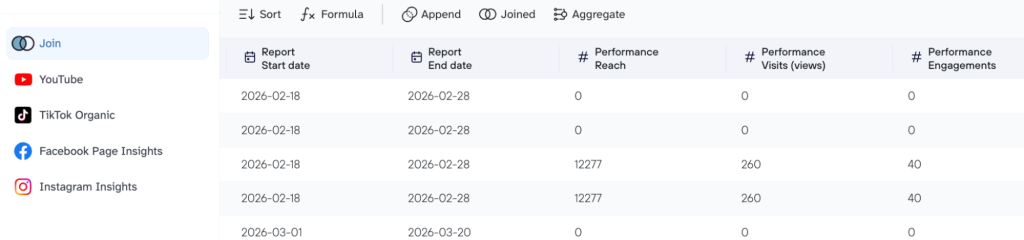
- You connect your BigQuery account, and this blended dataset instantly loads to the data warehouse, and the data updates on a schedule you choose. As a video goes viral on TikTok or a post trends on Facebook, your BigQuery tables reflect that growth in real-time, without you lifting a finger.
Result: You move from counting likes to analyzing influence. Once you plug this unified view into BigQuery, you can:
- Calculate total brand reach
- Identify content winners (spot which topics resonate across all platforms)
- Compare platform efficiency
- Correlate organic to sales (see if a spike in YouTube views actually leads to a spike in bottom-line conversions).
Get your business data to BigQuery without hassle
Try Coupler.io for freeNext steps: Launch your BigQuery marketing warehouse in 3 simple steps
While your competitors are still fighting with broken VLOOKUPs, you can be running a world-class analytics engine. Use this roadmap to connect your tools, automate your reporting, and finally see the real story behind your marketing spend.
1. Create your Google BigQuery project ✅
Log in to the cloud-based Google Cloud Console and create a new project. For most marketing teams, the “Sandbox” version or the free tier provides more than enough power to begin.
2. Connect your data sources via Coupler.io ✅
Sign up for a free Coupler.io account, choose your primary marketing platforms, create a unified, analysis-ready dataset, and link it to BigQuery without coding (you can also follow our tutorials for advanced setup). Setting up your BigQuery data integration this way allows you to select exactly which metrics you need and set a refresh schedule that keeps your analysis up-to-date.
3. Query with natural language ✅
Use the power of Gemini in BigQuery to handle the technical part. If you need a specific calculation for the dataset, simply ask Gemini in plain language: “Create a SQL query showing total spend vs. total revenue by date.“ AI will generate the code for you instantly.