BigQuery gives analysts a centralized environment where data from any source can be queried together. In this article, we focus on the value of BigQuery for data analysts: how they get data into BQ, automate ingestion with Coupler.io, and run queries once everything is in place.
BigQuery for data analysts: why multi-source analysis matters
For most analytics teams, data is spread across SaaS platforms, databases, and reporting tools. Each data source has its own export format, metric definitions, and naming conventions. Reconciling that data manually is slow, error-prone work since you need to match date ranges and normalize column names.
Cross-channel analysis sharpens the problem. Google Ads, Facebook Ads, GA4, and Search Console each report performance in isolation. Comparing them meaningfully requires either manual assembly or a centralized layer where the data coexists and can be queried together.
BigQuery is that layer. Once data from multiple platforms is loaded into a single warehouse, analysts can join, aggregate, and compare it using standard SQL. This is why BigQuery for data analytics has become the default approach for teams working across multiple platforms.
BigQuery data analytics capabilities
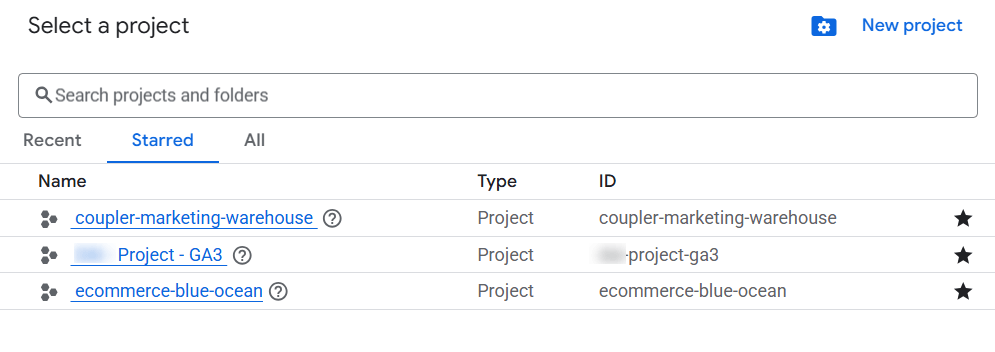
BigQuery is organized around three levels: projects, datasets, and tables.
A project is the top-level container tied to a Google Cloud billing account.

Within a project, datasets group related tables. For example, you might have one dataset for marketing data and another for financial data.

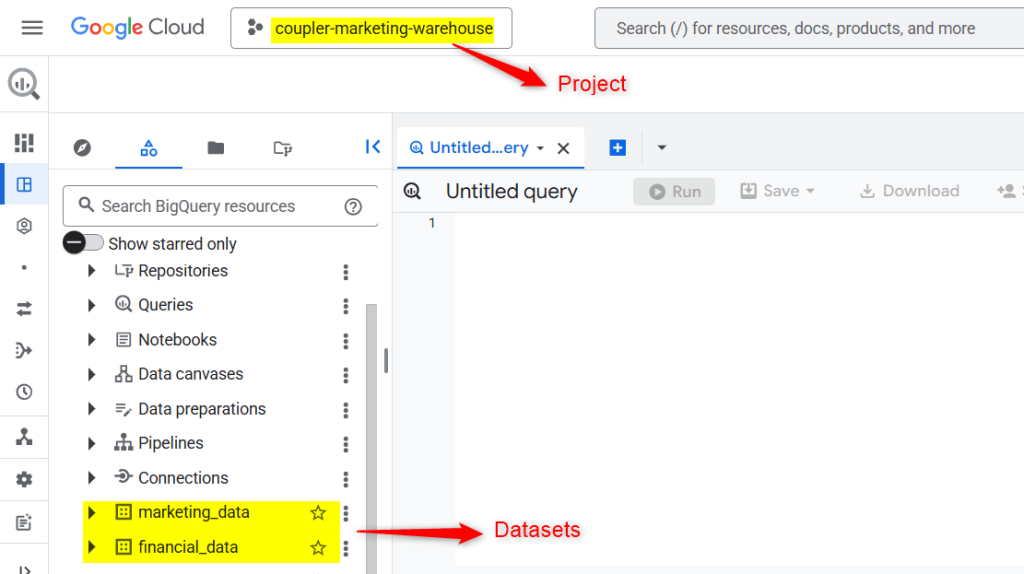
Tables within those datasets hold the actual rows and columns you query.
Because BigQuery is serverless, there is no infrastructure to provision or maintain.
You write SQL, run a query, and BigQuery handles execution across its distributed infrastructure automatically. Billing is based on the amount of data your queries scan, with a generous free tier (1 TB of query processing per month at the time of writing), which makes it accessible for teams just getting started.
Analysts interact with BigQuery using standard SQL, which means the learning curve is minimal for anyone who already works with relational databases.
BigQuery also connects natively to BI tools, where Looker Studio links directly to BigQuery tables while Power BI, Tableau, and similar tools connect via standard connectors.
This makes BigQuery a natural hub: data flows from connected sources, gets queried and transformed in SQL, and appears in dashboards without additional data movement.
For cross-channel marketing work specifically, the relevant capabilities are:
- Joining datasets from different sources
- Aggregating millions of rows in seconds
- Running reusable SQL queries for recurring reports
- Comparing performance across platforms
- Powering dashboards in BI tools like Looker Studio and Power BI
An analyst can join advertising spend from Google Ads with conversion data from GA4, or compare organic search performance from Search Console against paid search campaigns. But this is only possible once all that data exists in one place.
Ways analysts typically import data into BigQuery
Getting SaaS data into BigQuery is the foundational challenge. There are three common approaches, each with real tradeoffs.
Manual CSV exports
The simplest method is downloading CSV files from each platform and uploading them into BigQuery. This works for one-off analysis or small datasets, but it does not scale.
Every reporting cycle requires re-downloading files, reconciling column names that differ across platforms, fixing date formats, and re-uploading.
The result is fragmented workflows and a high risk of version errors. Particularly when multiple people are involved in the process. It is also fundamentally reactive, meaning your data is only as current as the last time someone ran an export.
Custom API scripts
Teams with engineering support sometimes build their own extraction pipelines using platform APIs.
This approach offers complete control over what gets pulled and how it is structured. The tradeoff is ongoing maintenance. Marketing platforms update schemas, modify authentication flows, and deprecate endpoints without warning.
When a pipeline breaks, it often does so silently, and reports stop updating while analysts assume data is current. For teams without dedicated data engineers, this overhead becomes a bottleneck rather than a scalable solution.
Coupler.io
Coupler.io is a no-code data integration platform that automates data flows from SaaS tools to BigQuery. It connects to over 400 data sources, loads data into BigQuery on a configurable schedule, and handles schema changes so analysts don’t have to. For most analytics teams managing multiple platforms, this is the approach that scales.
Automate data load from 400 business apps to BigQuery
Try Coupler.io for freeHow Coupler.io automates the data pipeline into BigQuery for data analysts
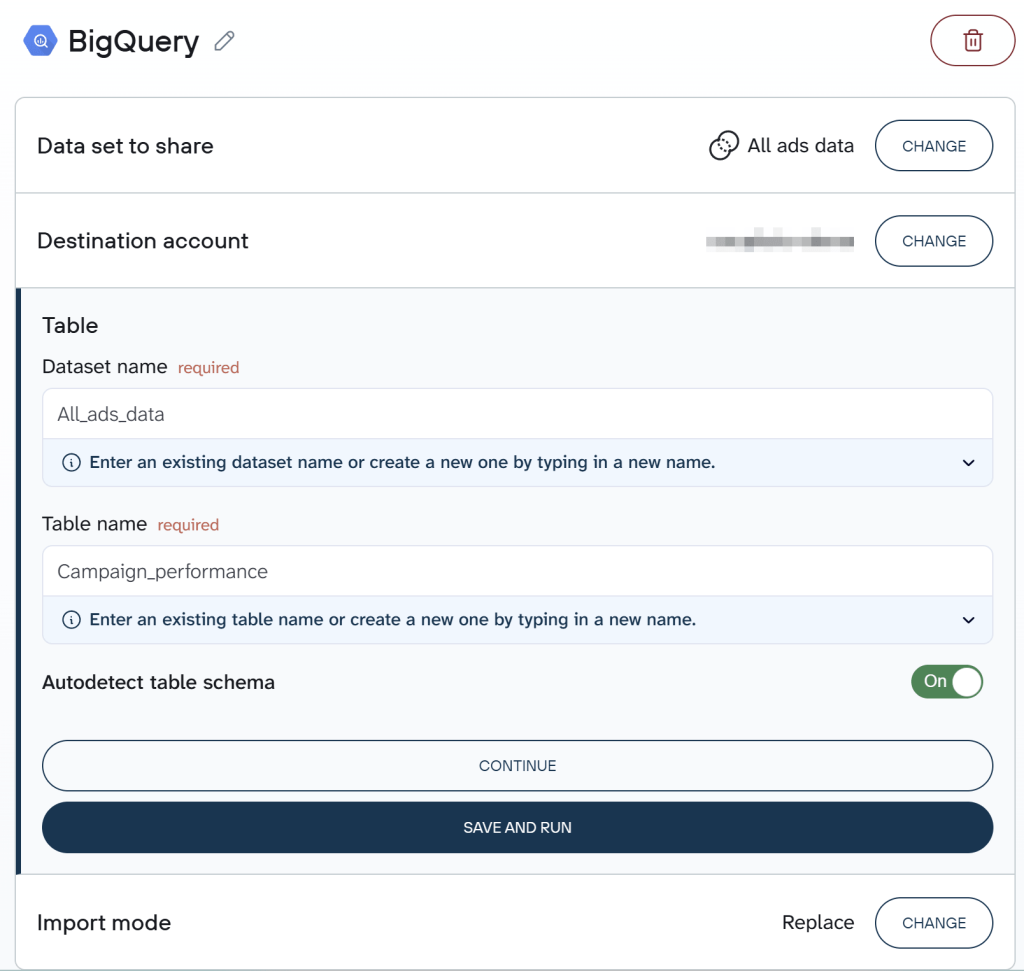
With Coupler.io, each SaaS platform becomes a source in a data flow that feeds into BigQuery.
Analysts select which data to pull and choose a destination dataset and table in BigQuery. From that point forward, the data flow runs on a schedule automatically. No CSV exports, no API maintenance, no engineering tickets. The automatic data refresh without manual effort makes BigQuery for data analytics sustainable.

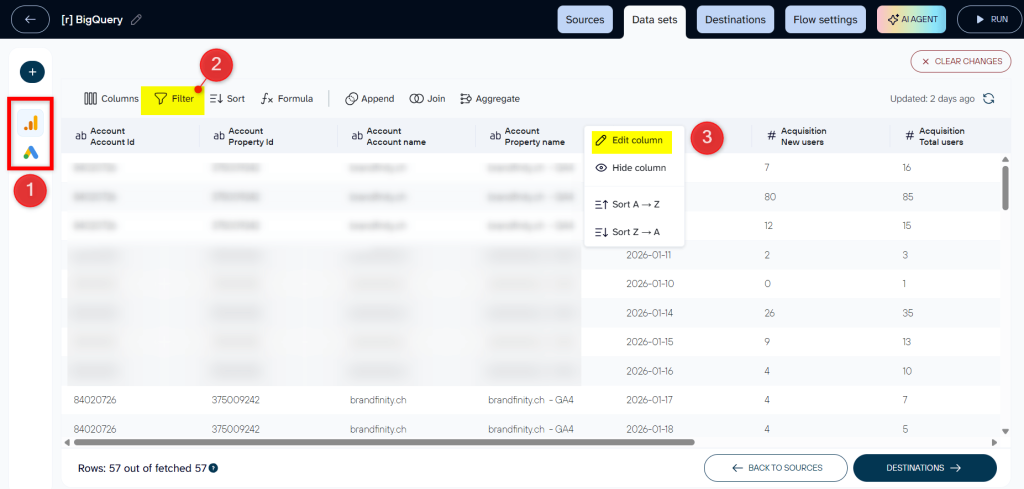
Optionally, Coupler.io provides data transformations such as filtering rows, renaming columns, blending data from different sources, and adding calculated fields. You can prepare your data set before it lands in BigQuery with just a few clicks.

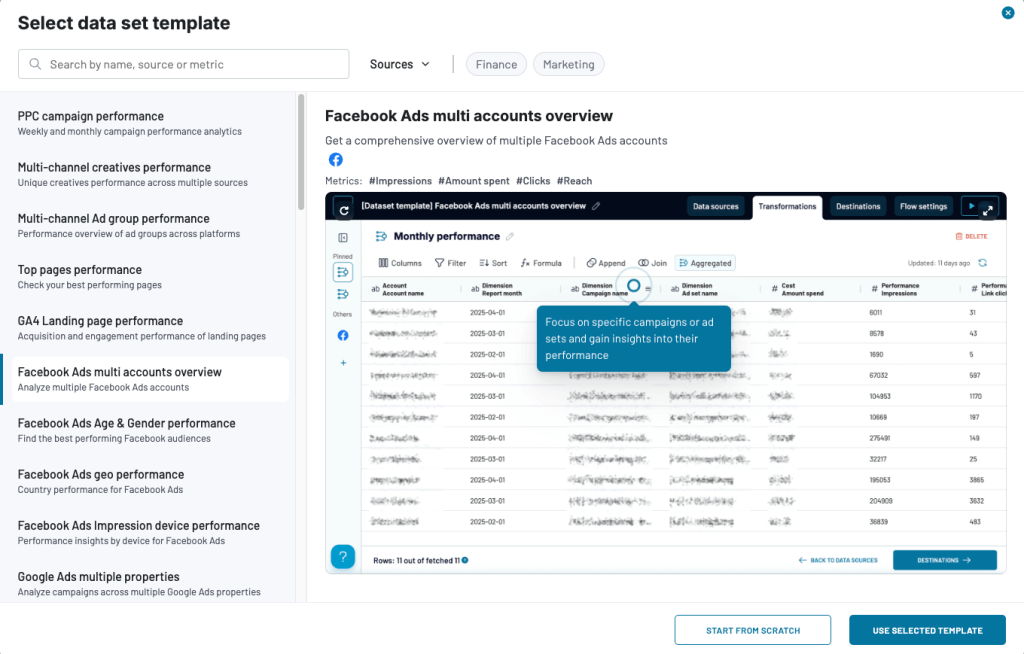
And the data set templates make it even easier and faster to get structured and organized data from your source apps.

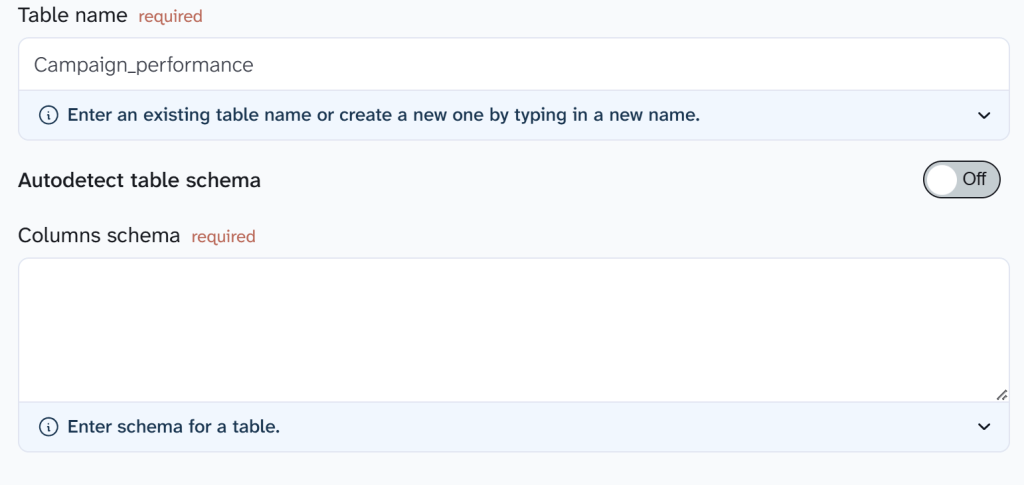
The tables in BigQuery reflect the structure of the source data, normalized and ready for SQL. Schema is autodetected by default, so BigQuery infers column types during import. At the same time, analysts can define it manually for stricter control.

Teams using Coupler.io with BigQuery typically connect 5 to 12 SaaS platforms and go from setup to live dashboards in a single working session, all without engineering support. For example, XRay.Tech, a no-code agency, uses Coupler.io to automatically load operational data into BigQuery for time-tracking analysis. This enables them to save nearly 50 minutes per client on billing.
Try it out yourself right away. Choose your source application in the form below and click Proceed. You’ll be offered to sign up for free with no credit card required and set up your automated data flow.

Coupler.io also works in reverse: BigQuery can serve as a source, with data exported to Google Sheets, Excel, or BI tools through the same platform. This makes it practical for teams that need to both centralize raw data and distribute refined outputs to stakeholders who don’t work in SQL.
Data analysis with BigQuery: cross-channel use cases
Once data is centralized in BigQuery via Coupler.io pipelines, analysts can run cross-platform queries that go well beyond what individual platform dashboards support.
The following examples show data analysis with BigQuery using marketing data from Google Ads, Facebook Ads, GA4, and Search Console. However, the same join and aggregation logic applies to any combination of sources: CRM and billing data, support tickets and product usage, inventory and financial reporting.
Use case 1: Cross-platform advertising performance
Marketing teams often run campaigns across Google Ads and Facebook Ads simultaneously. At the same time, each platform reports performance in its own interface, with different schemas, column names, and metric definitions. Comparing them meaningfully requires getting both datasets into the same structure. You can do this right in Coupler.io.
Blend data in Coupler.io before BigQuery
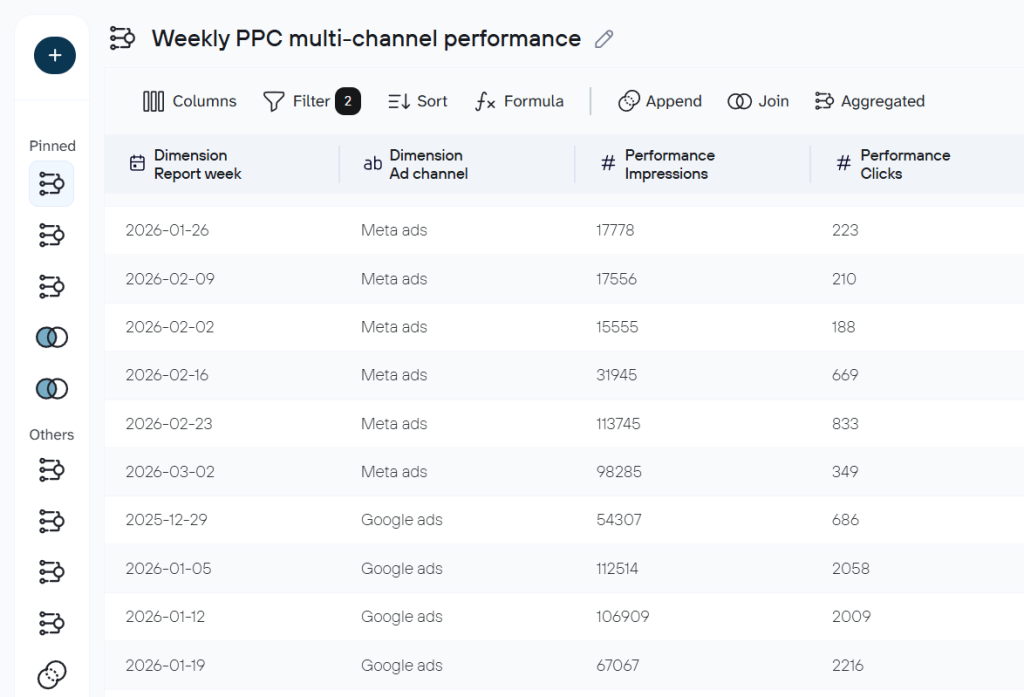
Coupler.io can blend Google Ads and Facebook Ads data into a single unified table during the pipeline stage. The transformation appends both datasets, standardizes field names (report_date, platform, cost, clicks, conversions), and adds a platform dimension to distinguish the source.

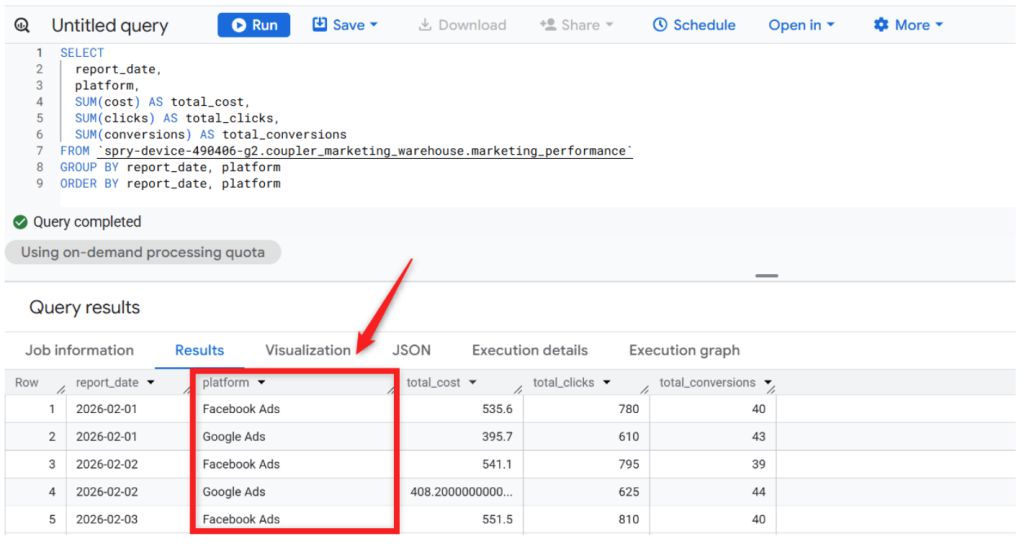
Once that blended dataset is loaded into BigQuery, analysts can compare performance across channels using a simple query:
SELECT
  report_date,
  platform,
  SUM(cost) AS total_cost,
  SUM(clicks) AS total_clicks,
  SUM(conversions) AS total_conversions
FROM `spry-device-490406-g2.coupler_marketing_warehouse.marketing_performance`
GROUP BY report_date, platform
ORDER BY report_date, platform
This query produces a clean day-by-day view of spend, clicks, and conversions by platform.

Blend data in BigQuery
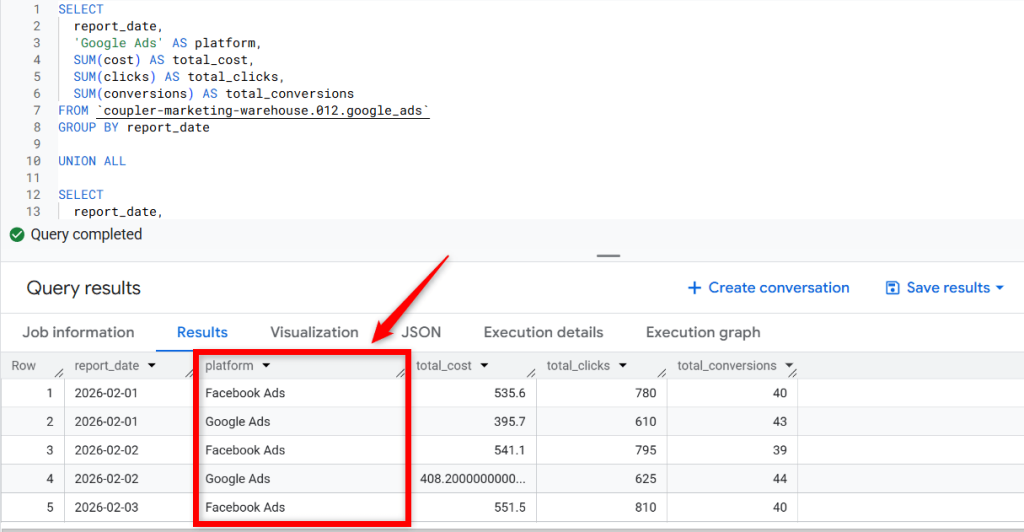
Analysts who prefer to keep the raw data intact and handle joins in SQL can use Coupler.io as a straightforward connector instead. Each source loads into its own BigQuery table, preserving the original schema. This is common when sources are added independently or when analysts want full control over how datasets are combined with their queries like this one:
SELECT
  report_date,
  'Google Ads' AS platform,
  SUM(cost) AS total_cost,
  SUM(clicks) AS total_clicks,
  SUM(conversions) AS total_conversions
FROM `coupler-marketing-warehouse.012.google_ads`
GROUP BY report_date

UNION ALL

SELECT
  report_date,
  'Facebook Ads' AS platform,
  SUM(cost) AS total_cost,
  SUM(clicks) AS total_clicks,
  SUM(conversions) AS total_conversions
FROM `coupler-marketing-warehouse.012.facebook_ads`
GROUP BY report_date
ORDER BY report_date, platform;
This query generates a row-per-day view of cost, clicks, and conversions for each platform.”

- The Coupler.io route simplifies the SQL and keeps the blending logic outside the warehouse
- The BigQuery route gives analysts full control over how datasets are combined and is useful when working with sources that weren’t pre-blended.
Because the data refreshes automatically through Coupler.io, data analysis with BigQuery becomes a daily practice rather than a monthly reporting exercise.
This is exactly the kind of workflow that United Way Northwest Indiana automated. The organization manages data from Facebook Ads, Google Ads, Search Console, and GA4 — the same sources in the query above. Before adopting Coupler.io, manual data consolidation consumed around 80 hours per month across the team. Automation eliminated that workload, saving roughly $20,000 in annual labor. As Marketing Director Joe Justak put it:
Implementing Coupler.io eliminated the manual part of gathering all the required data and enabled effective data driven decision-making for our marketing team.
Use case 2: Paid vs. organic search performance
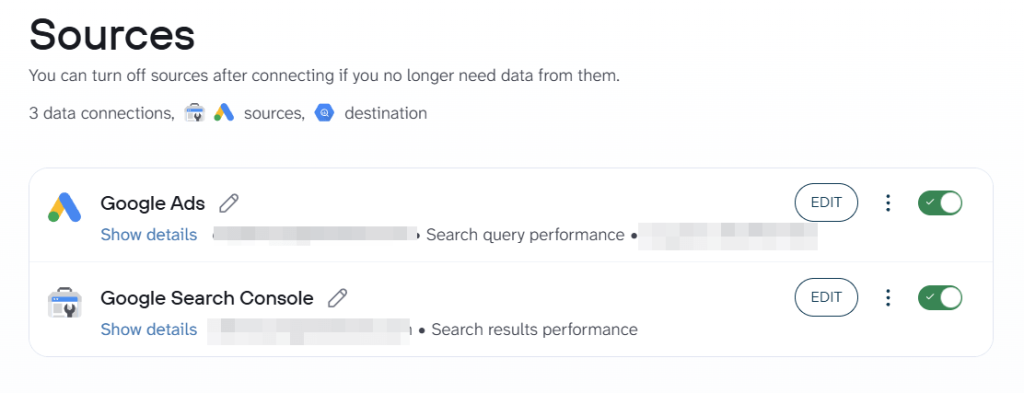
Paid search data lives in Google Ads, while organic search data lives in Search Console. Comparing them at the keyword level reveals where paid and organic efforts overlap, where budget is being wasted, and where SEO gaps exist.
Blend data in Coupler.io before BigQuery
Using the same approach as above, Google Ads keyword data and Search Console data can be joined on a shared field. The result is a single keyword performance table with fields like keyword, paid_clicks, organic_clicks, and paid_conversions already aligned.

Once loaded, the analysis is a simple query:
SELECT
  keyword,
  paid_clicks,
  organic_clicks,
  paid_conversions
FROM `spry-device-490406-g2.coupler_marketing_warehouse.keyword_performance_2`
ORDER BY paid_clicks DESC;
This gives analysts a side-by-side view of paid and organic performance per keyword, without needing to build the join in SQL.
Blend data in BigQuery
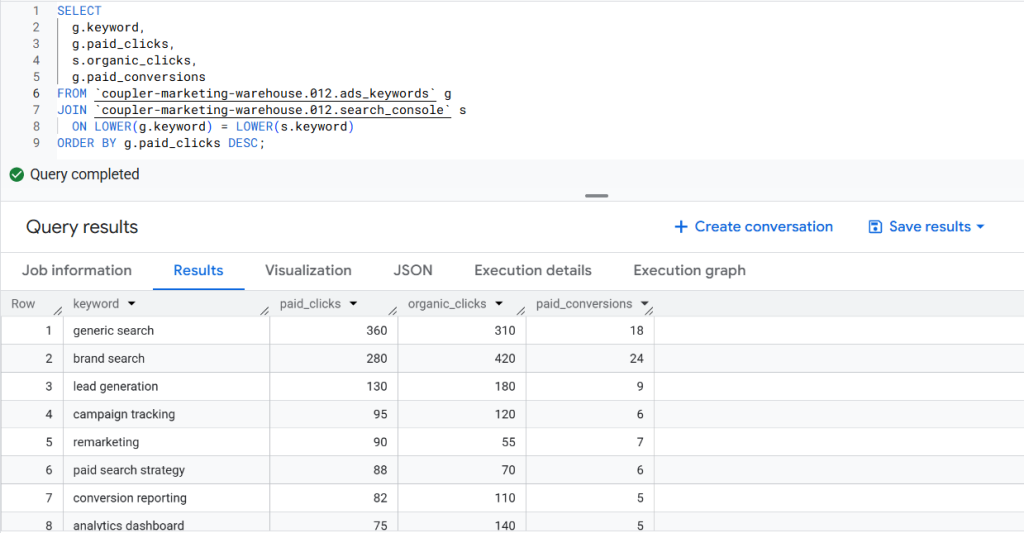
Alternatively, each source can be loaded into its own BigQuery table as-is, with the join handled in SQL:
SELECT
  g.keyword,
  g.paid_clicks,
  s.organic_clicks,
  g.paid_conversions
FROM `coupler-marketing-warehouse.012.ads_keywords` g
JOIN `coupler-marketing-warehouse.012.search_console` s
  ON LOWER(g.keyword) = LOWER(s.keyword)
ORDER BY g.paid_clicks DESC;
The result set shows, for each keyword, how many clicks came from paid ads versus organic search, alongside paid conversion data.

This allows teams to compare paid and organic performance side by side for the same terms. Where a keyword already performs strongly in organic search, paid spend may be reduced. Where paid search drives conversions but organic visibility is weak, that signals an SEO opportunity.
Use Case 3: Campaign performance with website conversions
Advertising metrics like clicks and impressions measure reach, but they do not tell you what happens after someone arrives on the site.
Blend data in Coupler.io before BigQuery
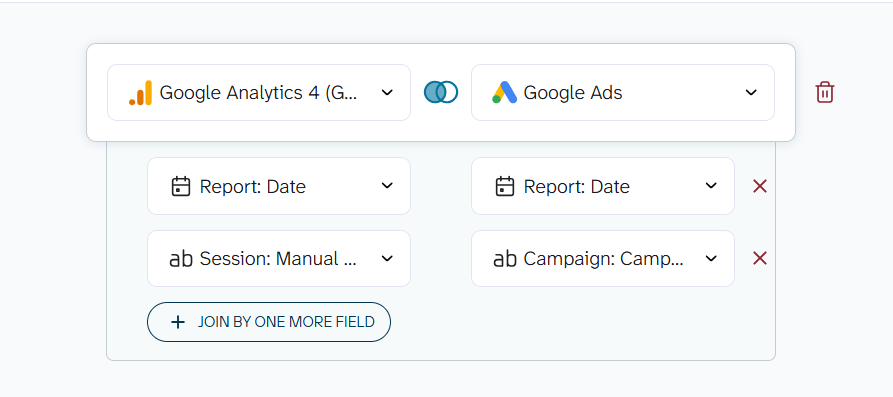
Here, Google Ads campaign data and GA4 performance data are aligned on shared fields like report_date and campaign name. This produces a unified campaign attribution table with cost, sessions, and conversions in one place.

That gives an analysis-ready table in BigQuery and lets you see which campaigns are not just generating traffic, but actually driving qualified visits and conversions. Here is an SQL query to use:
SELECT
 campaign_name,
 SUM(cost) AS total_cost,
 SUM(sessions) AS sessions,
 SUM(conversions) AS conversions,
 SAFE_DIVIDE(SUM(conversions), SUM(sessions)) AS conversion_rate
FROM `your_project_id.marketing_warehouse.campaign_attribution`
GROUP BY campaign_name
ORDER BY conversions DESC;
Blend data in BigQuery
The same analysis works when each source is loaded separately into BigQuery and joined in SQL:
SELECT
  g.campaign_name,
  SUM(g.cost) AS total_cost,
  SUM(s.sessions) AS sessions,
  SUM(s.conversions) AS conversions,
  SAFE_DIVIDE(SUM(s.conversions), SUM(s.sessions)) AS conversion_rate
FROM `coupler-marketing-warehouse.012.google_ads` g
JOIN `coupler-marketing-warehouse.012.ga4` s
  ON g.campaign_name = s.campaign_name
  AND g.report_date = s.report_date
GROUP BY g.campaign_name
ORDER BY conversions DESC;
The conversion_rate column is where this query pays off. A campaign might show a high click volume but a low conversion rate, meaning that traffic quality is poor because the targeting is broad, the landing page is misaligned with the ad, or both.

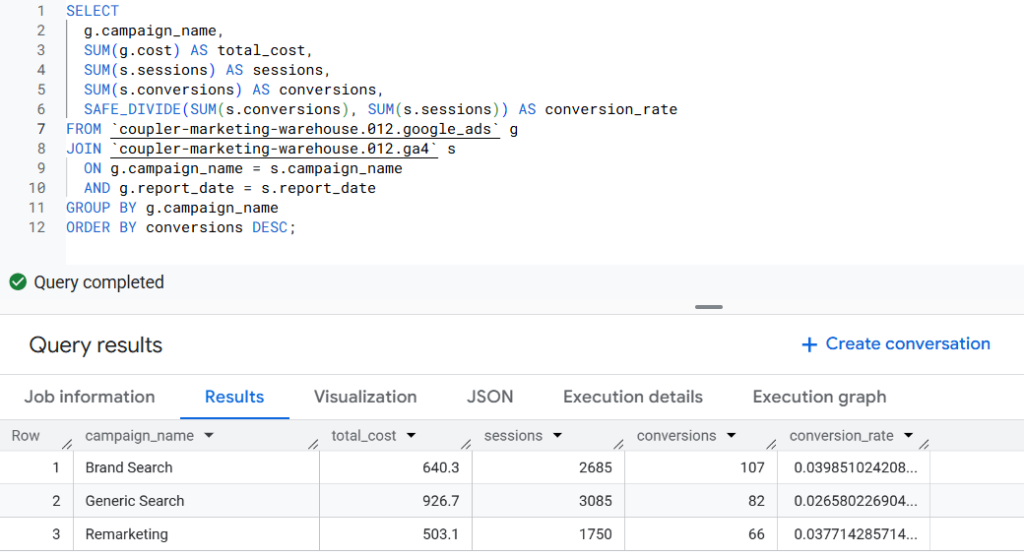
A campaign with modest click volume but a high conversion rate deserves more budget. This query gives analysts the evidence to back up their arguments, based on actual user behavior rather than just ad platform totals.
Why you should use Coupler.io with BigQuery for data analytics
BigQuery gives analysts a scalable, SQL-native environment for cross-channel analysis. Because the architecture is serverless, there’s no infrastructure to manage. Automating your pipeline through Coupler.io makes BigQuery practical for ongoing analytics. It removes the need for manual exports or custom scripts.
Reports update automatically as new data flows in, queries can combine datasets without manual preparation. And, of course, dashboards in Looker Studio or Power BI stay up-to-date without intervention.
Connect your data to BigQuery with Coupler.io
Get started for freeFor agency teams managing multiple clients or companies operating across regions, this matters at scale. Running the same analytical framework across dozens of client accounts becomes feasible once the data collection layer is automated.
Fable Food Co. is a good example of how this scales beyond marketing. As the company expanded across Australia, the UK, and the US, its data became distributed across Fishbowl Inventory, MySQL databases, and regional Xero entities. Coupler.io automated flows from all of these sources into BigQuery, which powered live Power BI dashboards.
The impact: close-to-expired inventory cut in half, budget variance lowered to 6–8%, and over $60,000 per year saved by eliminating one full-time analyst’s workload.
As COO and CFO Christopher McCallum described:
With Coupler.io, we’ve harnessed the power of real-time reporting, optimizing our distribution and making proactive decision-making a reality.
In every case covered above, data analysis with BigQuery was straightforward. The barrier was data collection, not analysis. Removing that barrier through automated pipelines into BigQuery is what made the analysis practical.
Once data is in BigQuery, teams typically connect
- BI tools, such as Looker Studio and Power BI for dashboards and data visualization
- Google Sheets for lightweight sharing
- AI tools like ChatGPT and Claude for exploratory analysis
That flexibility is what makes BigQuery for data analysts a practical choice, not just a technical one.