Tired of juggling spreadsheets, exports, and half-working dashboards just to see how your business is doing? Data blending tools can fix that.
They pull information from your CRM, Google Ads, analytics platforms, and dozens of other apps into one clean, unified view, automatically. No more copy-pasting, no SQL, no late-night reporting chaos.
In this guide, you’ll discover the best tools for blending data from multiple sources and learn how to choose the right one for your marketing, finance, or operations team.
Top data blending tools in 2026 – Brief comparison in a table
Today’s best data blending tools make it easier than ever to streamline workflows, automate refreshes, and analyze large datasets from multiple sources without writing code. Below are seven platforms worth exploring.
| Category | Coupler.io | Alteryx | Integrate.io | Qlik (with Talend) | Tableau | Microsoft Power BI |
| Type of tool | No-code data integration and AI analytics platform | Advanced analytics & data workflow platform | Low-code cloud ETL & data blending | Enterprise BI & integration suite | Data visualization tool | Business intelligence & visualization tool |
| Best for | Marketers, finance teams, and small businesses needing easy automation | Data analysts and scientists building complex workflows | SaaS-based teams blending cloud data | Large organizations managing enterprise-scale data | Analysts blending data visually in dashboards | Microsoft users working in Excel, Azure, or SQL Server |
| Ease of use | ★★★★★ No-code | ★★☆☆☆ Technical setup required | ★★★★☆ Low-code | ★★☆☆☆ Enterprise setup | ★★★★☆ Visual interface | ★★★★☆ Familiar Microsoft UX |
| Starting price (per month) | $24/month for 3 accounts | $250/user | $1,999/month – unlimited users | Custom quote | $75/user | $14/user |
| Data connectors | 390+ | 100+ | 100+ | 200+ | 100+ | 100+ |
| AI capabilities | AI integrations (ChatGPT, Claude, or other LLMs) AI insights AI agent | Predictive analytics and ML models | AI-powered data transformation | AI-assisted insights and data governance | Tableau AI: Delivers personalized, contextual insights Generates summaries directly within users’ workflows | Microsoft Copilot for AI-driven analysis |
Data blending software in detail
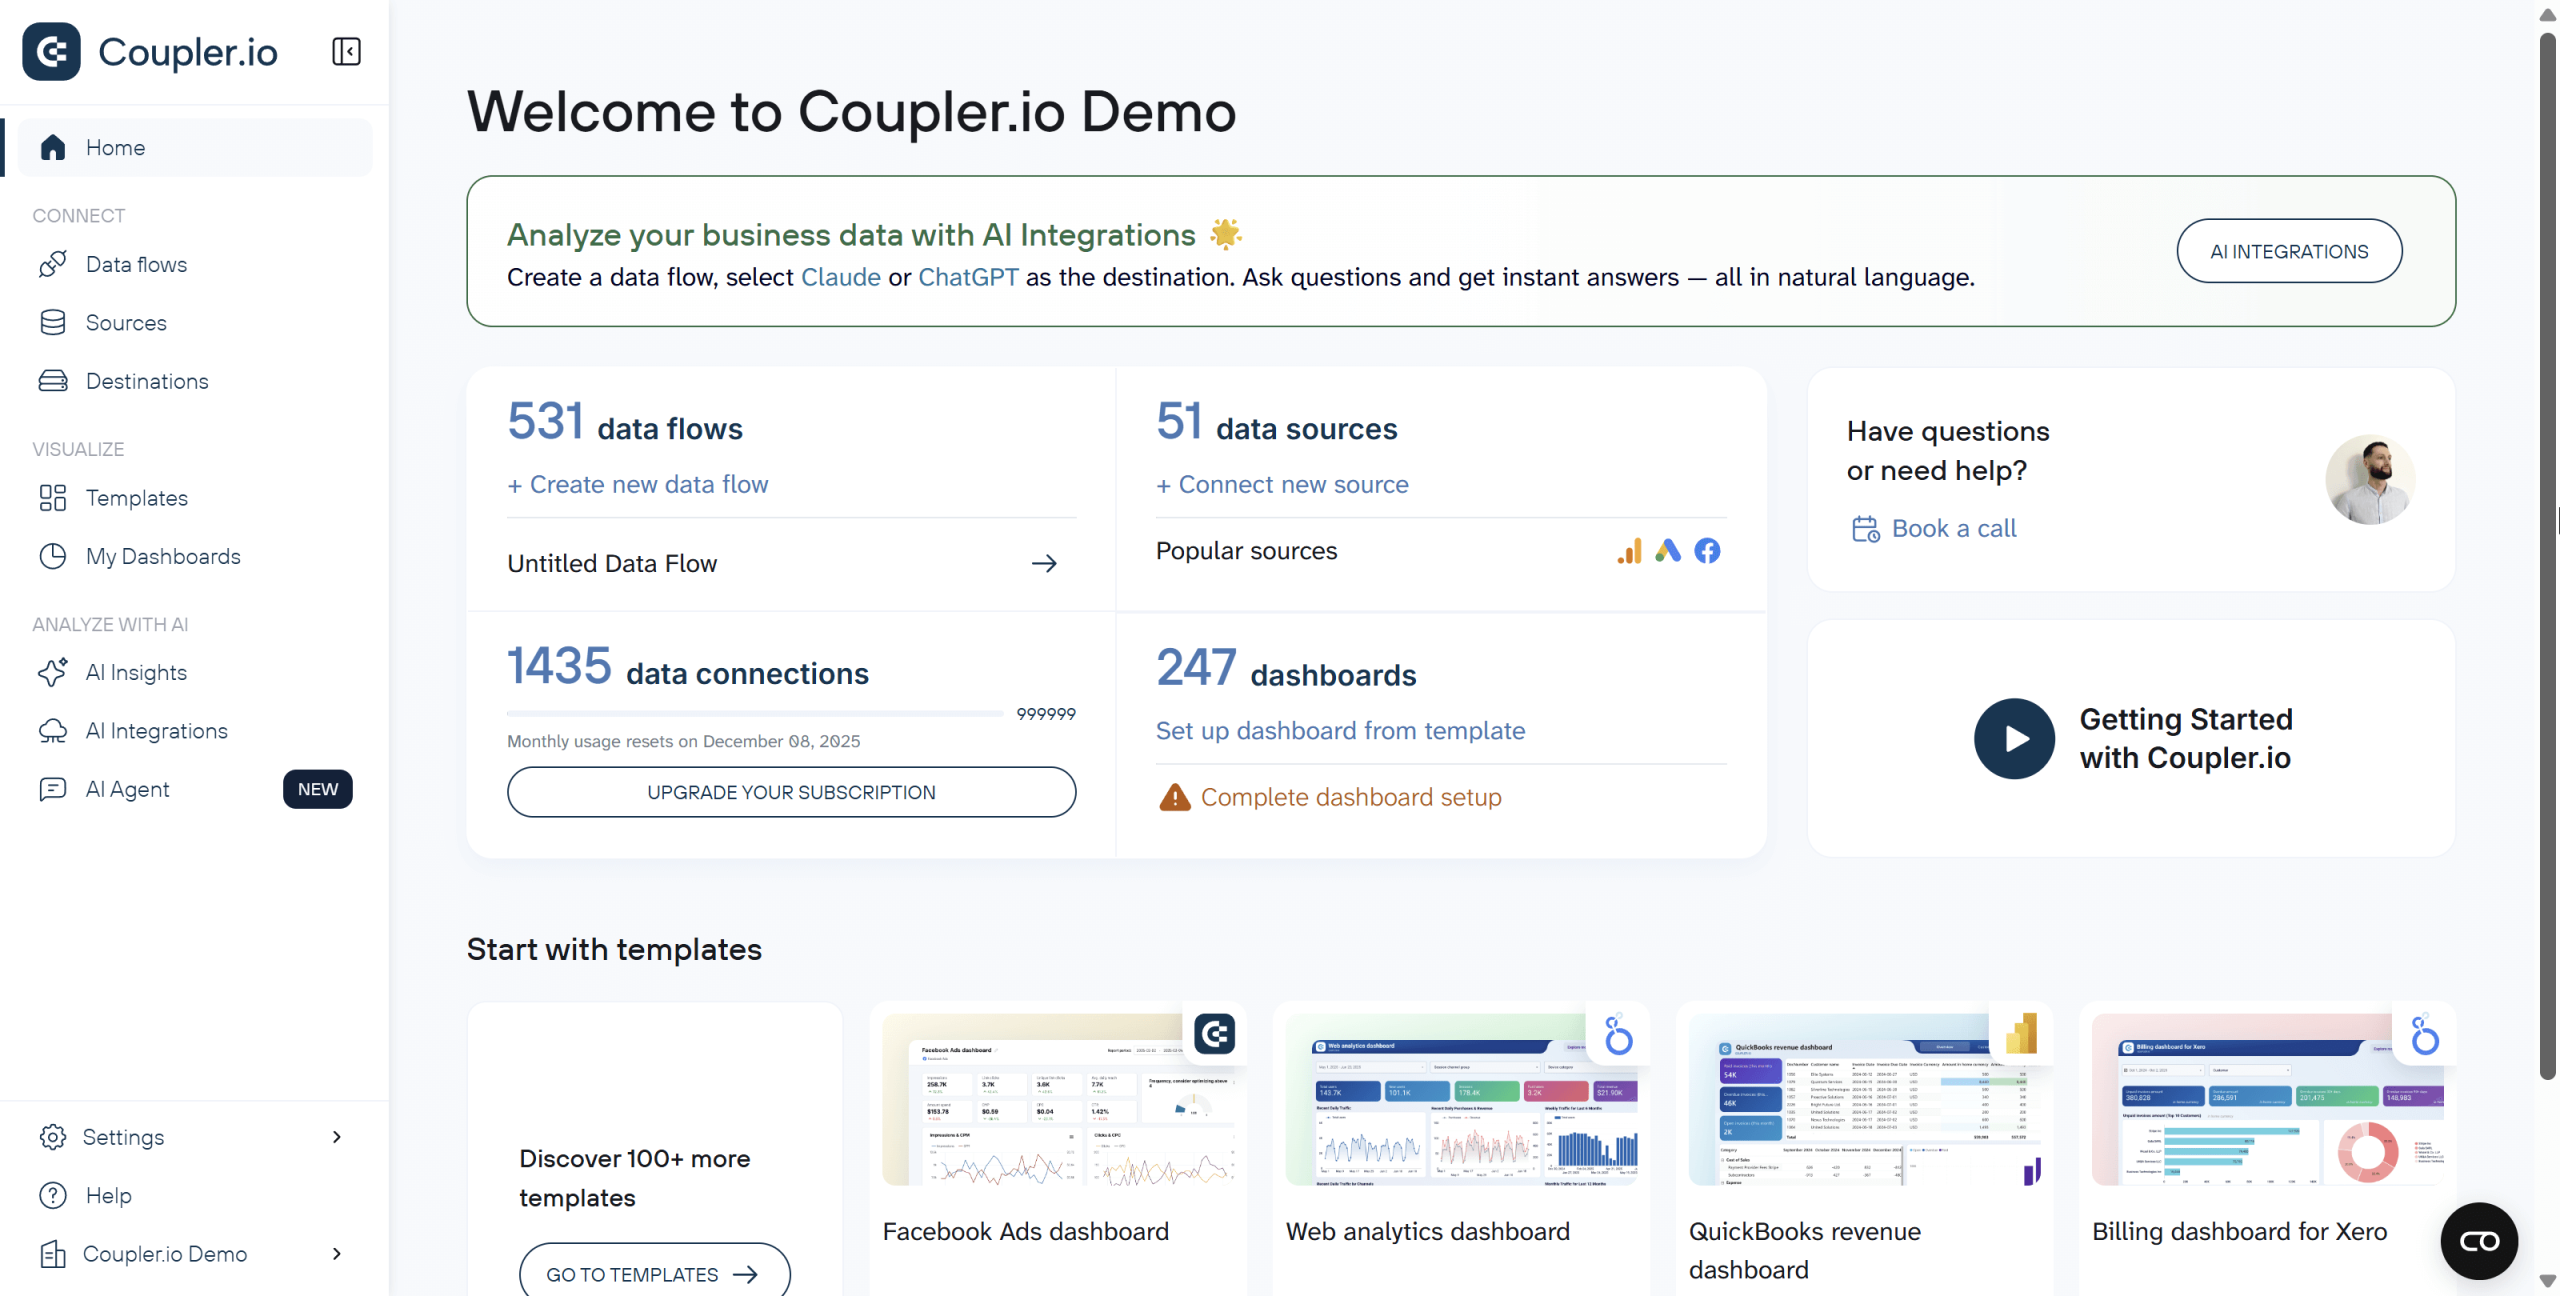
1. Coupler.io: Best for hassle-free business data blending and reporting automation
Coupler.io is a no-code data integration and AI analytics platform built for teams that want to centralize data without hiring engineers. It’s ideal for marketers, finance professionals, and operations managers who need up-to-date data from multiple SaaS and business apps in one place.
Explore all connectors and data blending features for free

Explore all connectors and data blending features for free
Try Coupler.ioSupported apps and data sources:
Coupler.io supports over 390 connectors, covering:
- CRMs: HubSpot, Pipedrive, Salesforce
- Marketing tools: Google Ads, Meta Ads, Mailchimp
- Analytics: Google Analytics, Mixpanel
- Finance apps: QuickBooks, Stripe, Xero
- Cloud storage and databases: Google Sheets, BigQuery, and Airtable
- And more
You can definitely consider it as one of the best tools for blending SEO and sales data, marketing and ecommerce, and so on.
Mode of data blending:
Coupler.io works as an ETL platform. It extracts data through APIs, transforms it, and then loads it into your preferred destination. During the transform stage, users can choose how to blend their data:
- Join datasets by matching shared fields like campaign IDs or dates.
- Append data to combine similar tables into one.
Also, you can automate these workflows to refresh on a custom schedule (up to every 15 minutes).
Ease of use:
Coupler.io is designed to be accessible for users of all skill levels, offering a no-code experience for most tasks while still providing advanced options like webhooks for technical users. You can create data flows with no SQL or scripting required. Calculated fields, filters, and transformations are available directly in the setup flow. This makes it easy for people who are used to working in spreadsheets to start automating their data workflows.
Key features:
- Data set and dashboard templates
- 10+ data destinations
- Automatic data refresh on a custom schedule (from every month to every 15 minutes)
- Manage all your data automations, including connections, schedules, and transformations, from a single dashboard.
- In-tool data transformations (filtering, calculated fields)
- Integration with AI platforms (ChatGPT, Claude) for conversational analytics
Pricing:
Coupler.io starts at $24/month for individuals with light usage. The Starter plan is limited to one user and 3 accounts from all the available data sources.
For a company blending 5–10 data sources (marketing, CRM, and financial data) that refreshes them several times a day, the monthly cost typically ranges from $99 to $199.
Depending on your needs, you can choose from:
• Active plan ($99/month) for 3 data destinations and daily data refresh.
• Pro plan ($199/month) for unlimited destinations and hourly data refresh.
If you’re looking for a custom solution, the Business plan is your option, offering a dedicated account manager, enterprise SLA, and 15-minute data refresh for your data flows.
Coupler.io is one of the most budget-friendly cloud data blending solutions on the market, considering the features and ease of use.
Limitations:
- Not designed for complex data transformations requiring custom Python/R scripts (use Alteryx or dbt instead)
- Refresh intervals limited to 15 minutes minimum (not suitable for sub-second real-time requirements)
Blend data from over 390 sources with one tool
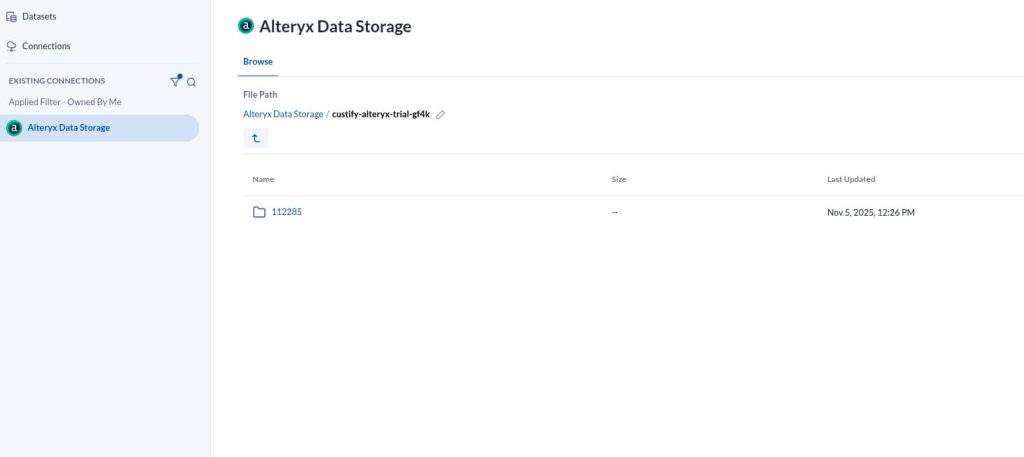
Try Coupler.io for free2. Alteryx: Best for advanced data workflows and analytics
Alteryx is a powerful analytics and automation platform built for teams that want to prepare, blend, and analyze data without relying on engineers or coding skills. It’s ideal for organizations that need to unify data across departments, while maintaining enterprise-grade security, governance, and flexibility.

Key features:
- End-to-end data preparation, blending, and reporting
- Automated and API-triggered workflow scheduling
- Cloud and desktop flexibility
- Enterprise-level governance and data security
Supported apps and data sources:
Alteryx connects to over 100 data sources and platforms, including:
- Cloud and warehouse systems: Snowflake, Databricks, Google BigQuery, AWS, and Azure
- Enterprise systems: SAP, Salesforce, and Oracle
- File-based sources: CSV, XLSX, and JSON
- BI tools: Tableau, Power BI, and Qlik
Mode of data blending:
Alteryx supports multiple methods of data blending, including joins, appends, fuzzy matching, and in-database blending. Users can join datasets based on shared fields, append similar tables to combine records, apply fuzzy matching to merge slightly different entries (like misspelled names), and perform in-database blending to process large datasets directly within their databases without exporting the data.
Ease of use:
With its drag-and-drop workflow builder, Alteryx empowers both analysts and non-technical professionals to prepare and analyze data without SQL or scripting. Cloud and desktop deployment options make it easy to adapt to any data infrastructure.
Pricing:
Alteryx starts at $250 per user/month for small teams that need essential, code-free data preparation and blending. For a company blending 5–10 data sources, this is a good option, but there are more budget-friendly tools on the market.
For larger organizations, Professional and Enterprise plans add cloud and desktop interoperability, AI-assisted analytics, and API-based workflow automation. These tiers are available via custom pricing upon request.
Limitations:
- Steep learning curve (2-3 weeks minimum for proficiency)
- Expensive for small teams or startups with limited budgets
- Overkill for simple data blending tasks that don’t require advanced analytics
- Requires dedicated analyst resources to maintain and optimize workflows
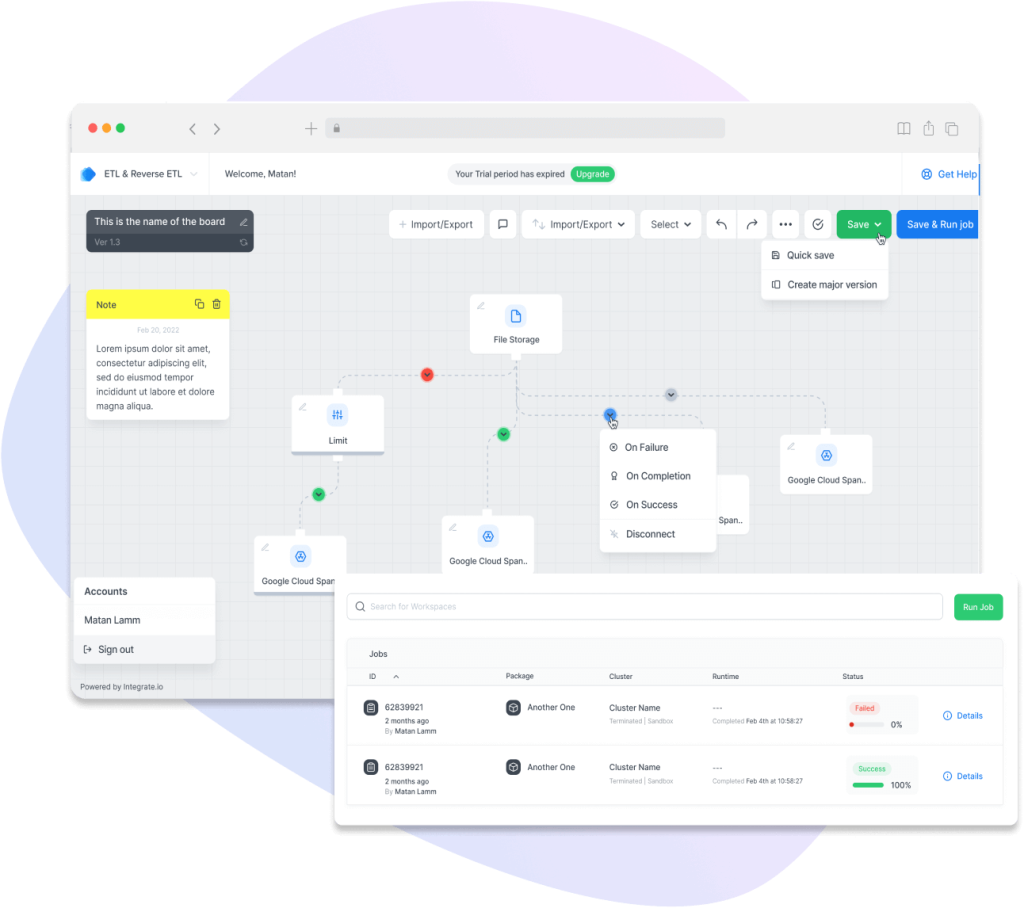
3. Integrate.io: Best for blending SaaS and cloud data
Integrate.io is a cloud-based ETL and data pipeline platform built for teams that want to blend, transform, and move data from multiple sources without writing code. It’s ideal for organizations that need to centralize data from diverse systems into a single, analysis-ready destination while maintaining flexibility and scalability.

Key features:
- Visual ETL and ELT pipeline builder
- Real-time workflow monitoring and alerts
- Automated scheduling and API integrations
- Secure cloud deployment with role-based permissions
Supported apps and data sources:
Integrate.io connects to a wide range of structured and unstructured data sources, including:
- Cloud databases: Amazon Redshift, Snowflake, BigQuery, PostgreSQL, and MySQL
- Enterprise systems: Salesforce, HubSpot, and NetSuite
- File-based sources: CSV, XML, JSON, and cloud storage services like AWS S3 or Google Cloud Storage
- BI and analytics tools: Power BI, Looker, and Tableau
Mode of data blending:
Integrate.io supports several key data blending methods within its visual ETL interface, including joins, aggregations, and data cleansing.
- Joins let users merge datasets using shared fields such as customer IDs or dates to create a unified view of their data.
- Aggregations help summarize information (for example, calculating total sales per region or average order value).
- Data cleansing ensures accuracy by removing duplicates, correcting formatting issues, and standardizing values across sources.
Ease of use:
It offers a no-code/low-code interface that allows analysts and business users to build workflows quickly, while technical users can enhance transformations with custom scripts. The platform’s intuitive design makes managing data pipelines straightforward for teams of all skill levels.
Pricing:
Plans for small teams typically start around $1,999/mo, with enterprise pricing available for larger or more complex workloads. For a company blending 5–10 data sources, Integrate might not be the best option. While its Core plan offers unlimited data volumes and pipelines, the steep pricing of $1,999/month can be over the budget.
Limitations:
- Less extensive connector library (140+) compared to specialized tools like Coupler.io (370+)
- Steeper learning curve than pure no-code platforms despite low-code interface
- Primarily focused on cloud data warehouses; less optimized for simple SaaS-to-spreadsheet workflows
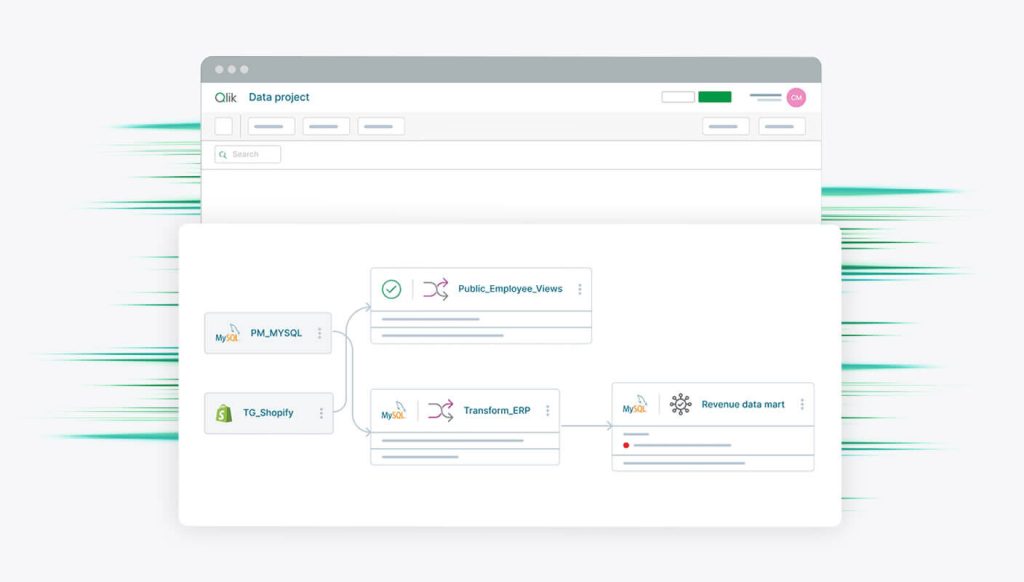
4. Qlik Talend: Best BI tool with associative blending
Qlik Talend is a unified platform for data integration, transformation, and governance, bringing together Qlik’s analytics expertise and Talend’s proven ETL and data quality capabilities. It’s built for enterprises that need to deliver trusted, AI-ready data across cloud, on-premises, or hybrid environments.

Key features:
- End-to-end data integration, transformation, and governance
- Real-time data quality monitoring and automated lineage tracking
- AI-assisted, no-code pipeline creation
- High-performance lakehouse architecture for unified analytics
- Scalable deployment in cloud, on-prem, or hybrid setups
Supported apps and data sources:
Qlik Talend connects to hundreds of systems, including:
- Cloud and databases: Snowflake, Databricks, Google BigQuery, AWS, Azure, Redshift, and Oracle
- Enterprise systems: SAP, Salesforce, Adobe, and Microsoft SharePoint
- File-based and API sources: CSV, XML, JSON, REST, and streaming data
- BI and analytics tools: Qlik Cloud Analytics, Power BI, and Tableau
Mode of data blending:
Qlik Talend works as a data integration and transformation platform. It can move data through ETL, ELT, batch, real-time, or API-based pipelines, depending on how frequently users need updates. Users can blend their data in several ways:
- Join datasets using shared fields like customer IDs or dates to create a unified view.
- Aggregate data to generate summaries or key metrics.
- Clean and standardize values to ensure consistency across sources.
Ease of use:
The platform offers AI-augmented flexible deployment options in the cloud or on-premises. Data engineers can design, automate, and monitor data flows through an intuitive web interface backed by robust security and role-based access.
Pricing:
Qlik Talend offers custom enterprise pricing based on data volume, connectors, and deployment model. Pricing typically aligns with mid- to large-scale data teams that require governed, multi-environment integration and analytics capabilities.
Limitations:
- Enterprise-only pricing makes it inaccessible for small and mid-sized businesses
- Complex setup requiring dedicated data engineering team (4-8 weeks minimum)
- Steeper learning curve compared to self-service platforms
- Implementation often requires consulting partners, adding to the total cost
5. Tableau: Best for visualization-driven data blending
Tableau is a leading data visualization and analytics platform that enables users to explore, analyze, and present data through interactive dashboards. It’s best suited for organizations that want to visualize multi-source data quickly and share insights across teams, while maintaining flexibility for analysts and business users.

Key features:
- Highly interactive data visualization and dashboarding
- Real-time and extract-based connections
- Integration with Python, R, and Tableau AI for advanced analytics
- Cloud and on-premises deployment flexibility
- Collaboration and governance through Tableau Server or Tableau Cloud
Supported apps and data sources:
- Databases and warehouses: Snowflake, Google BigQuery, Amazon Redshift, and PostgreSQL
- Cloud services: Salesforce, Google Analytics, AWS, and Azure
- Files and spreadsheets: Excel, CSV, JSON, and Google Sheets
Mode of data blending:
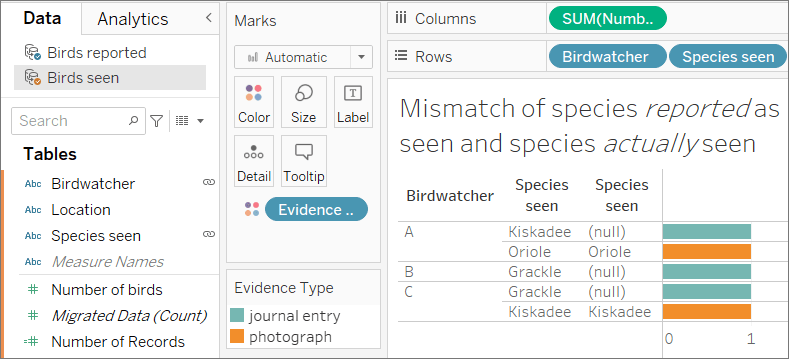
Tableau blends data by combining summarized results from different data sources in one view. Instead of merging all rows like a traditional join, Tableau keeps each dataset separate and links them only at the summary (aggregate) level.
This makes it ideal when your datasets have different levels of detail (for example, daily sales transactions in one source and monthly targets in another). Tableau uses a left join–style blending, where one data source is set as the primary and the others are connected through shared fields, such as date or product ID, to align their metrics.
Ease of use:
With its drag-and-drop interface, Tableau makes visual analytics approachable for non-technical users. However, blending across complex or large data sets can require careful setup to maintain performance and consistency. Tableau Prep provides additional low-code tools for data cleansing and transformation prior to analysis.
Limitations of data blending:
While Tableau’s blending offers flexibility for combining multiple data sources, it has several constraints:
- Only supports left joins, limiting certain analytical combinations.
- Non-additive aggregates (MEDIAN, COUNTD) may cause blending errors.
- Level of Detail (LOD) expressions can break when used with secondary data sources.
- Live multi-connection sources may not support temporary tables, reducing performance.
- Complex blends can slow query performance and lead to timeouts in high-granularity analyses.
Pricing:
Tableau pricing starts at $75 per user/month for Creator, $42 for Explorer, and $15 for Viewer (billed annually).
For a small analytics team of five users blending 5–10 data sources, the total cost is about $300/month. This makes Tableau affordable for teams focused on visualization, though it’s less suited for complex, large-scale data blending or ETL workloads.
6. Microsoft Power BI: Best for Microsoft ecosystem users
Power BI is Microsoft’s business intelligence and visualization platform designed to turn raw data into interactive dashboards and reports. It’s ideal for organizations that want to centralize reporting, automate insights, and make data-driven decisions without a heavy technical setup.

Key features:
- Real-time dashboards and KPI tracking
- Integration with Microsoft 365, Azure Synapse, and Fabric
- Row-level security and governance
- AI-powered insights and Copilot for Power BI
Supported apps and data sources:
Power BI connects to hundreds of data sources, including:
- Databases: SQL Server, Snowflake, BigQuery, Redshift, Databricks
- Cloud platforms: Azure, AWS, Google Cloud, SharePoint
- Business systems: Dynamics 365, Salesforce, HubSpot
- Files and APIs: Excel, CSV, JSON, XML, REST APIs
Mode of data blending:
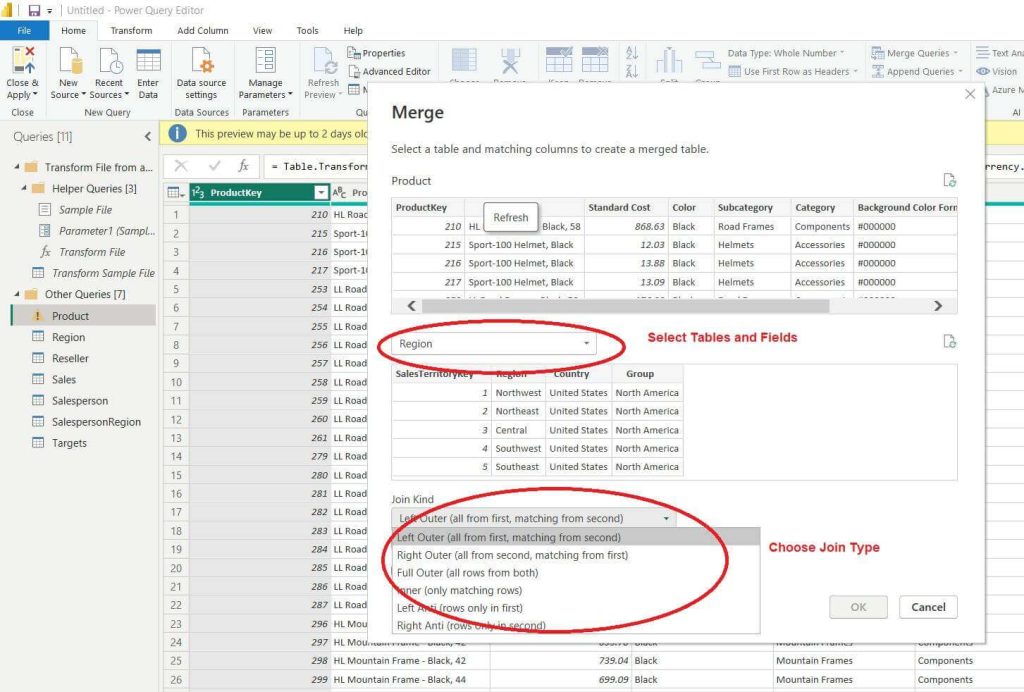
Power BI includes data-blending capabilities through relationships, joins, appends, and DAX formulas. Users can link tables on shared fields, merge datasets, or perform cross-table calculations, but these features exist primarily within the data modeling process for reporting, not as a standalone data-blending or ETL engine.
In other words, Power BI excels at combining prepared data for analysis, but it’s not designed to handle complex data transformation or large-scale blending across disconnected systems like dedicated ETL tools.
Ease of use:
The familiar, Excel-like interface makes Power BI accessible for business users, while Power Query and DAX provide advanced options for analysts who need custom calculations or automation.
Limitations of data blending:
While Power BI provides several ways to combine data, it has some constraints:
- Data blending happens within the data model, not as a separate ETL layer.
- Complex joins or merges across large datasets can slow performance.
- DAX-based blending requires technical knowledge and can be hard to debug.
- Cross-source relationships may break when data schemas or refresh schedules differ.
- Power BI is less suited for large-scale, automated blending across many SaaS or API sources compared to dedicated ETL tools.
Pricing:
Power BI starts at $10 per user/month for Pro and $20 per user/month for Premium (Per User), billed annually.
For a small team of 5–10 users blending 5–10 data sources, total costs range from $50 to $100/month
While it’s one of the most cost-effective solutions, for teams primarily focused on data blending and transformation, Power BI may not be as specialized or automated as other tools mentioned in the top.
How to choose a data blending tool
Choosing the right data blending platform depends on your team’s technical skills, the complexity of your data, and how you plan to use it. The goal isn’t to find the most advanced tool on the market, but the one that fits your workflow and helps you make faster, more informed decisions.
Below are the five key factors to consider and what they mean for you in practice.
1. Ease of integration
Before committing to any platform, check how easily it connects to the systems you already use.
If most of your data comes from cloud-based tools like HubSpot, Google Analytics, Google Ads, or QuickBooks, a platform with prebuilt connectors will save you hours of setup and maintenance.
- Coupler.io is ideal for this scenario. It offers over 390 plug-and-play connectors that require no API configuration, making it perfect for marketing, finance, or operations teams without dedicated engineers.
- Alteryx or Talend can connect to almost any enterprise system, but they often require technical setup and administrative access.
For small and mid-sized businesses, ease of integration often matters more than unlimited flexibility. The faster you can connect your tools, the faster you can start analyzing results.
2. Automation and scheduling
If you regularly update reports or dashboards, automation is non-negotiable. A good data blending tool should refresh data on a schedule, so you’re not stuck exporting files manually.
- Coupler.io allows you to schedule automatic refreshes as often as every 15 minutes, which is useful for marketing teams tracking campaign performance throughout the day.
- Power BI offers scheduled refreshes, but only up to eight times per day on the standard Pro plan.
- Tableau supports automated extracts for live sources, but often requires a Creator license or server setup.
If your goal is to maintain up-to-date dashboards or daily KPIs, prioritize tools that offer flexible scheduling. Manual exports can quickly become a bottleneck as your reporting frequency increases.
3. Scalability and performance
Your ideal platform should grow with your business. If you’re currently blending small datasets (for example, website traffic and CRM leads), a lightweight cloud tool will work fine. But if you expect to handle millions of rows or complex data models, scalability becomes critical.
- Alteryx and Qlik (with Talend) are built for large-scale data processing and can handle enterprise-grade datasets.
- Integrate.io provides a good middle ground. It’s cloud-based and capable of managing moderate to large data volumes without requiring an in-house data warehouse.
- For small businesses, Coupler.io scales automatically based on usage, so you can start small and expand as your data needs grow.
Think about where your company will be in 12 months. Choosing a tool that can scale early can prevent costly migrations later.
4. Usability and learning curve
Even the most powerful tool won’t deliver results if your team can’t use it effectively. Evaluate who will manage your data blending (analysts, marketers, finance professionals, or engineers) and choose a platform that matches their skill set.
- Coupler.io is fully no-code and designed for business users. Anyone can create automated pipelines.
- Integrate.io is slightly more technical but still accessible to non-developers through its visual pipeline builder.
- Alteryx and Talend are better suited for technical teams familiar with data workflows, scripting, or SQL.
- Tableau and Power BI are easier to learn if your team already builds reports or dashboards regularly.
If you want quick wins without hiring data specialists, prioritize usability over advanced functionality. You can always move to a more complex platform later as your team’s skills mature.
5. Pricing and value
Pricing structures vary widely, so it’s important to think about the total cost of ownership, not just the sticker price. Most tools charge based on the number of data sources, refresh frequency, and users.
- A marketing team using Coupler.io to blend data from Google Ads, HubSpot, and Stripe can expect to pay around $99–$199 per month, depending on how many accounts you want to connect and how often the data is refreshed.
- A mid-sized business using Integrate.io to manage 5–10 cloud data pipelines will likely spend $2,000–$3,000 per month.
- Enterprise teams using Alteryx or Qlik (with Talend) for large-scale workflows typically start around $3,000 per month or more, depending on deployment.
If you’re a small or mid-sized company, look for transparent pricing and scalability. Tools like Coupler.io let you start small and upgrade gradually, while enterprise systems often require long-term contracts or higher upfront costs.
Making your choice
- If your team is non-technical and you want a quick setup, Coupler.io is one of the best self-service options. It’s intuitive, affordable, and integrates easily with common marketing, finance, and analytics apps.
- If your company is data-mature and needs advanced workflows or governance, Alteryx or Qlik (with Talend) will deliver the control and scalability you need.
- If you’re already invested in Microsoft or Salesforce ecosystems, Power BI and Tableau let you blend data directly within your dashboards and reporting environment.
The right tool is the one that fits how your team works today and can grow with how you’ll work tomorrow.
Automate data integation from 390+ business apps
Try Coupler.io for freeWhen should you use data blending to combine data?
You should use data blending when your team needs fast, flexible insights from different data sources without the complexity or delay of a full ETL process. It’s ideal for ad hoc analysis, cross-platform reporting, and real-time decision-making when business users can’t afford to wait for engineering support or long data integration cycles.
Unlike traditional ETL pipelines that move data into a centralized data warehouse, blending combines data dynamically, often within the analytics or dashboard layer. This makes it a go-to solution for small businesses, marketers, and finance teams that want a unified view of their metrics today, not next week.
Here’s when data blending delivers the most value and which tools to consider:
Marketing performance tracking
Blend SEO metrics from Google Search Console, ad spend from Google Ads, and deal data from your CRM to measure campaign ROI and lead quality.
→ Best tools: Coupler.io (no-code blending across ad and analytics apps) or Qlik (for associative analytics and visualization).
Sales and revenue analytics
Combine CRM data from HubSpot or Salesforce with Excel spreadsheets or data warehouse records to understand revenue attribution, deal velocity, and regional performance.
→ Best tools: Coupler.io (automated pipelines into Google Sheets or BigQuery) or Alteryx (for advanced data preparation and aggregation).
Finance and operations reporting
Merge ERP exports, spreadsheets, and warehouse data to track expenses, forecast cash flow, and monitor supply chain performance without waiting for manual consolidation.
→ Best tools: Coupler.io (automated refreshes for near real-time finance dashboards) or Power BI (tight integration with the Microsoft ecosystem).
Product analytics
Bring together app usage data, customer feedback, and support tickets to identify feature adoption trends and prioritize development efforts.
→ Best tools: Coupler.io (connects directly to product and support apps) or Tableau (for interactive visualization and data exploration).
Customer experience optimization
Combine NPS results, chat logs, and CRM data to identify high-value customers and common pain points, helping you improve satisfaction and retention.
→ Best tools: Coupler.io (streamlines customer and support data blending) or Alteryx (for complex segmentation and pattern discovery).
Data blending is also valuable for exploratory data analysis when you want to test new hypotheses or validate assumptions before building a formal data model. Instead of relying on IT or waiting for an ETL job to complete, analysts and marketers can merge data directly, experiment with filters and calculations, and visualize the results in dashboards or spreadsheets.
If your team values speed, flexibility, and automation, a no-code data blending tool like Coupler.io will help you achieve results fast.
If your organization needs deeper data governance and enterprise-scale control, consider Alteryx or Qlik depending on your existing analytics environment.
FAQ
What is data blending software?
Data blending software helps you combine data from different sources, like your CRM, Google Analytics, spreadsheets, and databases, into a single, analysis-ready dataset. Unlike ETL or full-scale data integration that focuses on long-term storage in a data warehouse, data blending is more ad hoc and self-service. It’s designed for quick insights and flexible data analysis without heavy engineering support.
Here’s an example: imagine you’re running a campaign across several digital channels. Your Google Ads account holds ad spend data, Google Analytics tracks sessions and goal completions, and your CRM captures deals and revenue. With a tool for blending data from multiple sources, you can bring these datasets together, align them by campaign ID or date, and instantly calculate ROI and customer lifetime value.
What are the main benefits of using data blending tools?
Data blending tools streamline workflows by removing manual steps like exports or VLOOKUPs in Excel. They allow teams to merge datasets from various sources, automate updates, and create unified dashboards for faster decision-making. This automation helps optimize your data pipeline and makes real-time, data-driven insights possible.
Modern self-service data blending analytics tools also empower non-technical users to combine and analyze information without coding, helping marketing, finance, and operations teams make informed decisions quickly.
How do data blending tools differ from data integration or ETL tools?
While the terms are sometimes used interchangeably, data blending and data integration serve different purposes.
- Data blending focuses on ad-hoc analysis and is typically performed closer to the analytics layer. It’s ideal for exploring relationships across datasets and answering specific questions, such as “Which campaigns generated the highest ROI?”
- Data integration and ETL (Extract, Transform, Load) are system-level processes. They standardize and move data into a data warehouse for long-term storage and ongoing analytics.
In short, blending is fast and flexible; integration is structured and permanent. Many companies use both: blending for speed, ETL for scale.
Do I need data blending if I already use Google Sheets?
If you’re manually copying data into Google Sheets from multiple sources, then yes—data blending tools can save you significant time. Tools like Coupler.io can automatically pull data from your CRM, advertising platforms, and analytics tools directly into Sheets on a schedule (even every 15 minutes), eliminating manual exports and reducing errors.
However, if your data lives entirely in Sheets and doesn’t need to be combined with external sources, you may not need a dedicated blending tool.
5. Which tools can be used to blend data if I only use Google Workspace?
Coupler.io is the best choice for Google Workspace users. It has native integration with Google Sheets, Google Analytics, Google Ads, and BigQuery, allowing you to automate data flows entirely within the Google ecosystem. Setup takes minutes, not hours, and requires no technical knowledge.
Power BI and Tableau can also connect to Google services, but they’re primarily visualization tools rather than automation platforms.
Can I try the mentioned tools before committing?
Yes, most tools offer free trials:
- Coupler.io: 7-day free trial, no credit card required
- Power BI: Free desktop version available; 60-day Pro trial
- Tableau: 14-day free trial of Tableau Creator
- Alteryx: 30-day free trial with full Designer functionality
- Integrate.io: 14-day free trial (contact required)
- Qlik: Demo available upon request
We recommend starting with tools that offer no-credit-card trials so you can evaluate fit without commitment.
What happens to my blended data if I cancel my subscription?
Coupler.io, Power BI, Tableau: Your blended datasets remain in their destination (Google Sheets, BigQuery, etc.). You lose automated refresh capabilities, but keep your data.
Alteryx, Integrate.io, Qlik, Talend: Workflows stop running, but data already moved to your warehouse or destination remains accessible. You’ll need to export workflow configurations if you want to recreate them elsewhere.
Best practice: Always ensure your blended data is stored in a platform you control (your own data warehouse, Google Sheets, etc.) rather than solely within the blending tool.
What’s the difference between data blending and data transformation?
Data blending is about combining data from multiple sources into one dataset, while data transformation modifies the data’s structure or format.
For instance, blending merges a CRM export with ad performance data; transformation might clean missing values, normalize date formats, or calculate new metrics like ROI. In most workflows, these two steps happen together, first blend, then transform, to create consistent, analysis-ready data.
How secure are cloud-based data blending solutions?
Leading data blending tools follow enterprise-grade security standards. Platforms like Coupler.io, Qlik Talend, and Alteryx are SOC 2 Type II certified, GDPR-compliant, and use encryption for all data pipelines.
Users can also control which columns or datasets are shared, define access roles, and monitor audit trails. This means sensitive business information, like financial transactions or customer records, remains protected throughout the blending and automation process.
When evaluating a provider, always review:
- Encryption standards (in transit and at rest)
- Compliance certifications (SOC 2, GDPR, HIPAA, ISO)
- Access controls and permission settings
- Whether the tool uses your data to train AI-powered models
Your next steps
Based on this guide, you should now have 1-2 tools that match your needs and budget. Here’s how to move forward:
If you chose Coupler.io:
Start with the 7-day free trial and connect your first 2-3 data sources (no credit card required). Most teams have their first automated dashboard running within 2 hours. Focus on your highest-impact use case first—typically marketing ROI tracking or financial reporting—to demonstrate quick value to stakeholders.
If you chose Alteryx or Qlik Talend:
Request a demo and prepare a detailed list of:
- Your current data sources and volumes
- Desired workflows and transformation logic
- Team size and technical skill levels
- Compliance and governance requirements
Enterprise tools require proper scoping. Expect 2-4 weeks for evaluation and 4-8 weeks for implementation. Budget for training costs and potential consulting support.
If you chose Tableau or Power BI:
Evaluate whether you need a dedicated blending tool (like Coupler.io) to handle data prep before visualization. Many teams find that combining a no-code automation platform with their existing BI tool delivers better results than trying to do everything in one system.
This approach separates concerns: let the automation tool handle data collection and blending, and let your BI tool focus on visualization and analysis.
If you chose Integrate.io:
Schedule a consultation with their team to discuss your specific data sources and pipeline requirements. Given the $1,999/month starting price, ensure you have a clear ROI calculation before committing. Many teams with 10+ complex data sources and moderate technical resources find Integrate.io worth the investment.
Still unsure?
Start with the tool that has the lowest barrier to entry for your team’s skill level.
For most small-to-midsize businesses, that means Coupler.io. It also allows you to scale to enterprise level in time. The most successful implementations happen when teams:
- Start small (2-3 data sources)
- Solve one specific problem first
- Demonstrate value quickly (within 1-2 weeks)
- Expand gradually as confidence grows
Ready to eliminate manual data work? Start automating your data blending today with Coupler.io and experience how effortless connected data can be.