
Many businesses find Databox a lifesaver for data visualization. They appreciate it for the smooth setup, the multitude of available integrations, and the ability to put up a good-looking dashboard within minutes. It won’t work for everyone, though. Many users stumble upon its limitations and, sooner or later, end up looking for Databox competitors.
And there are plenty of them – dashboard builders, BI tools, spreadsheets, data integration services, and more. Ultimately, it comes down to your specific needs, the resources you already have, and the outcome you’re aiming for. Let’s look at some viable alternatives to Databox.
What are Databox alternatives
We’ve handpicked 8 excellent Databox alternatives that offer just as much or even more. Before we go deeper, here’s a quick snapshot of them. 👇
| Feature | Databox | Coupler.io | Whatagraph | GoodData | Geckoboard | Grow | Dashthis | Data Studio | AgencyAnalytics |
| Starting price/month | $159 | $24 | $229 | custom | $79 | custom | $44 | Free | $41.30 |
| Free trial | ✅ | ✅ | ✅ | ✅ | ✅ | ✅ | ✅ | ✅ | ✅ |
| Total data sources | 130+ | 400+ | 50+ | 20+ | 90+ | 75+ | 30+ | 22 Google connectors 1000+ partner connectors | 80+ |
| All data sources available in all plans | ⛔ | ✅ | ⛔ | ✅ | ✅ | N/A | ✅ | ✅ | ✅ |
| Data destinations | ⛔ | BI tools Spreadsheets Databases JSON AI tools Other destinations | BigQuery Data Studio Google Sheets | Email Slack Cloud storage | Slack Microsoft Teams | Email Slack | Google Sheets Google Chat | ||
| Data transformation | Custom fields Creating/editing columns Filtering Data blending | Column management Filtering Sorting Custom calculations Data aggregation Data blending (append & join) | Column management Custom calculations Filtering Data blending | Filtering Sorting Custom calculations Data aggregation Data blending | Filtering Editing columns Custom calculations | Column management Custom calculations Data blending Filtering Sorting | Filtering Data blending | Column management Filtering Sorting Custom calculations Data aggregation Data blending | Filtering Sorting Custom calculations Data blending |
| Min. update frequency (approx.) | 15 min. | 15 min. | 30 min. | 15 min. | Immediately | 5 min. | daily | every min. | daily |
| Dashboard templates | 200+ | 200+ | 40+ | N/A | 100+ | 15+ | 50+ | 40+ | 90+ |
| AI capabilities | Genie AI Analyst MCP server | Coupler AI (AI Agent, AI Integrations, Skills) AI Insights | Whatagraph IQ IQ Agents MCP server | — | Metrics MCP Server | — | AI insights | — | AgencyAI MCP server |
| Analytics services | ✅ | ✅ | ⛔ | ✅ | ⛔ | ✅ | ⛔ | ⛔ | ⛔ |
| User reviews (G2/Capterra) | 4.4/5 4.6/5 | 4.9/5 4.9/5 | 4.5/5 4.4/5 | 4.2/5 4.3/5 | 4.3/5 4.7/5 | 4.3/5 4.5/5 | 4.7/5 4.5/5 | 4.4/5 4.6/5 | 4.7/5 4.8/5 |
Top Databox alternative


Coupler.io is the leading Databox alternative for those who need more than dashboards – a reporting automation platform for business teams that keeps data ready for reports and AI. It lets you extract data from 400+ sources, transform it, visualize it in-app, or deliver it to spreadsheets, BI tools, data warehouses, JSON, and AI agents.
All of this combined makes it a more versatile choice for reporting automation and AI than Databox. Coupler.io is widely used by companies and has already helped them achieve measurable results:
- Reduced reporting time by 80+ hours monthly for the United Way Northwest Indiana non-profit organization
- Improved report accuracy to 95% for SellThru digital marketing agency
- Saved $60,000 annually on data analytics for Fable e-commerce business
- Cut dashboard setup time by 90% for ULTRA\OPS digital consultancy
- Saved 15 hours per day on admin time for DE-YAN accounting firm with automated QuickBooks reporting
- Increased revenue by 40% for PlumbBooks bookkeeping service through interactive client dashboards
The Analytical Engine runs the calculations behind Coupler AI’s answers. Data Context and Business Context supply your definitions, so a question about revenue uses your definition of revenue. Skills provide prebuilt workflows for common analyses.

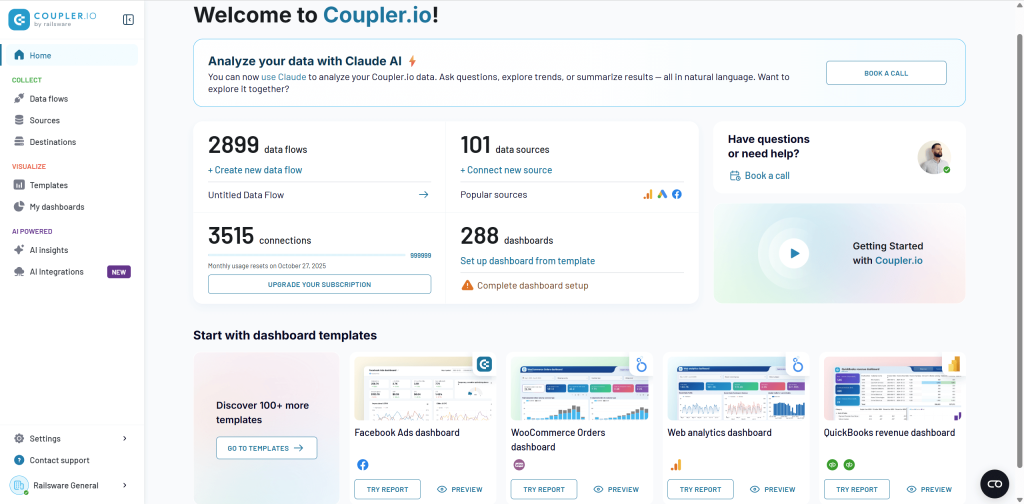
Why is Coupler.io better than Databox?
No-code platform
Coupler.io lets you build complete reporting flows without engineering skills. You can also use custom SQL (DuckDB) when needed. Connect sources, apply transformations, blend datasets, and export to your preferred destinations – all through a user-friendly, intuitive UI.
All sources on every plan
Unlike Databox, which limits sources on lower tiers, Coupler.io allows you to use all 400+ data integrations from day one. No hidden fees, no per-source pricing.
All destinations included
On every plan, you can send your data to:
- Spreadsheets: Google Sheets, Excel.
- BI tools: Data Studio, Power BI, Tableau, Qlik.
- Databases: BigQuery, PostgreSQL, Redshift, Snowflake, Supabase
- AI tools: Claude, ChatGPT, Gemini, Perplexity, Cursor, Copilot, and Custom MCP.
- Other destinations: monday.com, JSON.
Powerful no-code data transformations
Coupler.io offers a complete in-app transformation suite: column management, filtering, sorting, custom calculations, aggregation (sum, avg., count, min., max.), and data blending.
For faster reporting based on predefined criteria, you can use:
- 200+ dashboard templates for PPC, finance, sales, SEO, ecommerce, social media, and more.
- 150+ dataset templates with pre-configured metrics and transformations.
Templates save hours of setup and give you instantly functional reporting.
AI capabilities
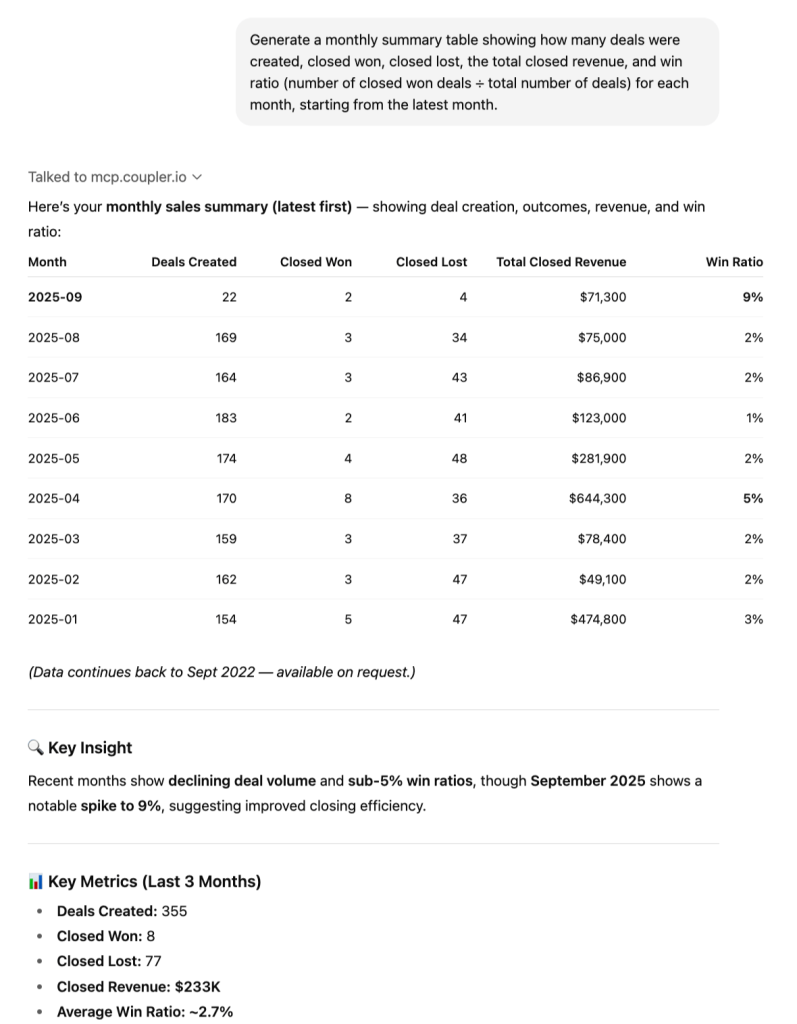
Coupler.io offers Coupler AI for conversational analysis and AI Insights for dashboard performance analysis.
- AI Insights – automated reports that analyze performance and highlight opportunities.
- Coupler AI includes an AI Agent that assembles data flows and surfaces insights from data already loaded. It’s backed by AI Integrations and Skills.
- AI Integrations connect your data to external AI tools via MCP.

Exceptional support
Coupler.io receives 4.9 on G2 and 4.9 on Capterra, winning against Databox.
These examples illustrate that Coupler.io doesn’t just replicate Databox’s dashboard functionality. It transforms reporting into an automated, AI-enhanced workflow that saves time, reduces errors, and empowers smarter decision-making.
Databox vs. Coupler.io – detailed comparison
| Feature | Coupler.io | Databox |
| Starting price | $24/month | $159/month |
| Data sources | 400+ (all plans) | 130+ (limited by plan) |
| Data destinations | BI tools, spreadsheets, databases, JSON, AI tools, and more | Mostly internal dashboards |
| No-code transformations | Column management Filtering Sorting Custom calculations Data aggregation Data blending (append & join) | Custom fields Creating/editing columns Filtering Data blending |
| Templates | 200+ dashboard templates, 150+ dataset templates | 200+ dashboards only |
| AI features | Coupler AI (AI Agent, AI Integrations, Skills), AI Insights | Genie AI Analyst, MCP server |
| Min. refresh frequency (approx.) | Every 15 minutes | Every 15 minutes |
| Automation | Scheduled + event-driven webhooks | Scheduled only |
| Support rating(G2/Capterra) | 4.9/5 4.9/5 | 4.4/5 4.6/5 |
| Transparency | All sources and destinations included | Extra fee per source |
See how Coupler.io compares to other tools
1. Integrations (sources & destinations)
Coupler.io offers a noticeably broader data ecosystem, connecting to 400+ sources, all of which stay fully available across every plan. You can export data not only to spreadsheets but also to BI tools, databases, JSON endpoints, and even AI agents. It also includes built-in multi-source blending, so combining datasets doesn’t require extra tools or upgrades.
Databox, by contrast, supports around 130 sources, and a significant portion of them sit behind higher-tier plans. The platform focuses on dashboards, which means no exports to BI tools or databases, and it also doesn’t support AI destinations. It works well for simple reporting, but it doesn’t offer the same flexibility for complex analytics workflows.
2. Data transformation
Coupler.io provides a transformation toolkit with no-code options and custom SQL, which means you can validate and adjust data before exporting it anywhere:
- Filter and sort data.
- Hide, rename, and reorder columns.
- Apply custom formulas.
- Run aggregations (sum, avg., count, min., max.) and more.
Databox, meanwhile, offers only lightweight transformation options, mainly designed to support its visualizations. These tools help shape charts, but they don’t function as a full ETL environment and can’t match the depth of transformation workflows available in Coupler.io.
3. Dashboards & templates
Coupler.io offers a broad reporting ecosystem that goes well beyond dashboards. The platform includes 200+ ready-made dashboard templates and 150+ dataset templates. This gives you a fast starting point for both visualizations and underlying data models. You can also build native Coupler.io dashboards enhanced with AI insights, and data up to 500k rows can be loaded in under 10 seconds.
Databox provides 200+ dashboard templates and includes AI insights as well, but its offering is focused solely on dashboards. It does not include dataset templates, which limits flexibility for teams that need reusable data structures.
4. Automatic data refresh
Both tools support refresh as often as every 15 minutes. But Coupler.io additionally offers:
- Event-driven automations via webhooks.
- More flexible scheduling, with options from every 15 minutes to monthly, plus control over exact days, times, and time zones.
5. Pricing transparency
Coupler.io keeps pricing simple: all sources and all destinations are included on every plan, starting at $24/month. There are no per-source fees, so you can scale reporting without constantly adjusting costs.
Databox, on the other hand, starts at $159/month and includes only three data sources by default. Each additional source comes with an extra charge of $5.60 per month, which can make the platform significantly more expensive as your reporting grows.
To understand how Coupler.io and Databox stack up in real life, let’s walk through a few concrete pricing scenarios. Each one reflects a common marketing setup – a solo marketer or small business owner, a small marketing team, a marketing analyst + team, and a large marketing agency. This lets you quickly see how pricing shifts from the simplest workflow to fully scaled operations. 👇
Scenario 1: Solo marketer or small business owner
| Requirements | Coupler.io cost | Databox cost | Winner |
| Setup • 1 user. • 1 data source. • 1 destination. • Daily refresh. | Starter: $24/month (billed annually). Includes 3 accounts, 1 user, unlimited sources, 1 destination. | Professional: $159/month. Includes 3 data sources, unlimited users, and unlimited dashboards. Extra data source: +$5.60/month | ✅ Coupler.io Saves $135/month ($1,620/year). Why Coupler.io: Databox charges a high base price even for a minimal setup. Coupler.io provides sufficient functionality at a lower cost. |
Scenario 2: Small marketing team
| Requirements | Coupler.io cost | Databox cost | Winner |
| Setup • 5 users. • 10 data sources. • 3 destinations. • Daily refresh. | Active: $99/month. Includes 15 accounts, unlimited users, unlimited sources, and 3 destinations. | Professional: $159/month. 3 data sources included + 7 extra sources × $5.60 = $39.20. Total: $198.20/month. | ✅ Coupler.io Saves $99/month ($1,188/year). Why Coupler.io: No per-user or per-destination costs, unlimited data sources included in plan, and more predictable budgeting. |
Scenario 3: Marketing analyst + team
| Requirements | Coupler.io cost | Databox cost | Winner |
| Setup • 15 users. • 25 data sources. • 5 destinations. • Hourly refresh. | Pro: $199/month. Includes 50 accounts, unlimited users, unlimited sources, unlimited destinations, and hourly refresh. | Growth: $399/month. 3 data sources included + 22 extra × $5.60 = $123.20. Total: $522.20/month. | ✅ Coupler.io Saves $323/month ($3,876/year). Why Coupler.io: Enterprise-grade features and hourly refresh included at a lower cost; Databox charges heavily for extra sources. |
Scenario 4: Large marketing agency
| Requirements | Coupler.io cost | Databox cost | Winner |
| Setup • 50+ users. • 50+ data sources. • 6+ destinations. • 15-minute refresh. | Custom: Custom pricing. Unlimited users, sources, destinations, 15-min refresh. | Premium: $799/month. 100 data sources included. Extra data sources $5.60/month. Limited to 5 sources for 15-min sync. | ✅ Coupler.io More predictable and transparent pricing. Why Coupler.io: Databox limits fast-refresh capability and charges extra per source. Coupler.io provides unlimited scaling and advanced refresh options in one plan. |
Key takeaways:
- No per-user charges – Coupler.io Active and above plans include unlimited users.
- No per-source charges – All 400+ sources available on every plan.
- No per-destination charges – Pro plan and above include unlimited destinations.
- Flexible refresh rates – Hourly or 15-minute refresh available without extra cost.
- Transparent scaling – Coupler.io’s pricing grows only with connected accounts, unlike Databox, which charges per data source.
Coupler.io is a clearer, more cost-efficient solution for teams of all sizes, while Databox’s pricing can quickly escalate as users or data sources increase.
Winner: Coupler.io, offering the best value for money.
When to use Coupler.io instead of Databox
Choose Coupler.io if:
- You need a full reporting and analytics platform, not just dashboards.
- Your workflows involve multiple data sources, destinations, or complex transformations.
- You want no-code transformations, data blending, and Coupler AI directly from your data.
- You value pricing transparency with no per-source or per-user fees.
- You require frequent updates or event-driven automations for real-time reporting.
- You’re seeking a data analytics service (Coupler.io provides that as well).
Choose Databox if:
- Your primary focus is simple: visually appealing dashboards for internal or client reporting.
- You have a limited number of data sources and don’t need advanced data transformations.
- You prefer an all-in-one dashboard solution with basic AI insights, without exporting to BI tools or databases.
- Your team is small, and higher pricing isn’t a concern for fewer sources.
In short, Coupler.io is ideal for versatile, scalable reporting and AI analytics, while Databox works best for teams focused solely on dashboard visualization. The Coupler.io vs Databox breakdown lays out the differences side by side.
Other Databox competitors in detail
You can also consider these alternatives to Databox:
1. Whatagraph


Whatagraph is a marketing reporting platform designed primarily for agencies and multi-client teams. It centralizes data from marketing sources, standardizes it, and outputs automated, branded reports or dashboards with minimal manual work.
Whatagraph’s biggest strength is fully automated multi-client reporting, powered by templates, cross-channel metric blending, and AI summaries. It is built specifically for agencies that need fast delivery of standardized, professional marketing reports.
Whatagraph vs. Databox – comparison
| Feature | Whatagraph | Databox | Coupler.io |
| Starting price | $229/month | $159/month | $24 |
| Free trial | ✅ | ✅ | ✅ |
| Total data sources | 50+ | 130+ | 400+ |
| All sources available in all plans | ⛔ | ⛔ | ✅ |
| Data destinations | BigQuery, Data Studio, Google Sheets | ⛔ | BI tools, spreadsheets, databases, JSON, AI tools, and more |
| Transformations | Column management Custom calculations Filtering Data blending | Custom fields Creating/editing columns Filtering Data blending | Column management Filtering Sorting Custom calculations Data aggregation Data blending (append & join) |
| Templates | 40+ | 200+ | 200+ |
| Minimum update frequency (approx.) | 30 min. | 15 min. | 15 min. |
| AI capabilities | Whatagraph IQ, IQ Agents, MCP server | Genie AI Analyst, MCP server | Coupler AI (AI Agent, AI Integrations, Skills), AI Insights, AI integrations |
| User reviews (G2/Capterra) | 4.5/5 4.4/5 | 4.4/5 4.6/5 | 4.9/5 4.9/5 |
Integrations overview
Whatagraph integrates with 50+ marketing platforms:
- PPC: Google Ads, Facebook Ads.
- SEO: Ahrefs, Google Search Console.
- Social: Facebook, Instagram, LinkedIn.
- CRM/Email: HubSpot, Constant Contact.
- Other marketing tools.
If you have a custom data source or want to connect a platform outside the current integrations, Whatagraph provides an easy-to-set-up custom API. You can also export your data to BigQuery, Data Studio, or Google Sheets. And if you desire more freedom of choice in this respect, you’ll need to simply find an alternative to Whatagraph.
Features overview
- Automated cross-channel reporting.
- Report and dashboard templates.
- Metric harmonization and custom formulas.
- AI-generated summaries and next-step suggestions.
- Multi-client workspace structure.
- Live-link and scheduled report delivery.
Pricing overview
Whatagraph offers three pricing plans based on the amount of “source credits” and access to customization and data organization capabilities. You can use source credits to connect data sources, send data from a source to a warehouse, and blend cross-channel data.
Pricing starts at $229/month, with higher tiers offering more credits and customization.
Pros
- Excellent for agencies with many clients.
- Automated reporting with minimal manual upkeep.
- Clean templates ready for client delivery.
- AI summaries improve clarity and speed.
- Easy blending of cross-channel metrics.
Cons
- More expensive than most competitors.
- Limited data destinations compared to advanced ETL tools.
When to use Whatagraph over Databox
Choose Whatagraph if you’re an agency needing fast, automated report generation for many clients, especially when delivering polished, branded, cross-channel marketing reports.
2. GoodData


GoodData is a BI and analytics platform that connects directly to databases and data warehouses. Instead of importing data from apps, it queries cloud storage systems and transforms results into dashboards and analytics tools.
GoodData specializes in warehouse-native analytics, ideal for teams with centralized data infrastructure and a need for scalable, self-service dashboards.
GoodData vs. Databox – comparison
| Feature | GoodData | Databox | Coupler.io |
| Starting price | Custom | $159/month | $24 |
| Free trial | ✅ | ✅ | ✅ |
| Total data sources | 20+ warehouse/DB connections | 130+ sources | 400+ |
| All sources available in all plans | ✅ | ⛔ | ✅ |
| Data destinations | Email Slack Cloud storage | ⛔ | BI tools, spreadsheets, databases, JSON, AI tools, and more |
| Transformations | Filtering Sorting Custom calculations Data aggregation Data blending | Custom fields Creating/editing columns Filtering Data blending | Column management Filtering Sorting Custom calculations Data aggregation Data blending (append & join) |
| Templates | To verify | 200+ | 200+ |
| Minimum update frequency (approx.) | 15 min. | 15 min. | 15 min. |
| AI capabilities | — | Genie AI Analyst, MCP server | Coupler AI (AI Agent, AI Integrations, Skills), AI Insights, AI integrations |
| User reviews (GA/Capterra) | 4.2/5 4.3/5 | 4.4/5 4.6/5 | 4.9/5 4.9/5 |
Integrations overview
GoodData provides native connectivity to sources like:
- Snowflake.
- BigQuery.
- Redshift.
- Azure SQL.
- PostgreSQL.
- MySQL.
Rather than pulling data from apps, GoodData sits on top of warehouse environments.
Features overview
- Self-service analytics & dashboards.
- Drag-and-drop exploration.
- Custom SQL and metrics layer.
- Embedded analytics.
- Governance, security & enterprise permissions.
- AI insights and natural-language queries.
Pricing overview
GoodData has two main plans: Professional and Enterprise. Professional is priced per workspace, supports unlimited users, and includes dashboards, reporting, and basic analytics tools. For larger organizations, Enterprise offers advanced AI features, dedicated support, and enterprise-grade security, with custom pricing based on needs.
Pros
- Warehouse-native architecture.
- Flexible analytics for both technical & non-technical users.
- Strong embedded analytics.
- Robust data governance.
Cons
- Expensive for smaller teams.
- Requires data engineering maturity.
- Not suitable for dashboard-only users.
When to use GoodData over Databox
Choose GoodData when your company already stores data in a warehouse and requires scalable BI, SQL modeling, and embedded analytics.
3. Geckoboard


Geckoboard is a real-time KPI dashboard tool designed for operational visibility. It pulls data from popular business apps and enables teams to visualize performance metrics on TVs or shared screens.
Geckoboard vs. Databox – comparison
| Feature | Geckoboard | Databox | Coupler.io |
| Starting price | $79/month | $159/month | $24 |
| Free trial | ✅ | ✅ | ✅ |
| Total data sources | 90+ | 130+ | 400+ |
| All sources in all plans | To clarify | ⛔ | ✅ |
| Data destinations | Slack, email, Teams | ⛔ | BI tools, spreadsheets, databases, JSON, AI tools, and more |
| Transformations | Filtering Editing columns Custom calculations | Custom fields Creating/editing columns Filtering Data blending | Column management Filtering Sorting Custom calculations Data aggregation Data blending (append & join) |
| Templates | 100+ | 200+ | 200+ |
| Minimum update frequency (approx.) | Immediate | 15 min. | 15 min. |
| AI capabilities | Metrics MCP Server | Genie AI Analyst, MCP server | Coupler AI (AI Agent, AI Integrations, Skills), AI Insights, AI integrations |
| User reviews | 4.3/5 4.7/5 | 4.4/5 4.6/5 | 4.9/5 4.9/5 |
Integrations overview
Geckoboard integrates with sources such as:
- GA4.
- Salesforce.
- Zendesk.
- Stripe.
- Airtable.
- Jira.
- Shopify.
- HubSpot.
Plus spreadsheet integrations.
Features overview
- Real-time KPI dashboards.
- TV mode with auto-refresh cycles.
- Goal tracking with color-coded indicators.
- Shareable live dashboard links.
- Automatic alerts.
- Drag-and-drop dashboard builder.
Pricing overview
Geckoboard offers tiered pricing for teams of different sizes and needs, starting with the Essentials plan for basic dashboards and small teams. The Performance plan adds more dashboards, editors, TV screens, and advanced features like drilldown, alerts, and custom dashboard templates. For large organizations, the Enterprise plan provides custom solutions with SSO, dedicated support, and scalable controls.
Pros
- Excellent real-time dashboards.
- Ideal for team visibility on TVs.
- Simple UI, fast setup.
- Automatic status alerts.
Cons
- Limited data modeling.
- Not suitable for complex reporting.
- Fewer templates than Databox.
When to use Geckoboard over Databox
Choose Geckoboard when you need operational dashboards, real-time updates, and TV display support.
4. Grow


Grow is a no-code BI platform that centralizes data storage, transformations, and dashboards in a single environment. It offers both ETL capabilities and built-in visualizations.
Grow’s standout feature is its integrated data warehouse, allowing companies to store datasets, apply business logic, and build dashboards on top of unified data.
Grow vs. Databox – comparison
| Feature | Grow | Databox | Coupler.io |
| Starting price | custom | $159/month | $24 |
| Free trial | ✅ | ✅ | ✅ |
| Total data sources | 75+ | 130+ | 400+ |
| All sources in all plans | ✅ | ⛔ | ✅ |
| Data destinations | Email, Slack | ⛔ | BI tools, spreadsheets, databases, JSON, AI tools, and more |
| Transformations | Column management Custom calculations Data blending Filtering Sorting | Custom fields Creating/editing columns Filtering Data blending | Column management Filtering Sorting Custom calculations Data aggregation Data blending (append & join) |
| Templates | 15+ | 200+ | 200+ |
| Min update | Daily | 15 min. | 15 min. |
| AI features | — | Genie AI Analyst MCP server | Coupler AI (AI Agent, AI Integrations, Skills), AI Insights, AI integrations |
| User reviews (G2/Capterra) | 4.3/5 4.5/5 | 4.4/5 4.6/5 | 4.9/5 4.9/5 |
Integrations overview
Grow connects to sources like:
- HubSpot.
- Shopify.
- QuickBooks.
- Salesforce.
- Stripe.
- Google Sheets.
- Custom REST API sources.
Features overview
- Built-in data warehouse.
- Data transformations (filtering, joins, calculations).
- Fully custom dashboards.
- Reusable datasets.
- Blueprint dashboard templates.
Pricing overview
Custom quotes only, depending on team size and data volume.
Pros
- Data warehouse included.
- No-code & SQL transformations.
- Highly customizable dashboards.
- Scalable for BI teams.
Cons
- Expensive.
- Not designed for fast marketing dashboards.
- Fewer templates than Databox.
When to use Grow over Databox
Use Grow if you want a BI-focused solution with strong data prep and storage capabilities.
5. DashThis


DashThis is a marketing dashboard tool that centralizes data from major marketing platforms into easy-to-read templates. It focuses heavily on simplicity and fast delivery for agencies and consultants.
DashThis is known for extremely fast dashboard setup thanks to plug-and-play templates for SEO, PPC, social, and email marketing.
DashThis has also been featured in our article about Klipfolio alternatives.
DashThis vs. Databox – comparison
| Feature | DashThis | Databox | Coupler.io |
| Starting price | $44/month | $159/month | $24 |
| Free trial | ✅ | ✅ | ✅ |
| Total data sources | 30+ | 130+ | 400+ |
| All sources on all plans | ✅ | ⛔ | ✅ |
| Destinations | Google Sheets export | ⛔ | BI tools, spreadsheets, databases, JSON, AI tools, and more |
| Transformations | Filtering, blending | Custom fields Creating/editing columns Filtering Data blending | Column management Filtering Sorting Custom calculations Data aggregation Data blending (append & join) |
| Templates | 50+ | 200+ | 200+ |
| Min. update | Daily | 15 min. | 15 min. |
| AI capabilities | AI insights | Genie AI Analyst MCP server | Coupler AI (AI Agent, AI Integrations, Skills), AI Insights, AI integrations |
| User reviews (G2/Capterra) | 4.7/5 4.5/5 | 4.4/5 4.4/5 | 4.9/5 4.9/5 |
Integrations overview
DashThis integrates with sources such as
- GA4.
- Facebook Ads.
- HubSpot.
- Mailchimp.
- LinkedIn.
- Klaviyo.
- Google Ads.
Plus CSV and Google Sheets imports.
Features overview
- Ready-made SEO, PPC, and social dashboards.
- Unlimited users.
- White labeling.
- Modular template system.
- Quick onboarding.
Pricing overview
DashThis offers tiered plans starting at $44/month for individuals, with larger Professional, Business, and Standard plans ($139–$429/month) supporting more dashboards and advanced features. All plans include unlimited users and integrations, plus AI Insights and the MCP Connector. Connected data sources are capped per plan: 15 on Individual, 40 on Professional, 100 on Business, and 200+ on Standard. White-label options and enhanced support are available as add-ons or in higher tiers. AI Insights PRO is an add-on at $19/month, or $15/month billed yearly.
Pros
- Easiest setup among marketing dashboard tools.
- Great for agencies.
- Solid template selection.
- Simple pricing.
Cons
- Limited data modeling.
- Slowest refresh intervals.
- Fewer integrations vs. Databox.
When to use DashThis over Databox
Choose DashThis for quick, marketing-focused dashboards with minimal configuration.
6. Data Studio


Data Studio (formerly Google Data Studio) is Google’s free dashboard and data visualization tool. It supports 20+ native connectors and 1,000+ partner integrations.
Here is an example of an All-in-one marketing dashboard built in Data Studio and powered by Coupler.io.

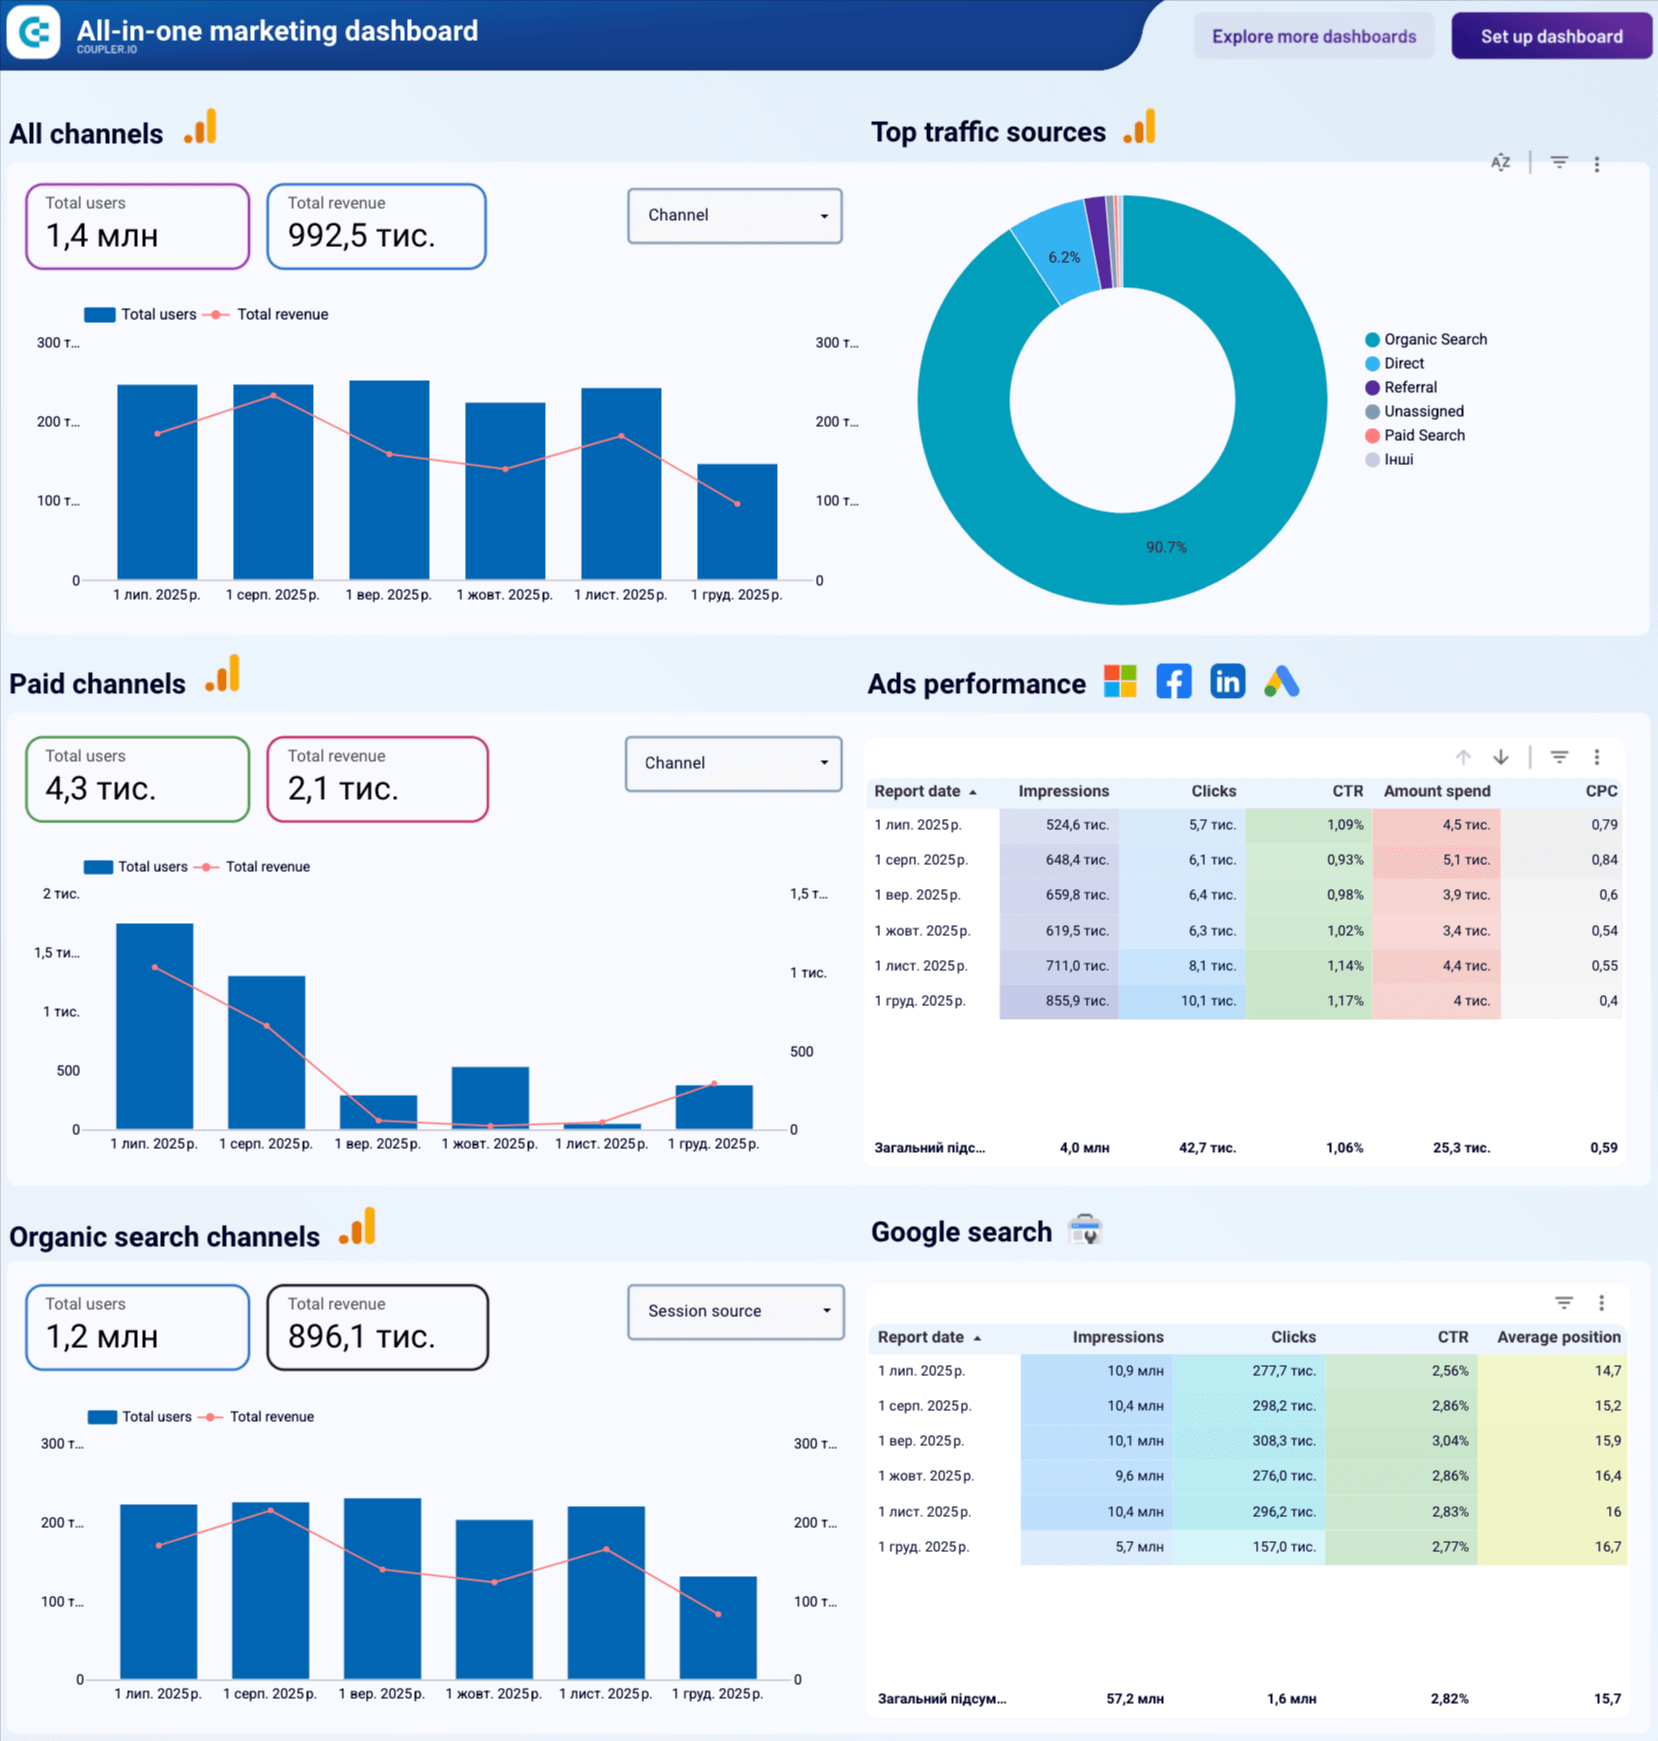
Data Studio’s biggest advantage is that it is free and extremely flexible, with an immense library of third-party connectors.
Data Studio vs. Databox – comparison
| Feature | Data Studio | Databox | Coupler.io |
| Starting price | Free | $159/month | $24 |
| Free trial | ✅ | ✅ | ✅ |
| Total data sources | 1,000+ via partners | 130+ | 400+ |
| All sources on all plans | ✅ | ⛔ | ✅ |
| Data destinations | Google Sheets Google Chat | ⛔ | BI tools, spreadsheets, databases, JSON, AI tools, and more |
| Transformations | Column management Filtering Sorting Custom calculations Data aggregation Data blending | Custom fields Creating/editing columns Filtering Data blending | Column management Filtering Sorting Custom calculations Data aggregation Data blending (append & join) |
| Templates | 40+ | 200+ | 200+ |
| Min. update frequency (approx.) | Every min. | 15 min. | 15 min. |
| AI capabilities | — | Genie AI Analyst MCP server | Coupler AI (AI Agent, AI Integrations, Skills), AI Insights, AI integrations |
| User reviews (G2/Capterra) | 4.4/5 4.6/5 | 4.4/5 4.6/5 | 4.9/5 4.9/5 |
Integrations overview
Native connectors include:
- BigQuery.
- GA4.
- Google Ads.
- Google Sheets, etc.
Partner connectors (1000+) expand this to nearly all major marketing, ecommerce, CRM, and financial tools.
Features overview
- Free dashboarding.
- Unlimited reports and users.
- Drill-down exploration.
- Calculated fields.
- Data blending.
- Report embedding.
You can start building dashboards from scratch or grab a Data Studio dashboard template to speed things up significantly.
Pricing overview
Completely free, but many connectors are paid.
Pros
- Free to use.
- Massive connector marketplace.
- Highly customizable dashboards.
- Fast refresh when using Sheets or BigQuery.
Cons
- Performance issues on large datasets.
- Complexity grows fast.
- Requires external connectors for most data.
When to use Data Studio over Databox
Choose Data Studio when you want maximum flexibility at zero cost, especially if you already work inside the Google ecosystem.
7. AgencyAnalytics


AgencyAnalytics is an agency-focused reporting platform that consolidates client data, enables client-specific user roles, and automates multichannel reporting with templates.
Advanced client management features – separate client accounts, role permissions, and agency-focused workflows.
AgencyAnalytics vs. Databox – comparison
| Feature | AgencyAnalytics | Databox | Coupler.io |
| Starting price | $41.30/month | $159/month | $24 |
| Free trial | ✅ | ✅ | ✅ |
| Total data sources | 80+ | 130+ | 400+ |
| All sources on all plans | ✅ | ⛔ | ✅ |
| Destinations | ⛔ | BI tools, spreadsheets, databases, JSON, AI tools, and more | |
| Transformations | Filtering Sorting Custom calculations Data blending | Custom fields Creating/editing columns Filtering Data blending | Column management Filtering Sorting Custom calculations Data aggregation Data blending (append & join) |
| Templates | 90+ | 200+ | 200+ |
| Min. update | Daily | 15 min. | 15 min. |
| AI capabilities | AgencyAI MCP server | Genie AI Analyst MCP server | Coupler AI (AI Agent, AI Integrations, Skills), AI Insights, AI integrations |
| User reviews (G2/Capterra) | 4.7/5 4.8/5 | 4.4/5 4.6/5 | 4.9/5 4.9/5 |
Integrations overview
Popular integrations include:
- Facebook Ads.
- Google Ads.
- GA4.
- Mailchimp.
- Shopify.
- Instagram Ads.
- HubSpot.
Features overview
- Multi-client reporting portal.
- White-labeled dashboards.
- Scheduled reporting.
- Drag-and-drop builder.
- Advanced permission management.
Pricing overview
AgencyAnalytics offers tiered pricing for agencies and freelancers based on client count and features.
- Freelancer plan (for 5 clients) focuses on basic reporting and dashboards.
- Agency plan (for 10 clients), adding unlimited staff, custom metrics, AI insights, and branding.
- Agency Pro (for 15 clients) includes forecasting, benchmarks, bulk operations, and API access.
- Enterprise pricing is custom, providing dedicated support, concierge setup, and advanced security features.
Pros
- Ideal for agencies.
- Strong user permission controls.
- Clean, fast templates.
- Good pricing for small teams.
Cons
- Slow refresh intervals.
- Fewer integrations than Databox.
- Limited data modeling.
When to use AgencyAnalytics over Databox
Choose AgencyAnalytics if your main focus is client reporting, white-label dashboards, and formal report delivery.
Why do users search for alternatives to Databox?
Although Databox, which is one of the top Polar analytics alternatives, generally receives rather good reviews, there are several recurring complaints you’ll often come across:
Limited visualization options: Databox offers a limited number of visualization options, most of which are basic charts, graphs, tables, and scorecards. If you want to build more advanced visualizations – for example, detailed map charts or histograms – you’ll need to move your data.
Focus on internal dashboards: For advanced analysis and visualization, users may want to move their data to tools like Data Studio, Power BI, Google Sheets, etc. Databox does not support this and focuses on using its internal dashboard templates within the platform.
Restrictive pricing: Although Databox offers several pricing tiers, many users complain that to get the most value out of the product, they would need to upgrade to its highest tier (currently, $799 per month on annual billing).
Subpar support: According to many reviews online, the support Databox offers leaves much to be desired, and the same-day response isn’t often an option. If your issue is simple, such as fixing a chart on a dashboard, you may be able to resolve it rather quickly. If it’s more complex, you may have to figure it out on your own or look for an answer on the forums.
How to choose the best alternative to Databox
Selecting the right Databox alternative depends on how you manage data, your reporting workflow, and how much flexibility you need. Use this quick decision guide to choose the tool that best matches your specific scenario.
If you want an affordable, all-in-one solution that works for nearly any reporting setup, go with Coupler.io.
It’s beginner-friendly, offers flexible destinations (BI tools, spreadsheets, databases, AI tools), and gives you all sources and features on every plan.
If you run marketing reporting with multiple clients and need ready-made templates, go with Whatagraph.
It’s built for agencies and provides structured templates, automated delivery, and standardized client reporting.
If your team needs enterprise-grade analytics that can be embedded inside your product, choose GoodData.
It supports complex modeling, self-service analytics, and scalable embedded dashboards for product teams.
If you need simple KPI dashboards displayed on TVs or real-time screens, pick Geckoboard.
It’s designed for quick KPI visibility and fast, no-code dashboard assembly.
If you want a no-code BI tool with built-in storage and data modeling, go with Grow.
It combines data collection, storage, transformations, and dashboarding inside one platform.
If you just need to build a dashboard quickly with minimal setup, choose DashThis.
It’s ideal for marketers who want fast, template-based reporting without technical steps or configuration.
If you prefer a flexible, free visualization tool and have some analytical skills, go with Data Studio.
It’s highly customizable, but works best when paired with a connector like Coupler.io for reliable, blended data flows.
If you’re an agency managing many clients and need granular permissions, client portals, and automated reporting, choose AgencyAnalytics.
It’s tailored for agency workflows with client-specific dashboards and scalable account management.


Automate data reporting, visualization, and analytics with Coupler.io
Get started for free