Most online retailers running on Shopify or another ecommerce platform end up with a stack of 3 to 5 analytics tools that don’t agree with each other. Shopify says one revenue number, GA4 shows another, Meta reports a third, and the dashboards built to “fix” this charge more every time you grow.
This guide is for DTC operators trying to figure out what to actually do about it. I’ll walk through the three core challenges D2C brands hit when scaling a DTC strategy, the four paths they take to solve them, and which one fits depending on your stage.
The direct to consumer analytics challenges you’ve probably already hit
DTC analytics has three core challenges:
- Data doesn’t match across Shopify, GA4, and ad platforms
- Default Shopify reports stop being useful past revenue
- The tools built to fix both are expensive and don’t talk to each other.
And every new sales channel makes it worse. Brands selling through TikTok Shop, Instagram Shopping, or Amazon alongside their Shopify store are adding data sources that each track orders, attribution, and revenue differently.
Here’s what’s going on with each.
GA4, Shopify, Meta data discrepancies in DTC analytics
If you’re trying to reconcile data across multiple platforms, this is where DTC analytics gets challenging. Shopify, GA4, and Meta will each show you a different revenue number for the same period, and the gap is rarely small.
Each platform measures something slightly different:
- Shopify writes orders directly to its database, so its number is the source of truth for what was actually paid.
- GA4 relies on a browser pixel that gets blocked by ad blockers, iOS privacy settings, or customers closing the tab early.
- Meta runs its own pixel with its own attribution window and counts a conversion any time a user who saw an ad later purchased, even through a different channel.
Server-side tracking via Shopify’s Customer Events API or tools like Littledata closes most of the GA4 gap, but Meta will still disagree because Meta’s job is to take credit for as many conversions as possible.
There are countless threads on this. It’s the most common DTC analytics problem there is.
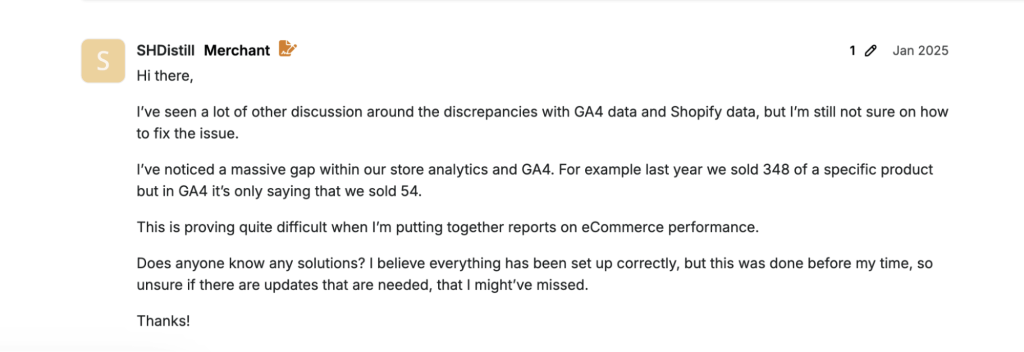
“I’’ve noticed a massive gap within our store analytic and GA4. For example, last year we sold 348 of a specific product but in Ga4 it’s only saying that we sold 54″ — Shopify Community thread on GA4 data discrepancy

The real impact isn’t the gap itself. It’s that you stop knowing which platform to trust for which decision, and most teams react by defaulting to the one number that feels safest: Shopify revenue.
ROAS and MER take the biggest hit since they depend on accurate revenue and ad spend across the same window, and once those are off, every downstream call on DTC digital marketing follows: retention campaigns, messaging, ad spend, and where to invest in customer experience. Which leads to the next challenge.
Scaling from tracking Shopify revenue only to multiple data sources
Once data stops agreeing across tools, most teams do the practical thing and pick the one number they trust most: Shopify revenue. It’s the source of truth for what actually came into the bank account, so it becomes the only number that gets reported on and optimized against.
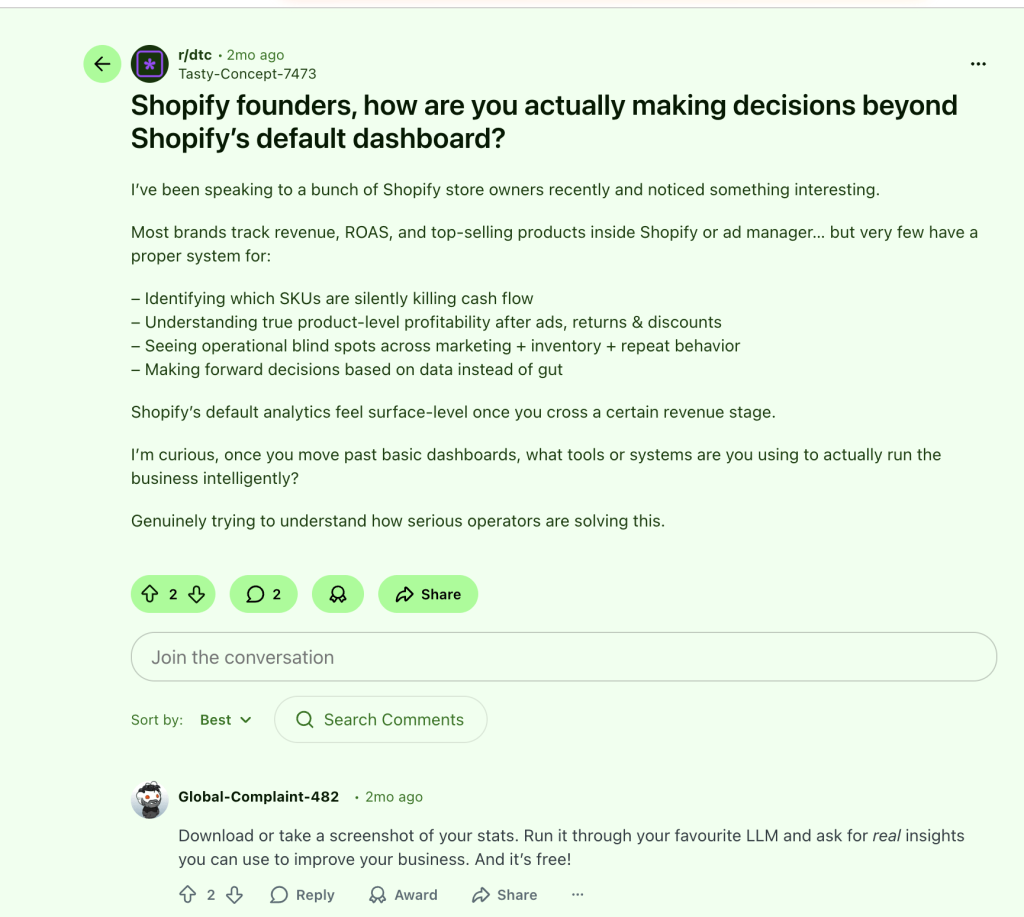
“Most brands track revenue, ROAS, and top-selling products inside Shopify or ad manager… but very few have a proper system for: identifying which SKUs are silently killing cash flow, understanding true product-level profitability after ads, returns & discounts, seeing operational blind spots across marketing + inventory + repeat behavior, making forward decisions based on data instead of gut.” — Tasty-Concept-7473, r/dtc

The issue is that Shopify revenue tells you what happened, not why or what to do next. The metrics that drive actual decisions sit one layer down:
- Contribution margin by SKU, after ads, returns, and discounts
- CAC for new customers vs returning ones, separately
- LTV by acquisition cohort and channel
- MER net of refunds and discounts
- Average order value trends, broken down by channel and customer segment
- Subscription churn rate for brands running subscription services
- Inventory management and turnover and which SKUs are eating cash flow without selling
- Customer feedback patterns from post-purchase surveys, tied back to product and channel
The data for these lives in spreadsheets, in people’s heads, or in a tool you bought specifically to track one of them. The missing piece is the system that pulls it together and surfaces the metrics DTC brands need to optimize the marketing strategy.
Coupler.io connects these sources, such as Shopify, ad platforms, Klaviyo, GA4, and 400+ others, and brings the data into one destination. So the metrics that matter aren’t scattered across five tools anymore.


Connect Shopify and ad platform data with Coupler.io
Get started for freeThe DTC ecommerce analytics tool stack is expensive and picking one is harder than it should be
Most brands pay for 3 to 5 direct to consumer analytics tools at once because no single tool covers the full picture. Each one solves a slice:
- Attribution and unified marketing dashboards: Triple Whale, Polar Analytics, Northbeam, Rockerbox
- Server-side tracking and GA4 fixes: Littledata, Analyzify, RedTrack
- Profit and finance reporting: TrueProfit, BeProfit, Lifetimely
- AI search visibility: LLMrefs, Profound, Triple Whale
- Customer journey and post-purchase: KnoCommerce, Fairing
- Marketplace and social commerce reporting (Amazon, Walmart, TikTok Shop, Instagram) Helium 10, Sellerboard, Trellis
The cost stacks fast. Triple Whale starts at $149/month for $250K GMV/year and scales to $1999/month for $15M. Northbeam starts at $1,500/month if you have lower than $1.5M a year in media spend.
Explore the latest ecommerce analytics trends in our blog.
A growing brand can easily end up at $2,000 to $4,000/month across 3 to 5 tools, each with its own login, its own definitions, and its own historical data that doesn’t come with you when you switch.
The bigger problem isn’t the bill. It’s that paying for 5 tools doesn’t actually automate the cross-source reporting that DTC brands need. None of them get you closer to answering “did ROAS drop because of ad spend, email timing, or fulfillment?” in one dashboard.
Each tool sees its own slice of the customer journey and reports against its own model, so you still end up reconciling numbers manually across your DTC channel, wholesale accounts, and any omnichannel marketing efforts you’re running.
Coupler.io covers the integration piece. You get data from 400+ sources into the destination you already use, whether that’s a spreadsheet, a BI tool, or a data warehouse. That won’t replace your attribution platform, but it does mean you stop paying separate tools just to move data around.
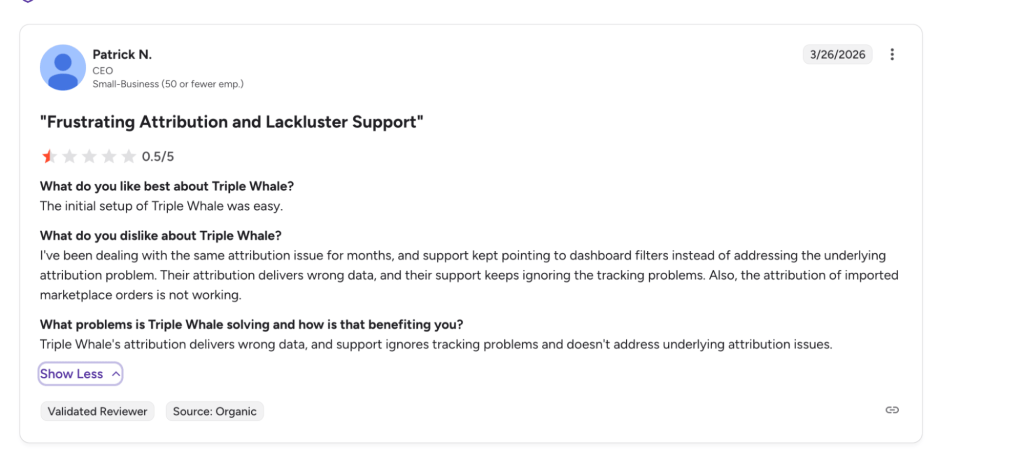
The “buggy attribution” complaints in reviews are usually about exactly this gap.
“The attribution system is consistently buggy and unreliable, causing more harm than good. Not worth the investment.” — G2 reviewer on Triple Whale

More tools doesn’t equal better data. Picking the right setup depends on your stage, your channel mix, and how much of your data layer you want to own. The next section walks through what those tradeoffs actually look like.
Build vs buy in DTC analytics: what each path actually means
Unlike traditional retail, where wholesale partners and distributors handle reporting, the question for any business-to-consumer brand looking to deepen customer relationships by removing middlemen isn’t “which DTC analytics tool should I buy.”
It’s how much of the stack you want to own versus rent. The answer changes the entire setup: pricing, what metrics you can track, who maintains it, and what happens when you outgrow it.
| Buy | Build | |
| Setup time | Hours to days | Hours (templates) to weeks (custom) |
| What you control | Filters and dashboard layout, within the vendor’s product | Data model, metrics, destination, dashboards, attribution logic |
| Pricing model | Order volume, GMV, or revenue tier | Pipeline cost (data volume) + destination cost |
| Metrics available | What the vendor ships | Anything you can join across sources |
| Historical data | Lives in the vendor’s platform | Lives in your destination, portable when you switch tools |
| Maintenance | Vendor handles it | You handle it, with help from AI tools |
| Best fit | Standard channel mix, speed over control, no in-house data work | Custom metrics, multiple data sources, want first-party data ownership |
Four concrete paths for DTC dashboards exist right now. The first is the buy path. The other three are different ways to build, ordered by how much setup they require:
- Enterprise DTC analytics platforms (Triple Whale, Polar, Northbeam): Fully managed, fast to set up, expensive to scale.
- Conversational analytics with Coupler.io AI integrations with Claude or ChatGPT: Connect your data sources, ask questions in plain language, get answers and reports on demand.
- BI dashboards on pulled data using Looker Studio, Google Sheets, or Power BI templates. The classic data-driven setup, with ready-to-use ecommerce templates.
- Vibe-coded custom dashboards built with Claude Code or Cowork on top of your warehouse. More setup, full control over every metric.
Path 1: Enterprise DTC analytics platforms (Triple Whale, Polar, Northbeam)
This path is for retailers running a pure DTC model, that have outgrown Shopify’s built-in reports, spend $150K+/month on paid ads across multiple channels, and want one platform to handle attribution and reporting without anyone in-house touching a data pipeline.
Triple Whale, Polar Analytics, and Northbeam are the three names of analytics tools for ecommerce that come up most often. Fully managed, fast to set up, designed specifically for ecommerce. They overlap on the basics but differ on attribution depth, pricing model, and onboarding.
What it looks like
Connect your Shopify store and social media ad accounts, drop in a proprietary pixel, and the platform handles the rest. Out of the box you get unified marketing dashboards covering brand awareness through to conversion, multi-touch attribution, ROAS by channel, customer journey reporting, and pre-built integrations.
Most also include AI agents (Triple Whale’s Moby, Polar’s Ask Polar AI) that let you query dashboards in plain language.
When it fits
This path is built for DTC brands at a specific stage: enough paid media spend to justify the cost, standard channels, and don’t want to maintain a data pipeline in-house. You’re paying for speed and convenience, and the vendor’s pre-built setup matches how you want to operate.
Choose direct to consumer analytics platforms when:
- You’re spending $150K+/month on paid media across 3+ channels and need clean attribution
- Standard ecommerce metrics (ROAS, CAC, AOV, LTV, contribution margin) cover most of your reporting
- You don’t have anyone in-house to build or maintain a data pipeline
- You want one vendor handling everything and you’re okay paying for the speed
Tradeoffs
What you give up when the vendor owns the schema, the metrics, and the pricing curve:
- Your bill goes up every time you grow, even if you’re not using more of the product
- The moment you need subscription, fulfillment, distributors, supply chain, support, or AI search data alongside marketing, you’re back to running a second tool
- Anything outside the platform’s connectors (subscription churn, fulfillment SLAs, AI search referrals) ends up in a spreadsheet you maintain
- The day you switch tools, your historical reports and the schema you built decisions on don’t come with you
Path 2: Conversational analytics with Coupler.io MCP and Claude or ChatGPT
This path is for DTC brands already using LLMs for analysis but tired of the screenshot workflow.
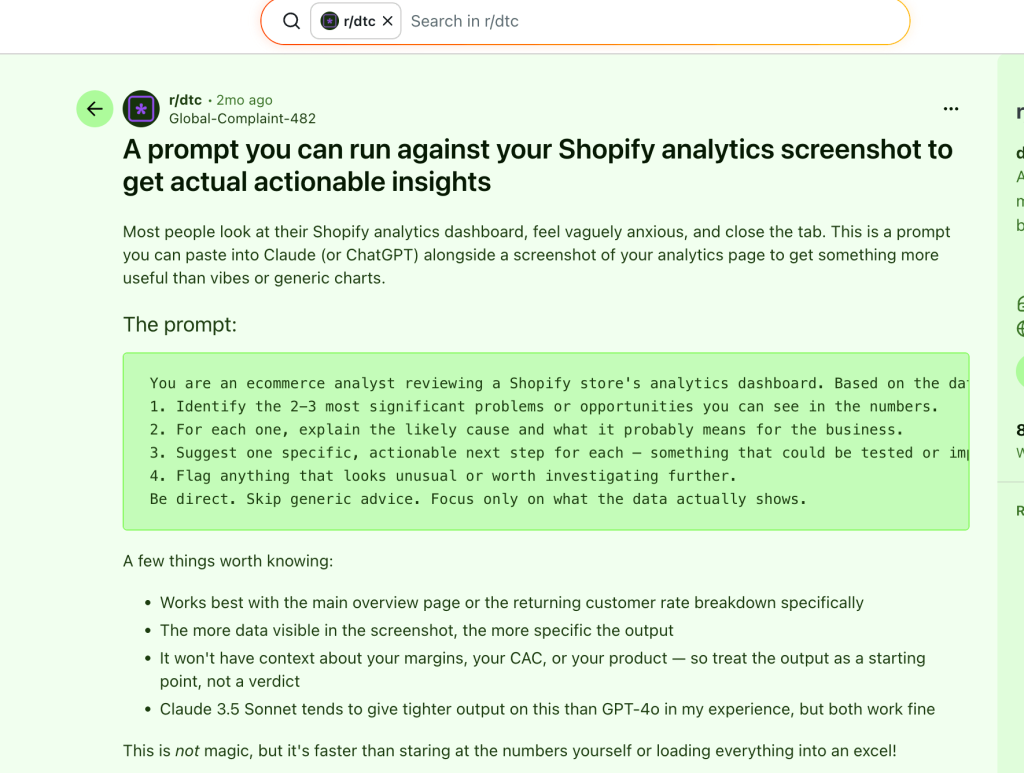
“Most people look at their Shopify analytics dashboard, feel vaguely anxious, and close the tab. This is a prompt you can paste into Claude (or ChatGPT) alongside a screenshot of your analytics page to get something more useful than vibes or generic charts.” — Global-Complaint-482, r/dtc

The screenshot approach works, but it has two real limits.
- You’re stuck with whatever data is in the screenshot, so cross-source questions (“
did ROAS drop because of ad spend, email timing, or fulfillment?“) require a lot of static screenshots. - LLMs hallucinate numbers when they’re doing math on raw data. They’ll tell you a confident, wrong answer.
Coupler.io’s AI integrations fix both. Connect your data sources once, then ask questions across all of them. The Analytical Engine handles the math: when you ask a question, the AI translates it into SQL, Coupler.io runs the query against your actual data, and the AI receives verified numbers to interpret.

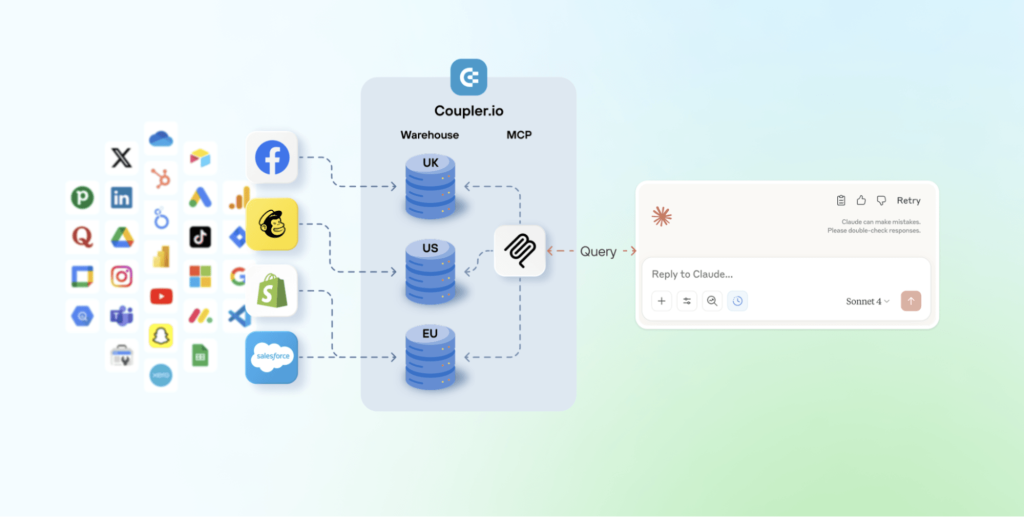
The AI explains, Coupler.io calculates. That’s what makes the answers reliable.
What it looks like
Set up a Shopify data connector in Coupler.io along with other apps and sources you want to analyze across multiple digital channels (GA4, Meta Ads, Google Ads, Klaviyo, TikTok, and 400+ others). Then connect Claude or ChatGPT as the data destination, and start asking questions:
- “
Which Klaviyo campaigns drove the most Shopify orders this month?“ - “
Compare my Google Ads ROAS to my Meta Ads ROAS over the last 90 days. Which is improving?“ - “
Did my ROAS drop last week because of ad spend, email timing, or a fulfillment issue?“ - “
Which TikTok and Instagram social media touchpoints are driving the most new customers this quarter?“ - “
Which influencer collaborations drove the highest ROAS last month, and which underperformed?“
You get instant answers on specific questions and can continue the conversation for granular insights.
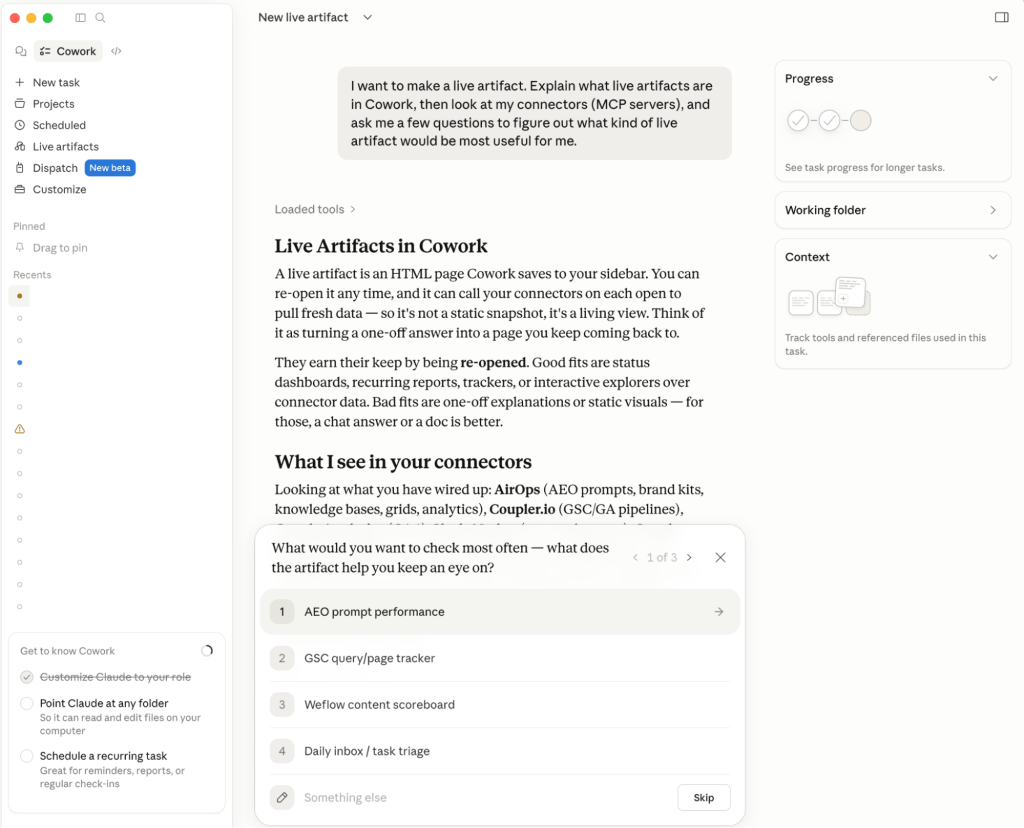
For a more visual option, Claude can build a live artifact: a mini ecommerce dashboard that pulls data from your connectors (Coupler.io included) and renders it as interactive charts inline in the conversation.

When it fits
Cross-source questions are where conversational analytics earns its place. Choose this path when:
- You want to interrogate your customer data daily or multiple times a day, not check a dashboard once a week
- Your DTC marketing strategy depends on fast answers (which campaigns to scale, which SKUs to push, where to shift spend)
- The questions you want answered span multiple tools (marketing + ops + finance + support)
- You already pay for Claude or ChatGPT and want more out of them
Tradeoffs
What you give up by trading dashboards for conversations:
- No sharable dashboard when using live artifacts: these live locally on your computer (they don’t follow you to another device), they’re not shareable yet (sharing is on Claude’s roadmap), and they use connectors without asking for permission each time, so think before connecting anything that can write or change data.
- Every analysis needs you to run it: Stakeholders who don’t use Claude or ChatGPT can’t pull insights themselves.
Ask DTC questions in Claude or ChatGPT with Coupler.io
Get started for freePath 3: BI dashboards using DTC analytics reports templates (Looker Studio, Google Sheets, Power BI)
This path is for DTC brands that want a real-time dashboard the whole team can view, without paying enterprise platform prices or waiting for an in-house data team. This is the classic data-driven setup, with ready-to-use ecommerce templates that get you reporting in an afternoon.
You need a tool to move data from your sources into a BI tool to turn numbers into charts. Coupler.io integrates 400+ business data sources with Data Studio, Power BI, and other destinations. Moreover, it provides predesigned ecommerce dashboard templates for Shopify, WooCommerce, and other sources.
What it looks like
You pick a destination (Google Data Studio, BigQuery, Power BI, etc.) and either start from a template or build your own dashboard.
Google Sheets is the most common starting point for DTC teams without a developer because it’s free, already part of most workflows, and easy to share with stakeholders who don’t use BI tools. The templates cover the most common DTC reporting needs:
- Shopify dashboard: orders, revenue, customer acquisition costs, top products
- Ecommerce KPI dashboard: Shopify + Klaviyo + ad platforms in one view
- Sales funnel dashboard: Shopify + GA4 customer journey
- Store performance dashboard: cross-source ecommerce metrics

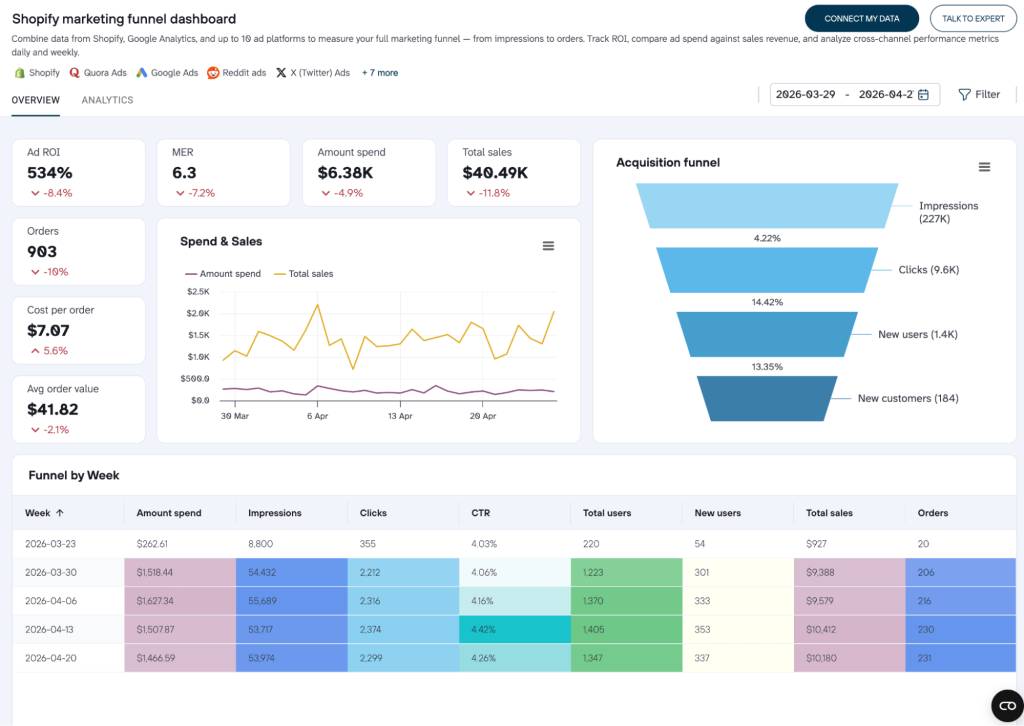
Coupler.io handles the data movement, the BI tool handles the visualization, and you own the schema. If a template doesn’t have a metric you need, you add it. If you want to combine three sources into a custom view, you do that.
When it fits
Choose BI dashboards when:
- You need real-time charts and tables stakeholders can open and read on their own
- Standard ecommerce KPIs (revenue, ROAS, customer acquisition costs, AOV, LTV, profit margins) cover most of your reporting
- You want to avoid the price tag of enterprise platforms and you don’t have a developer in-house
Tradeoffs
What you give up by going the BI route:
- You build the dashboards yourself or start from a template. Either way, the first setup takes a few hours
- BI tools show you what happened, not why. To dig deeper you still go back to Claude, ChatGPT, or your team
- Dashboards don’t ask follow-up questions. If a number looks off, you need to investigate manually
Note: Coupler.io’s AI Agent bridges the gap between static dashboards and conversational analytics. You can use it to ask questions about your data directly inside Coupler.io’s UI.
Path 4: Custom-coded DTC analytics dashboard (AI-built, warehouse-backed)
This path is for DTC brands that want a custom dashboard built around their exact business model, with metrics no off-the-shelf tool calculates the way they need. It used to mean hiring a data engineer.
In 2026, it means a few days with Claude Code or Cowork and a data warehouse.
This is the most setup of the four paths and the most flexible. You own the data layer, the schema, the dashboard, and the deployment. Whatever you can describe, the AI can build.
This is already showing up in public build examples. In April 2026, Tory Sigmond shared a Claude Code-built ecommerce dashboard for a DTC nut butter brand concept. The dashboard was designed around questions most DTC operators actually ask: “How is my revenue growing? How is LTV growing? Are my customers coming back? How many subscriptions are churning?”
She wrote that Claude Code spun up 9 parallel Python agents, generated 200,000+ lines of realistic ecommerce data, and finished the dashboard before lunch.

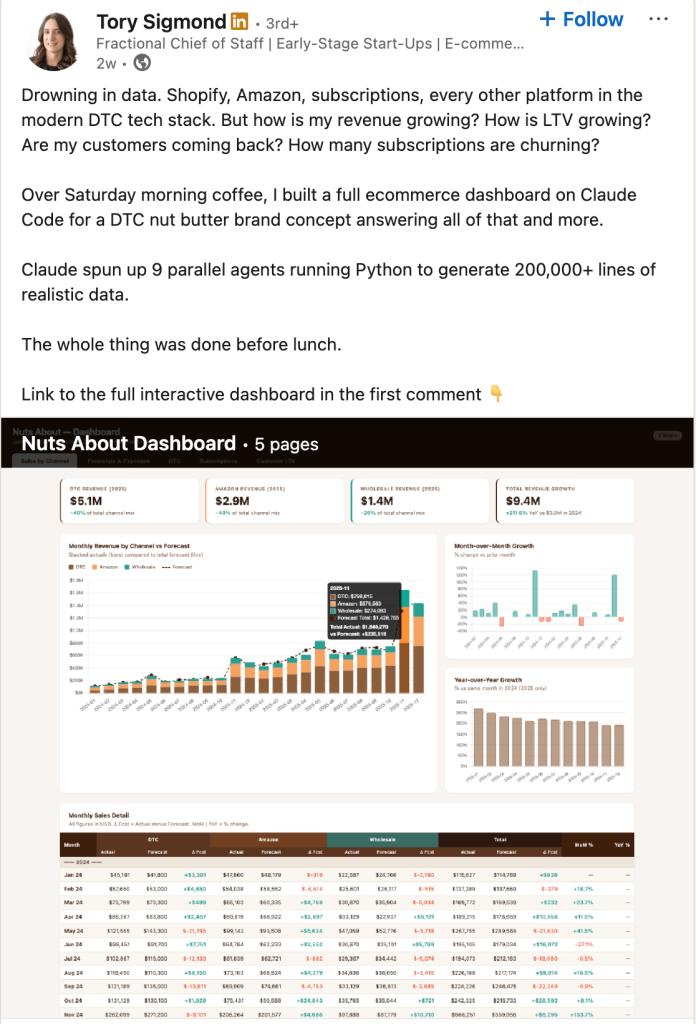
That is the new shape of the custom dashboard path. You own the data layer, the schema, the dashboard, and the deployment. AI can generate data models, write queries, build charts, create dashboard pages, and iterate on the interface.
What it looks like to run it live in the browser
The stack to build a live dashboard with Claude has three layers:
- Data layer: Coupler.io collects data from Shopify, GA4, Meta Ads, Google Ads, TikTok, Klaviyo, and other sources into a data warehouse on a schedule. Supabase (PostgreSQL) and BigQuery are the most common destinations because both are free to start.
- Build layer: Claude Code or Cowork builds the dashboard from your description. Next.js app, data tables, queries, charts, filters, custom metrics. You don’t write the code, you describe what you want and review what the AI builds.
- Host layer: Vercel or similar, free tier. Deploy the dashboard, share the link with your team.
The unlock is that you control every metric. Contribution margin by SKU after returns, LTV by acquisition cohort by channel, AI search referral revenue joined to Shopify orders, subscription churn cross-referenced with support tickets.
When it fits
Choose the vibe-coded path when:
- You have at least one DTC metric off-the-shelf tools don’t calculate the way your business defines it
- You want to combine marketing data with subscription, fulfillment, support, or finance data in one custom view
- You’re comfortable testing, iterating, and QAing AI-generated code, even if you don’t write it
- You want full control over the data model and dashboard, with no vendor in the middle
Tradeoffs
What you give up by going custom:
- The most setup of any path: A few days for a basic dashboard, longer for cross-team initiatives that span finance, ops, and marketing.
- You own the maintenance: When a data source’s API changes or a query breaks, it’s on you to fix it (with AI help).
- AI-generated code needs human review: You need to give precise instructions for how to use the data and which tables are needed for every chart, then verify the implementation is following your desired outcome.
Need help building a custom DTC analytics stack
Book a demoWhere DTC journey analytics is heading in 2026
Three shifts are happening at once. None of them replace dashboards entirely, but together they change how DTC brands actually work with their data.
From static dashboards to conversational analytics
Opening a dashboard every morning is getting replaced by asking Claude or ChatGPT what moved and why. The pace is faster, the questions more specific, and the answer comes with reasoning instead of a chart you have to interpret yourself.
Dashboards still matter for at-a-glance KPIs and stakeholder reporting. But the daily loop, the one where you’re trying to figure out what to do next, is moving to conversations inside LLMs.
From single-source dashboards to cross-source questions
The DTC questions that actually matter don’t live in one tool. “Why did ROAS drop this week” needs Meta + email timing + fulfillment. “Which SKUs are silently killing cash flow” joins Shopify + ad spend + returns + COGS.
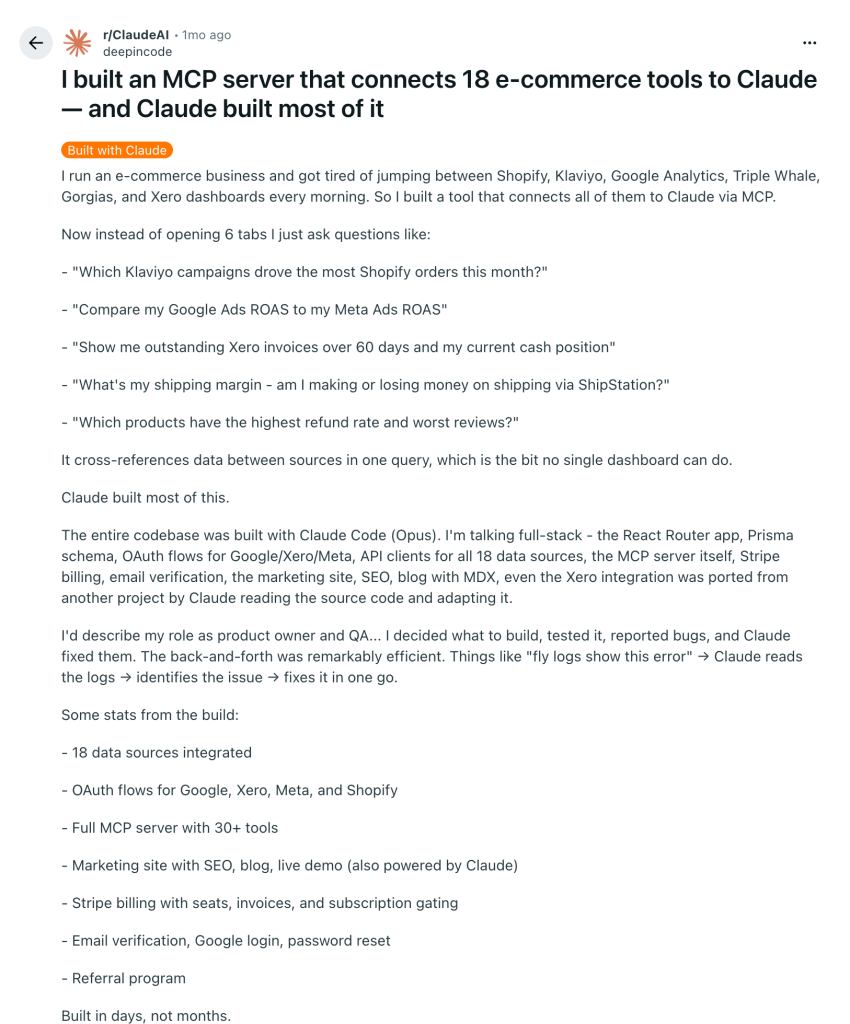
Off-the-shelf platforms unify marketing data well. The brands answering harder questions are doing it on their own data layer, with custom MCP servers, owned warehouses, or custom built reporting dashboards.

From read-only dashboards to agentic analytics
The next layer is scheduled AI runs that pull data, run analysis, and surface what changed without you asking. Claude pulls Monday’s data through Coupler.io, runs the cohort analysis, drops a Slack summary with three recommendations.
You react to insights, not raw numbers. Static dashboards become fewer and more specialized; AI watches the stream between check-ins.
Get DTC data from 400+ sources with Coupler.io
Get started for freeFAQ
Can I use Coupler.io alongside Triple Whale or Polar Analytics?
Yes, and many DTC brands do. The enterprise platform handles attribution and marketing reporting; Coupler.io handles the data pipeline for everything the platform doesn’t cover (subscription, fulfillment, support, finance, custom metrics). Both fit in the same stack without overlap.
Do I need a data warehouse for DTC analytics?
Not for most setups. If you’re using an enterprise DTC platform like Triple Whale, the vendor handles storage. Conversational analytics with Claude or ChatGPT works directly on data flows from Coupler.io. BI dashboards in Google Sheets or Looker Studio don’t need a warehouse either. You only need one if you’re building a custom dashboard with AI tools and want to run custom queries on top, in which case Supabase and BigQuery are both free to start.
How do I track AI search traffic to my Shopify store?
GA4 shows most AI search traffic into “direct” because LLMs strip referrer headers. To track it cleanly you need server-side tracking that detects AI referrer domains (chat.openai.com, claude.ai, perplexity.ai, gemini.google.com) and joins that to Shopify orders in your own data layer. Off-the-shelf DTC analytics platforms don’t do this automatically yet, which is why brands serious about AI search measurement build a custom dashboard on top of their own warehouse.
What’s the cheapest way to fix the GA4 vs Shopify data discrepancy?
Server-side tracking apps like Littledata or Analyzify start at $39 to $79/month and close most of the gap. For full reconciliation, combine server-side tracking with an owned data layer where Shopify’s source-of-truth orders sit alongside GA4’s behavioral data, so you can decide which number to trust for which decision.
Is AI-generated DTC analysis accurate enough to trust?
Only if the AI isn’t doing the math. LLMs hallucinate numbers when given raw datasets. Coupler.io’s Analytical Engine handles the calculations in SQL and returns verified numbers to the AI for interpretation: the AI explains, Coupler.io calculates. That’s the pattern that makes conversational analytics reliable enough to act on.