Your ETL pipeline takes almost an hour to run every morning, but the marketing team needs numbers ready in fifteen minutes. A slow pipeline means slow decisions. The gap only widens as you add more data sources and more reports.
ETL process optimization closes that gap with proven methods instead of guesswork. It means knowing which stage is slowing you down, and having the ETL process optimization techniques that win those minutes back. Along the way, you will see how Coupler.io handles extraction, transformation, and loading, so you can focus on analysis.
What is ETL process optimization?
ETL process optimization means improving how data is extracted, transformed, and loaded so the pipeline runs faster, costs less, and stays reliable.
The three letters stand for Extract, Transform, and Load. These are the stages that move raw data from your business tools into the reports your team actually reads. Optimization touches all these three, and the work tends to fall into three areas.
| Area | What it covers |
| Technical tuning | Work inside the pipeline: Incremental extraction, predicate pushdown, join key selection, indexing, caching, partitioning, resource allocation, and parallel processing. |
| Architecture | Structural choices: ETL or ELT, batch or streaming, landing data in a lake versus a warehouse, and staging layers that isolate failures. |
| Operation | Day to day running: Orchestration and scheduling, monitoring and alerting, and benchmarking runtime. |
Weigh every tuning, big or small, against speed, cost, data quality, and the maintenance effort. Something that wins on one and loses badly on another is a trade you have not priced yet.
ETL in a business scenario
What is ETL process example? A good way to answer is to walk through one.
Say your business sells on Shopify and runs ads on Meta and Google. The store holds orders and revenue, and the ad platforms hold spend. True return on ad spend only becomes clear once all three numbers land in one place.
- Extract pulls orders and spends from the three platforms.
- Transform lines up the data by date and campaign.
- Load drops the combined data into a dashboard.
A manual pipeline means doing all of that by hand. Every refresh means exporting CSV files from each platform and renaming dozens of columns. You repeat the same cleanup steps each time, and that repetition invites new mistakes. When a platform changes a field name or format, the whole report breaks.
Automation removes those manual steps and the errors that come with them.
Automated pipeline optimization
Coupler.io is a no-code data integration and AI analytics platform that handles extraction, transformation, and loading in one place. The platform connects to 400+ cloud sources and maintains these connectors for you. So when a source releases a new API version, your data flow keeps running instead of breaking.
The transformation part of ETL in Coupler.io lives at the stage when you organize your dataset. You set up filters, renames, joins, and aggregations once, and the same logic runs every time. That includes blending data from different sources into a single dataset. Orders from Shopify and spend from Meta and Google end up in one table with matched dates, not three separate exports.

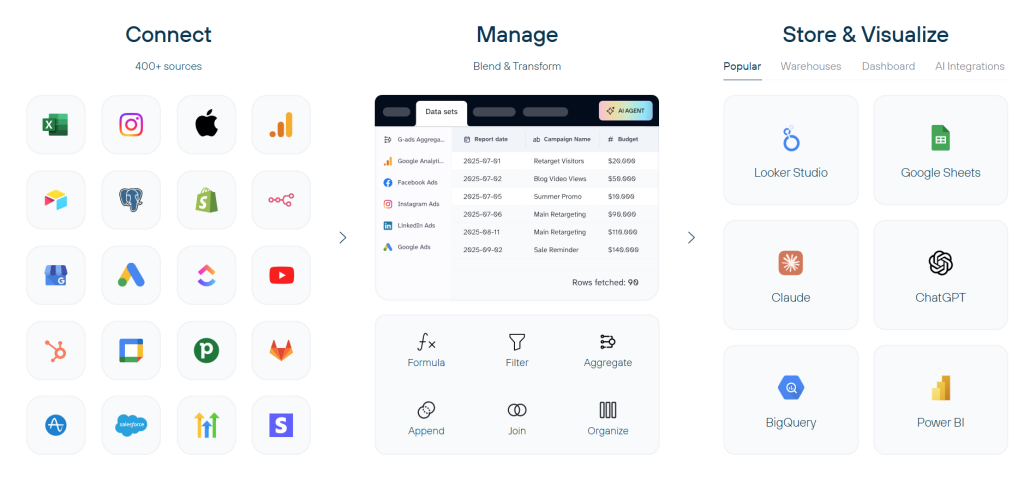
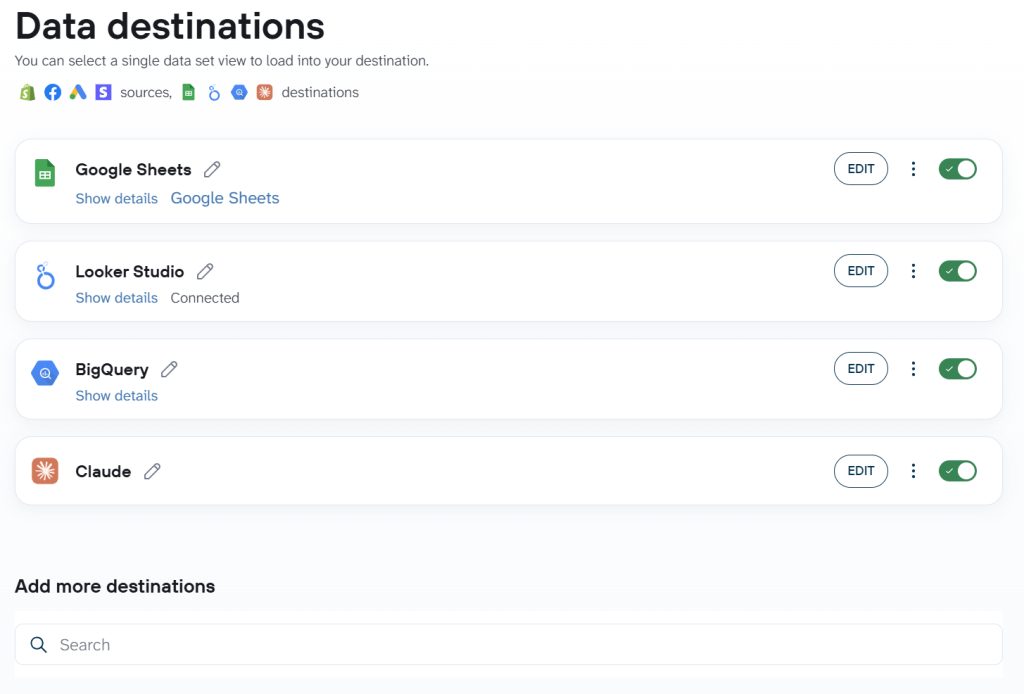
The finished data lands wherever you need it, whether that is a spreadsheet, a data warehouse like BigQuery or Snowflake, or a business intelligence tool such as Google Data Studio or Power BI. A single flow can load the same data into more than one destination at once. A team that needs numbers in Google Sheets for quick access and BigQuery for deeper analysis gets both from one pipeline run, which will refresh as often as every 15 minutes.
With Coupler.io, set the flow up once and your team can optimize ETL without hiring a data engineer.
What optimization actually saves
So, what is ETL process optimization actually worth? Usually, the answer is time your team can save.
ClaritySeed is a performance marketing agency that handles reporting for multiple clients. Before automation, the team copy-pasted data by hand and leaned on BI and engineering teams just to keep daily client reports current. The work drained hours and put client deadlines at risk.

They set up Coupler.io to pull data from Google Analytics 4, Facebook Ads, and Google Ads into Google Sheets. Setup was a one-time job. After that, the reports auto-populate daily with no manual pulls.
The change paid off fast. ClaritySeed got back over 10 hours a week that used to go to manual data transfers. That adds up to more than 40 hours a month. Reports now land five hours earlier than before. With reporting on autopilot, the team spends that time on analysis and campaign decisions instead of moving data between platforms.


Automate your ETL pipeline with Coupler.io
Get started for freeWhat are the steps of the ETL process and where bottlenecks form?
Naming what are the steps of ETL process is the easy part. Knowing which one is eating your runtime is harder, because each step creates its own kind of ETL bottleneck.
Here is where those bottlenecks tend to form in extract, transform, and load.
Extract
Extraction moves raw data out of a source and into your pipeline. Sources include your CRM, ad accounts, accounting software, a production database, or a data lake.
Three things commonly slow data extraction down.
- API rate limits. Most platforms limit how many requests you can send per minute. If you send too many too fast, the platform might block or slow you down.
- Full pulls. Most historical records do not change between runs. Fetching all of them every time burns bandwidth for nothing.
- Network latency. Every round trip to a remote API costs time. Many small requests usually cost more than a few larger ones.
How to optimize data extraction:
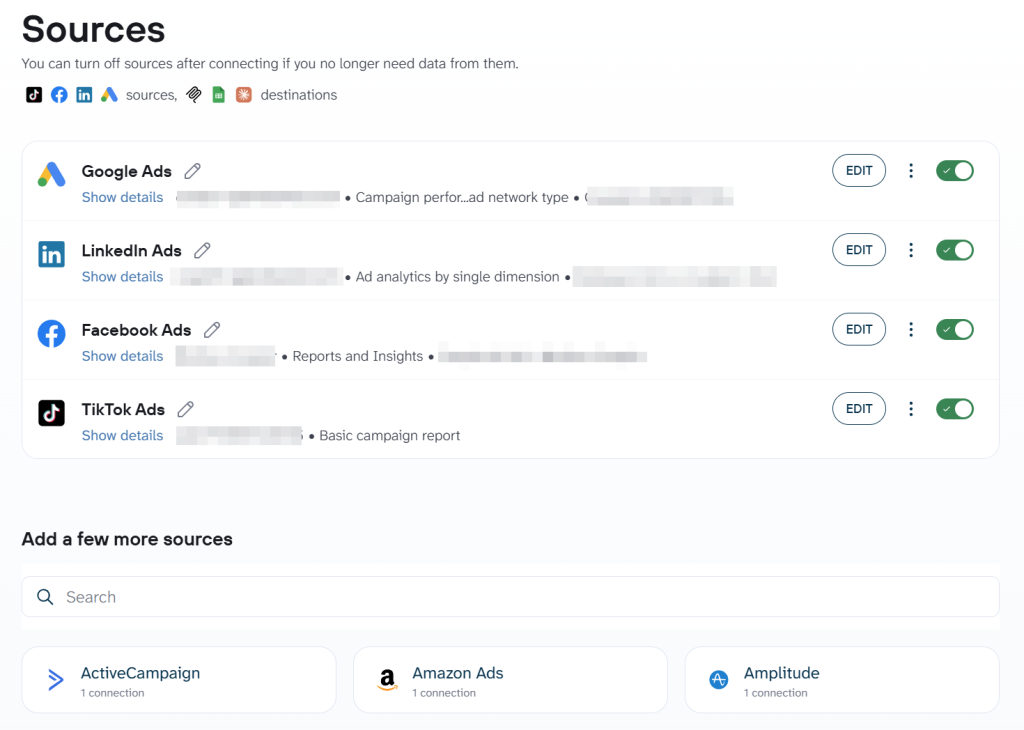
- Pull only what changed. Incremental extraction uses a watermark, usually a last-updated timestamp, and asks the source only for rows newer than that mark. Coupler.io does this through incremental fetching, available on major marketing and analytics sources including GA4, Google Search Console, Facebook Ads, LinkedIn Ads, and TikTok Ads.

- Use change data capture for databases. CDC reads the database transaction log and picks up inserts, updates, and deletes as they happen. It is the standard approach for data replication out of production systems. Debezium is the common open-source option. Fivetran builds it into its database connectors, and AWS Database Migration Service runs it as an ongoing replication task.
- Take only the columns you need. A table with 80 columns where your report uses 12 is mostly waste on every run.
- Push filters to the source. Ask for the last 30 days of orders and the source sends 30 days, instead of you pulling three years and throwing most of it away. In a connector, that means setting a date range or a status filter.In a database, this is called predicate pushdown, where the filter runs as the data is read.
Transform
Transformation cleans and reshapes raw data. Typical work includes renaming columns, filtering rows, joining tables, and aggregating totals.
Bottlenecks grow along with your transformation logic.
- Large joins. Joining large tables takes time, and it takes even longer if you use the wrong key to match them.
- Calculation at the wrong grain. Say you total spend per campaign, but apply the formula to every order row. With 10,000 orders across 20 campaigns, it runs 10,000 times instead of 20, and every order in a campaign gets the same answer anyway.
- Format mismatches. One platform sends dates as text, another sends timestamps. Your logic now handles both, on every row, on every run.
How to optimize data transformation:
- Filter early, transform late. Cut rows and columns before the expensive work starts, not after it.
- Replace row-by-row processing with set-based operations. Databases are built to work on whole columns at once. Looping through records one at a time gives up that advantage entirely.
- Push heavy work to the warehouse. This is the ELT pattern, common in modern data warehousing, where you load raw data first and reshape it using the warehouse’s own compute.
- Cache expensive lookups. If a currency table or campaign mapping gets read repeatedly, caching it saves the repeat trips.
- Check your indexing. In a database like PostgreSQL, an index on the columns you join and filter on can turn a full table scan into an index seek, which reads only the rows it needs.
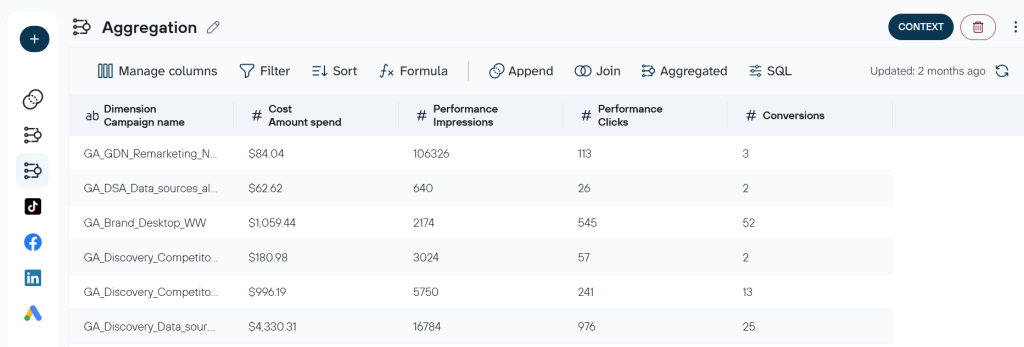
If you transform inside Coupler.io, filtering and column selection are usually just settings in the flow rather than something you write. Joins between sources work the same way. If you blend Shopify orders with ad spend data, Coupler.io matches them on the key you pick and handles the join as part of the flow.

Load
The load step writes transformed data into its destination, whether that is a spreadsheet, a dashboard, or a data warehouse.
Bottlenecks here usually come down to how much you rewrite.
- Full overwrites. A truncate and reload of the whole table when 200 rows changed is slow, and it raises the risk of a half-finished load.
- Destination limits. Spreadsheets slow down past a certain row count. Warehouses queue writes when too many jobs land at once.
- Row-by-row inserts. Sending one record at a time instead of batching them is a common and easy-to-fix cause of a slow load.
How to optimize data loading:
- Use incremental loads. Append new records, or upsert them with a MERGE so existing rows update in place instead of the whole table being replaced.
- Bulk load instead of inserting one row at a time. Warehouses ingest staged files far faster than individual statements, especially in a compressed format like Parquet or Avro. This is also how data typically lands in a data lake, staged in one of those formats rather than raw CSV or JSON, ready for the warehouse to load in bulk from there.
- Partition target tables by date or region. Queries then read only the partitions they need, a behavior called partition pruning, and each load touches one partition instead of the whole table.
- Lean on parallel processing. Several regions or tables loading at once uses the parallelism your warehouse already offers.
Most pipelines carry more than one of these ETL bottlenecks at the same time. Knowing they exist is not the same as knowing which one is costing you the morning. That is what measurement answers.
In Coupler.io, the same flow can write to multiple destinations in parallel, so adding a second output does not double your load time.

Build a multi-source reporting pipeline for your team
Book a demo with Coupler.ioETL performance tuning step-by-step
Effective ETL performance tuning starts with knowing exactly where the time goes. Optimizing ETL without that is guesswork.
Performance metrics worth tracking
| Metric | What it tells you | Example |
| Execution time | Total runtime, plus the duration of each stage | 42 minutes total, 28 in Transform, etc. |
| Resource utilization | What that speed costs in CPU, memory, disk, and network | Runs on 4 GB memory, 2 CPU cores |
| Throughput | How much data moves per unit of time | 40,000 rows per minute |
| Reliability | How often runs finish, and how often they fail | 29 of 30 runs completed |
Execution time is the metric most teams care about first. And that’s what this section focuses on measuring.
Step 1. Start with a baseline
A single measurement is unreliable, since system load, cache state, and network conditions can all shift the result from one run to the next. You need multiple rounds to account for that variability.
Industry best practice recommends at least 5 to 10 runs and uses the median, since one bad run cannot drag it around. The mean (average) shows you total time consumed once you multiply it by the number of runs, and most database profilers report it.
Here is a sample baseline, with all times in minutes.
| Stage | Run 1 | Run 2 | Run 3 | Run 4 | Run 5 | Median |
| Extract from Shopify, Meta Ads, and Google Ads | 8.9 | 9.4 | 8.6 | 12.1 | 9.1 | 9.1 |
| Transform with Join and Aggregate | 27.5 | 28.9 | 27.8 | 29.4 | 28.2 | 28.2 |
| Load into the dashboard | 4.6 | 4.9 | 4.4 | 5.2 | 4.7 | 4.7 |
| Total | 42 |
In Coupler.io, the run history on the Flow settings page already logs the timing of every refresh, with a row and a duration for each source, transformation, and destination. Here is what that looks like on a different flow, just to show the layout.

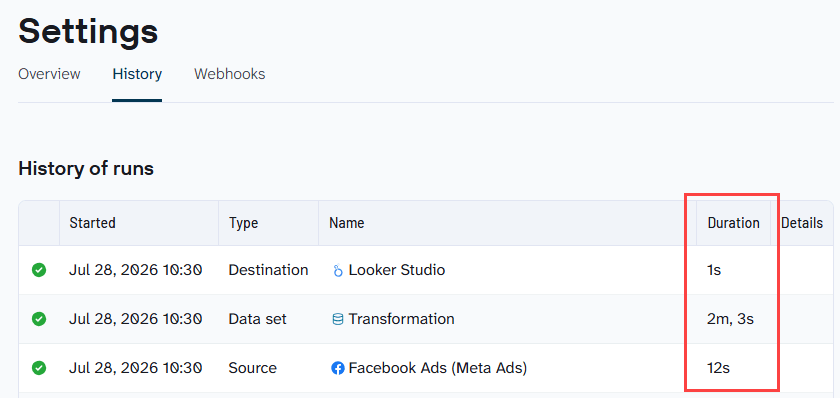
Figure 2. History of runs in Coupler.io
Pull the last five runs, and you have your data points for the median.
If you use a database or warehouse, many of them come with built-in profiling tools that track execution stats for you.
For example, in PostgreSQL, you can use pg_stat_statements to show the 10 queries consuming the most time overall, how many times each one ran, and their average duration in milliseconds.
SELECT query, calls, mean_exec_time, total_exec_time
FROM pg_stat_statements
ORDER BY total_exec_time DESC
LIMIT 10;
However you collect it, create a baseline first. Every decision you make to optimize ETL process performance rests on it.
Explore our list of PostgreSQL ETL tools.
Step 2. Find the slow stage
The Transform row carries the biggest numbers in the baseline table. It takes up about two thirds of total runtime, while Extract and Load barely add up next to it. That makes fixing the Transform process is where optimizing ETL pipelines has to start.
If you transform inside Coupler.io, open the Dataset page and check how you’ve set up each transformation step

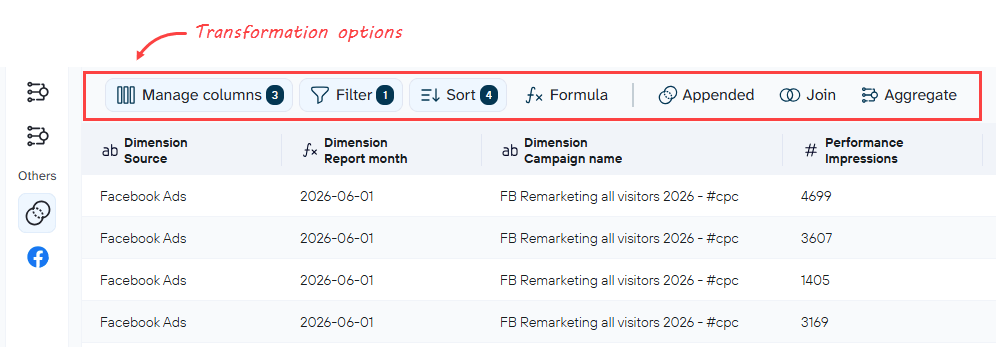
Things worth checking:
- Manage columns. Hide the columns you do not use. Fewer columns means less data moving through the flow.
- Filter. Keep only the rows your report needs. Cutting 200,000 rows down to 80,000 means every other step works with a fraction of the data.
- Join. Confirm you are joining on a clean key, ideally an ID rather than a text field, with matching data types on both sides.
- Sort. Sorting a large dataset is expensive, and most dashboards sort on their own. Leave it out unless the destination needs it.
If you transform with SQL instead, the same idea applies. Look for anything that makes your query handle more rows and columns than it needs to. Joins on large unfiltered tables are worth a look too, though most databases optimize some of this for you.
Beyond that, check the performance tuning guide for whichever database you use. Each one optimizes queries differently.
Step 3. Apply a fix and check it against your baseline
Change one thing at a time. If you change three things at once and the run gets faster, you will not know which change actually helped, and you will be stuck defending two changes you cannot explain later.
Apply one fix, run the pipeline five more times, and compare the new median to your baseline. Optimization of ETL process is a loop of small proven changes, not one big rewrite.
| Stage | Baseline median | After fixing the join key | Change |
|---|---|---|---|
| Extract | 9.1 | 9.1 | No change |
| Transform | 28.2 | 11.4 | 16.8 minutes faster |
| Load | 4.7 | 4.7 | No change |
| Total | 42.0 | 25.2 | 40% faster |
That is real progress, but you still have not hit the 15 minute target. When that happens, apply the next fix and check the new result against your baseline. Repeat until the pipeline runs as fast as you need.
Keep this three step cycle for whenever ETL performance drifts again. Set a baseline, find the slow stage, then change one thing and check it. Use the new numbers as your baseline and repeat.
Real-time ETL and monitoring for continuous optimization
Batch pipelines run on a schedule, once an hour or once a day. Real-time ETL moves data the moment it changes. This way, a new order or ad click shows up in seconds instead of at the next scheduled run.
When real-time ETL is worth it
True real-time fits cases where a delay costs money right away, like stock trading, fraud checks, or live stock levels during a flash sale.
In those cases, data that is 10 minutes old is already too late to act on.
Most business teams sit below that line, and that is perfectly fine.
- A marketing team works off a daily refresh. Conversions keep settling for a day or more after the click, so hourly pulls just deliver an unfinished number sooner. Learn more about marketing ETL.
- An ecommerce team checks sales by product and channel daily, then moves hourly during a launch or a big sale.
- A monthly finance report needs none of this.
The goal is matching your refresh frequency to how often people actually look at the data. That is really how to optimize ETL pipeline when it comes to scheduling.
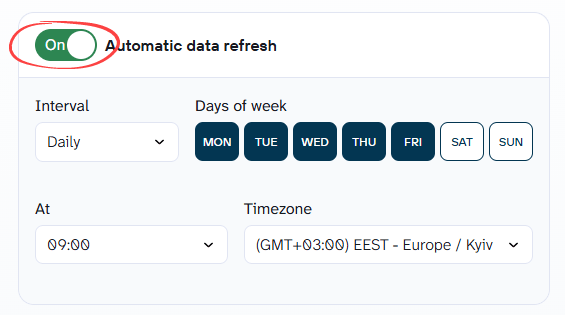
In Coupler.io, you can set up the schedule in Flow settings, with intervals from monthly down to every 15 minutes. That is fresh enough for most decisions a business team makes in a day.

ETL monitoring for continuous optimization
Broken pipelines are quiet. A dashboard fed by a dead flow still loads and still looks right, so people keep deciding on numbers that stopped updating on Tuesday.
Good ETL monitoring tracks these things.
- Total runtime. How long the full run took, and each stage separately.
- Run status. Whether the last run finished or failed, and which stage it stopped at.
- Row counts. How many rows actually landed.
- Error details. What broke and where. A source timeout, an expired login, and a bad transformation step all need different fixes, so a bare failure notice gets you nowhere.
Coupler.io logs status and duration for every run, and outgoing webhooks can pass success or failure to whatever system you point them at, from Slack to a ticket queue.
What monitoring and observability gives you is a reason to look. From there, the baseline-and-fix loop from the tuning section is how you improve ETL performance steadily.
Speed up your data pipeline with Coupler.io
Get started for freeETL optimization tools
A few of these have already come up. Here they are sorted into three groups.
1: ETL/ELT tools
These tools move data from source to destination and also have capabilities to do data transformation.
- Coupler.io is the no-code option for business teams. It connects 400+ apps, cleans and blends the data without you writing any code, and loads it into spreadsheets, warehouses, or BI tools on a schedule.
Once your flows are running, the built-in AI Agent lets you ask questions about your data in plain language. Ask it something like, “Compare Meta and Google return on ad spend last month against the month before, and tell me what changed.” You get an answer without building a new report.
You can also connect your data to Claude, ChatGPT, Perplexity, and other AI tools through Coupler.io’s AI Integrations and ask there instead. Before the AI answers, Coupler.io also passes three layers of context:- Data context teaches the AI what each column and metric means — that ‘CPC’ is cost per click in USD, not just a number.
- Business context adds your definitions and rules, like how you define an active customer or which orders to exclude from revenue.
- AI Agent Skills describe how to approach the analysis itself, so the AI follows your method every time instead of improvising.
That context is what turns a generic answer into one that matches how your team actually thinks about the numbers. Either way, the Analytical Engine runs the calculations, and the AI only interprets the results. That’s how the numbers stay verified instead of guessed and AI hallucinations go down.
- Fivetran serves engineering teams. It loads raw data into warehouses like Snowflake and BigQuery, and can run your dbt models there to transform it. When the source is a database, it can use change data capture (cdc) to pick up only the rows that changed.
- Airbyte is the open-source option, with hundreds of connectors and a no-code builder for making your own when a source is not covered.
- Enterprise ETL platforms like Microsoft SSIS, Azure Data Factory, and Informatica suit large companies with complex or mixed setups.
2: Data transformation and processing tools
These tools clean and reshape data once it lands in a database or warehouse. You might need one of these if your ETL tools cannot do the shaping you want.
- dbt transforms data inside your warehouse using SQL. It turns raw tables into clean, tested models your whole team can build on.
- Python with pandas is the standard for scripted cleaning when off-the-shelf tools fall short. Custom logic, odd formats, and one-off fixes usually end up here.
- Apache Spark takes over once the data outgrows one machine. It is built for terabyte-scale work, and PySpark lets your team write those jobs in the same Python they already use with pandas.
Often, data transformation is where ETL optimization pays off most, since joins and aggregations across large tables take up the biggest share of your runtime. Each tool gives you a different way to claw that time back, whether you rewrite a slow model in dbt, load only the columns you need in pandas, or spread the job across a cluster with Spark.
3: Measurement and monitoring tools
Which tools you need depends on where your pipeline actually runs.
- Your ETL tool’s run history covers the whole flow at a basic level, every stage, every run. Coupler.io logs it for each refresh. In a no-code setup, that is usually all you need, since the stages run together in one data flow rather than as separate jobs you can time on their own.
- A database or warehouse profiler goes deeper and shows you which specific query is slow. Also use it if your data lands in a warehouse and the heavy work happens in SQL.
- Snowflake has Query Profile.
- BigQuery exposes execution details through INFORMATION_SCHEMA views and Google Cloud Monitoring.
- PostgreSQL has pg_stat_statements.
- Infrastructure and APM tools such as Prometheus (and Grafana for displaying metrics), Datadog, and New Relic track resource utilization across services. They earn their place in distributed setups where a database profiler only sees part of the picture.
If you use an ETL tool, start with what it already gives you. Add a profiler only once you are writing SQL in a database and the run history stops telling you enough.
How to select your ETL optimization tools
Use these things to narrow down your choice of ETL optimization tools.
Technical skill on your team. This settles more than anything else. With no SQL or Python on the team, a no-code platform is the fit. It usually has a run history that gives you the measurement you need. With engineers, a warehouse setup opens up dbt for transformation and profilers for measurement.
Data volume. Under a few million rows a month, one tool usually covers everything. Above that, costs climb, since many tools charge by how much data you move. The work also tends to split, with a loader moving the data, a warehouse holding it, and a profiler telling you which query is slow.
Team size. A small or medium team usually does better with fewer tools. One platform that covers extract, transform, load, and scheduling means one thing to learn and one place to look when something breaks. Larger organizations can spread the work across several tools, since each one gets a dedicated owner who knows it well. One Coupler.io flow that loads into both a spreadsheet and a warehouse replaces what would otherwise be two separate pipelines to maintain.
Budget. Look at how you are charged, not just how much. Usage-based pricing grows with your data, which is easy to underestimate. Open-source tools have no license fee, but you cover hosting and upkeep. Fixed plans cost more upfront and are much easier to forecast.
Set up ETL for multiple sources and destinations
Get a demo from Coupler.ioETL process best practices
A pipeline that runs well today can slow down again in six months, once your data grows or a source changes. The real answer to how to improve ETL process results is not one big fix. It is a set of small habits that keep things running well in between.
Some of these ETL optimization techniques have already come up above. Here they are in short, so you do not have to scroll back.
- Automate first. You cannot speed up a manual step, only repeat it.
- Set a baseline before you change anything.
- Fix one thing at a time, so you know what worked.
- Drop rows and columns early, before the heavy work starts.
- Pull only new and updated records on each run.
- Refresh only as often as people use the data.
Beyond those, here are more best practices worth building into your pipeline.
- Log every run, not just the failures. Good ETL process management means saving how long each run took, how many rows moved, and where they landed. Failure logs only tell you what broke. A full history gives you something to compare against, so you notice a pipeline getting slower weeks before it breaks.
- Handle errors deliberately. Sources go down, tokens expire, and APIs change without notice. Decide in advance whether a step retries, and whether a failed run keeps the last good data instead of writing a half-finished load. Then send an alert that names both the stage and the reason.
- Protect data quality alongside speed. A fast pipeline that quietly drops 3 percent of rows is worse than a slow one. Validate as you load, compare row counts against the source, and make sure duplicates cannot slip in when a run repeats after an error.
That same discipline extends to AI. When your columns have clear definitions, your business rules are documented in the dataset context, and your analysis approaches are saved as Skills, the AI Agent delivers answers that match your team’s standards — not generic interpretations of raw numbers.
- Rerun your baseline quarterly. A setup that flies at 100,000 rows can struggle at 5 million. Joins that felt instant start to drag, and a destination that used to keep up starts falling behind. Catching the drift early keeps it a tuning job rather than a rebuild.
- Treat your pipeline like code. Version your configuration, review changes, and keep the ability to roll back. Configuration-driven setups scale far better than a folder of one-off scripts, which is why data engineering teams generate models from templates instead of copying SQL by hand.
If you’re ready to put these ETL process best practices into action without writing a script or managing infrastructure, try Coupler.io. It handles ETL process automation end to end, with extraction, transformation, loading, run history, and scheduling in one place to support most of what’s listed above. Once your data flows are running, the AI Agent can answer questions about your data directly with your metric definitions, business rules, and analysis instructions already built in. Or you can route the data to Claude ChatGPT and other AI Integrations.
See how much of this optimization work it can take off your plate.