
Facebook Ads reporting is limited. You can sort and filter by ad metrics, and the built-in visuals top out at basic bar graphs and trend lines. For anything deeper, you need the data somewhere else.
BigQuery is the most common destination for that job. It handles large volumes without slowing down, it speaks SQL, and it connects to every major BI tool. Once your Facebook Ads data lives there, you can blend it with other channels, run historical queries across years of spend, and point Looker Studio or Power BI at it without rebuilding anything.
This article covers four ways to get the data in, starting with the fastest.
The 4 methods, compared
The biggest differences come down to setup effort, refresh frequency, and whether you’ll maintain the pipeline yourself. Here’s how the four options compare.
| Coupler.io | Data Transfer Service | Manual CSV | Facebook Ads API | |
| Setup | Log in with Facebook | Developer app + token | Export/upload each time | Write & host code |
| Refresh | 15 min to monthly | Once daily | Manual | Custom |
Custom reports | Yes | No | / | Yes |
Cross-channel blend | Yes | No | No | If you build it |
Maintenance | None | Renew token every 60 days | Ongoing | Ongoing |
Best for | Marketers, agencies | Basic raw ingestion | One-off analysis | Engineering teams |
The rest of the article walks through each one.
Connect Facebook Ads to BigQuery through Coupler.io (no-code)
Coupler.io handles the full pipeline from Facebook Ads to BigQuery: connection, field selection, transformation, loading, and scheduled refresh. No Facebook Developer App, no code, no token maintenance.
Let Coupler AI do the data work for you
Tell Coupler AI what you need to know, from which source, and how often. It connects your account, sets up the data flow, keeps it refreshed, and lets you analyze the results inside Coupler.io or another AI tool.
Try for free
The steps below cover the manual configuration.
Step 1. Connect your Facebook Ads account
The connection method determines how much maintenance you will deal with later. Coupler.io authenticates through a Facebook login, so there is no Developer App to register and no long-lived access token to manage or renew.
Click Get started for free in the form below to proceed:

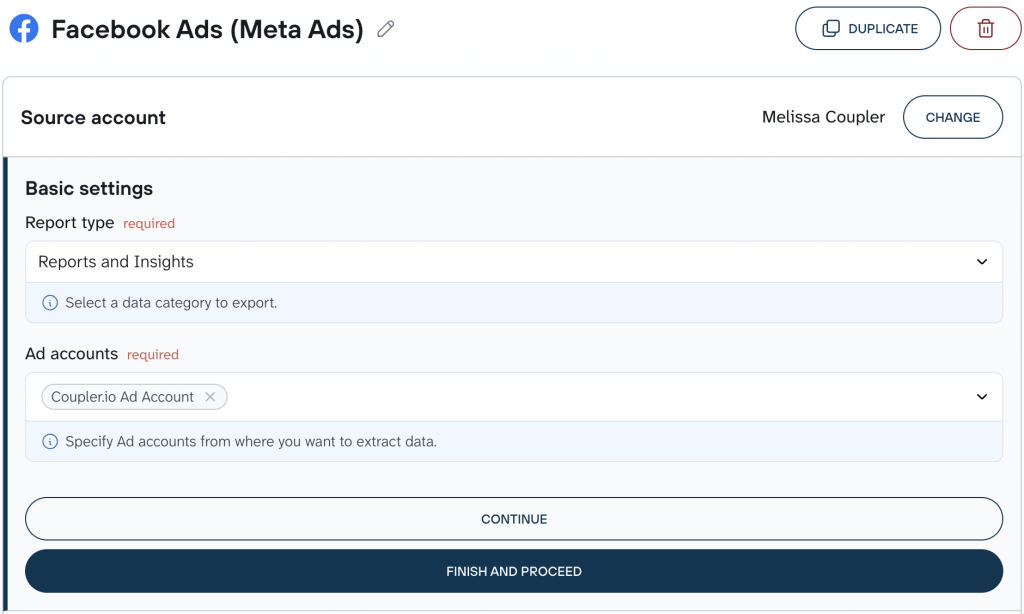
Then, select the report type and ad account you want to pull from.

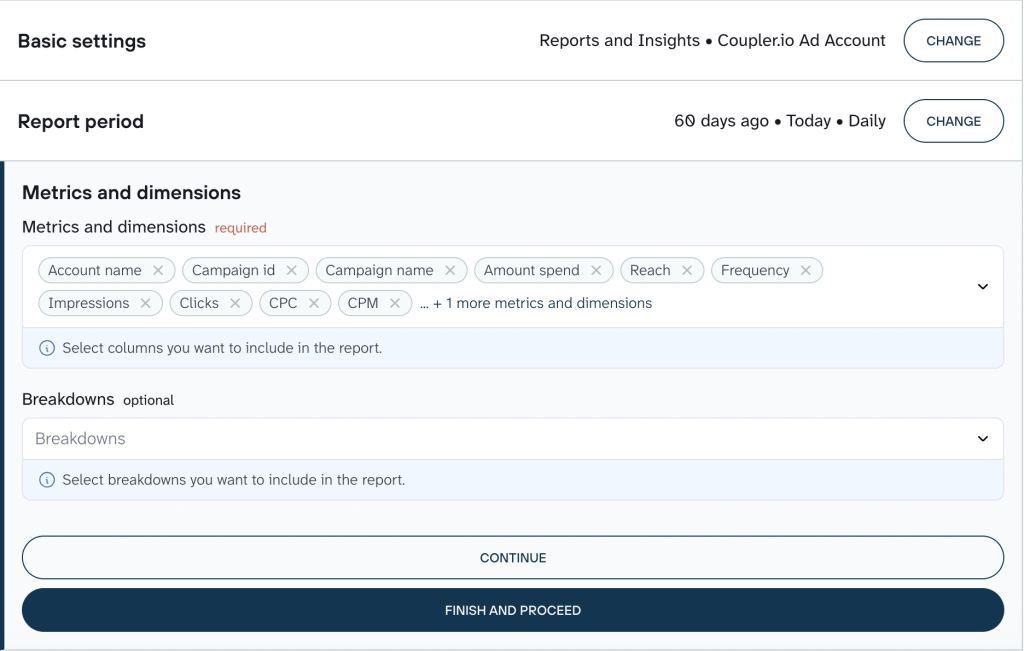
Set the reporting period and breakdown. If you chose the “Reports and insights” report type, you will also select which metrics and dimensions to include. The library covers numerous fields: impressions, spend, CPC, CTR, conversions, plus breakdowns by age, gender, country, device, and placement. Choose the fields that match the analysis you plan to run rather than pulling everything.

Configure attribution settings if needed, then move to the Transformations step.
You can add other sources to the same dataflow (Instagram Ads, Google Ads, GA4), so data from multiple channels lands in one BigQuery table without setting up separate pipelines.
Step 2. Organize and prepare the dataset
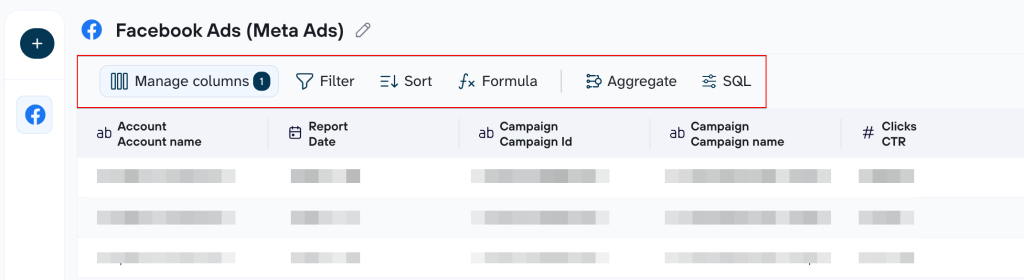
This is where you shape the raw Facebook Ads export before it reaches BigQuery. Every operation you set here runs automatically on each scheduled refresh, so you clean the data once and it stays clean.
Coupler.io gives you a preview table of the incoming data. From here you can:
- Hide, rename, or rearrange columns with drag-and-drop
- Add formula columns for calculated metrics (cost per conversion, ROAS)
- Filter and sort rows
- Aggregate data with sum, average, count, min, or max on specific columns
If you added other sources in Step 1 (Instagram Ads, Google Ads, GA4), this is also where you merge them into one dataset. The joined table lands in BigQuery as a single table ready for cross-channel queries.

Step 3. Load to BigQuery and schedule refresh
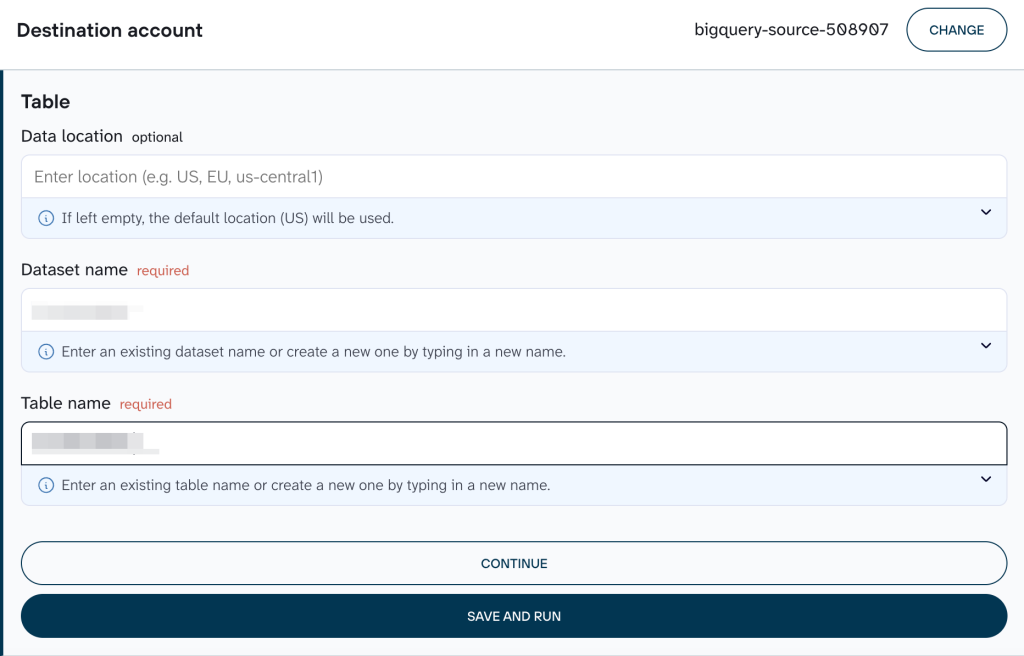
This step determines where the data lands in your BigQuery project and how often it updates. The field selection, filters, and transformations you set in the previous steps apply to every scheduled run automatically.
Connect your BigQuery account by generating a key file and uploading it. (Here is a guide if you need help with the key file.) Specify the dataset and table names, or enter new names to create them. Coupler.io can auto-detect the table schema, or you can define it manually.

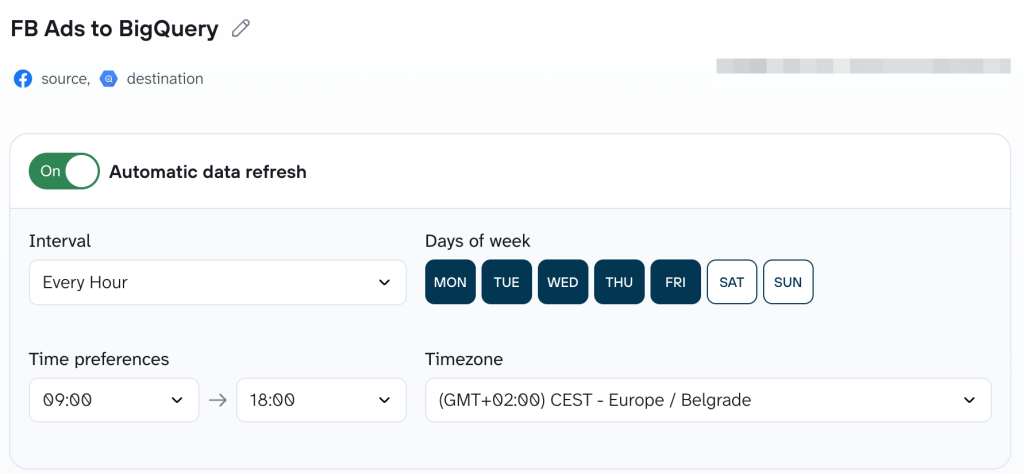
Set the refresh schedule: interval, days, time, and time zone.

Save and run the dataflow. From here, Coupler.io refreshes the data on that schedule with no manual re-exports.


Get Facebook Ads data into BigQuery on a schedule with Coupler.io
Get started for freeBonus step: Analyze your Facebook Ads data with AI
Once the dataflow is running on a schedule, your BigQuery table grows with every refresh. Instead of writing SQL for every question, you can query the dataset conversationally.
- Ask questions inside Coupler.io. Coupler.io’s AI Agent lets you query the Facebook Ads dataset directly. Ask “Which campaigns spent more than $500 last month with a CPC above $3?” and get a computed answer. The Analytical Engine runs the calculation against your data; the AI interprets and explains the result. You can also use the AI Agent to build or adjust dataflows through chat, so the pipeline itself is something you can modify conversationally.
Here is the deeper story on how it works: Coupler AI Agent: Conversational Data Analysis Inside Coupler.io
- In addition to BigQuery, send the dataset to Claude, ChatGPT, or another AI tool. AI Integrations make the same prepared dataset (with your transformations and schedule) available in the external AI tool you already work in. Supported tools include Claude, ChatGPT, Gemini, Perplexity, Cursor, Microsoft Copilot, and OpenClaw.
- Use a Skill for recurring analysis. Skills are pre-built analysis workflows you can apply to your data. The marketing analytics Skill handles common campaign performance questions out of the box.
A few prompts that work well with a Facebook Ads dataset:
- “Which campaigns had a rising CPC over the last four weeks? Show the trend.”
- “Break down spend vs. conversions by ad set for Q3. Flag anything with spend above $1,000 and zero conversions.”
- “Compare this month’s CTR by placement against the previous month.”
After the first answer, follow up. Ask “break that down by device” or “exclude paused campaigns.” The value of a connected dataset is that each follow-up builds on the last.
Why send Facebook Ads data to BigQuery with Coupler.io
Facebook Ads Manager caps out at basic sorting, filtering, and trend lines. Spreadsheets work for small exports but slow down as data grows and break when multiple people need different views. BigQuery removes both constraints, and Coupler.io removes the engineering work of getting data there.
- Your full ad history becomes queryable. BigQuery handles millions of rows without flinching, so you can run SQL across years of spend, spot seasonal patterns, or correlate CPC shifts with creative changes. Coupler.io keeps the table up-to-date on a schedule (as often as every 15 minutes), so the data is there when the question comes up.
- Cross-channel reporting happens in one table, not five exports. Add Google Ads, GA4, or CRM data as additional sources in the same Coupler.io dataflow. The joined table lands in BigQuery ready for cross-channel queries, no separate ETL pipeline for each source.
- The same data feeds every tool your team uses. Coupler.io can send Facebook Ads data to BigQuery, Looker Studio, Power BI, Google Sheets, Excel, and AI tools from the same flow. Your analyst queries BigQuery, your manager checks a Looker Studio dashboard, and your client gets a Google Sheets report, all from one pipeline.
- Plain-English questions get computed answers. Coupler.io’s AI Agent lets you query the same dataset conversationally. Ask “which campaigns had a rising CPC last month?” and get a result calculated from your data, not a guess. The Analytical Engine runs the math; the AI explains it.
- Dashboards populate themselves. Coupler.io includes ready-made dashboard templates for Facebook Ads in Looker Studio, Power BI, and Google Sheets. Connect your ad account, and the template fills with your data. No layout work, no formula wiring.
Automate Facebook Ads exports and ask questions of the data with Coupler.io
Start for freeReady-to-use Facebook Ads dashboard templates
If your goal is a visual report rather than a queryable warehouse, Coupler.io also offers dashboard templates that connect directly to your Facebook Ads account. Here are five that cover the most common reporting angles. For the full set, see the Facebook Ads dashboard gallery.
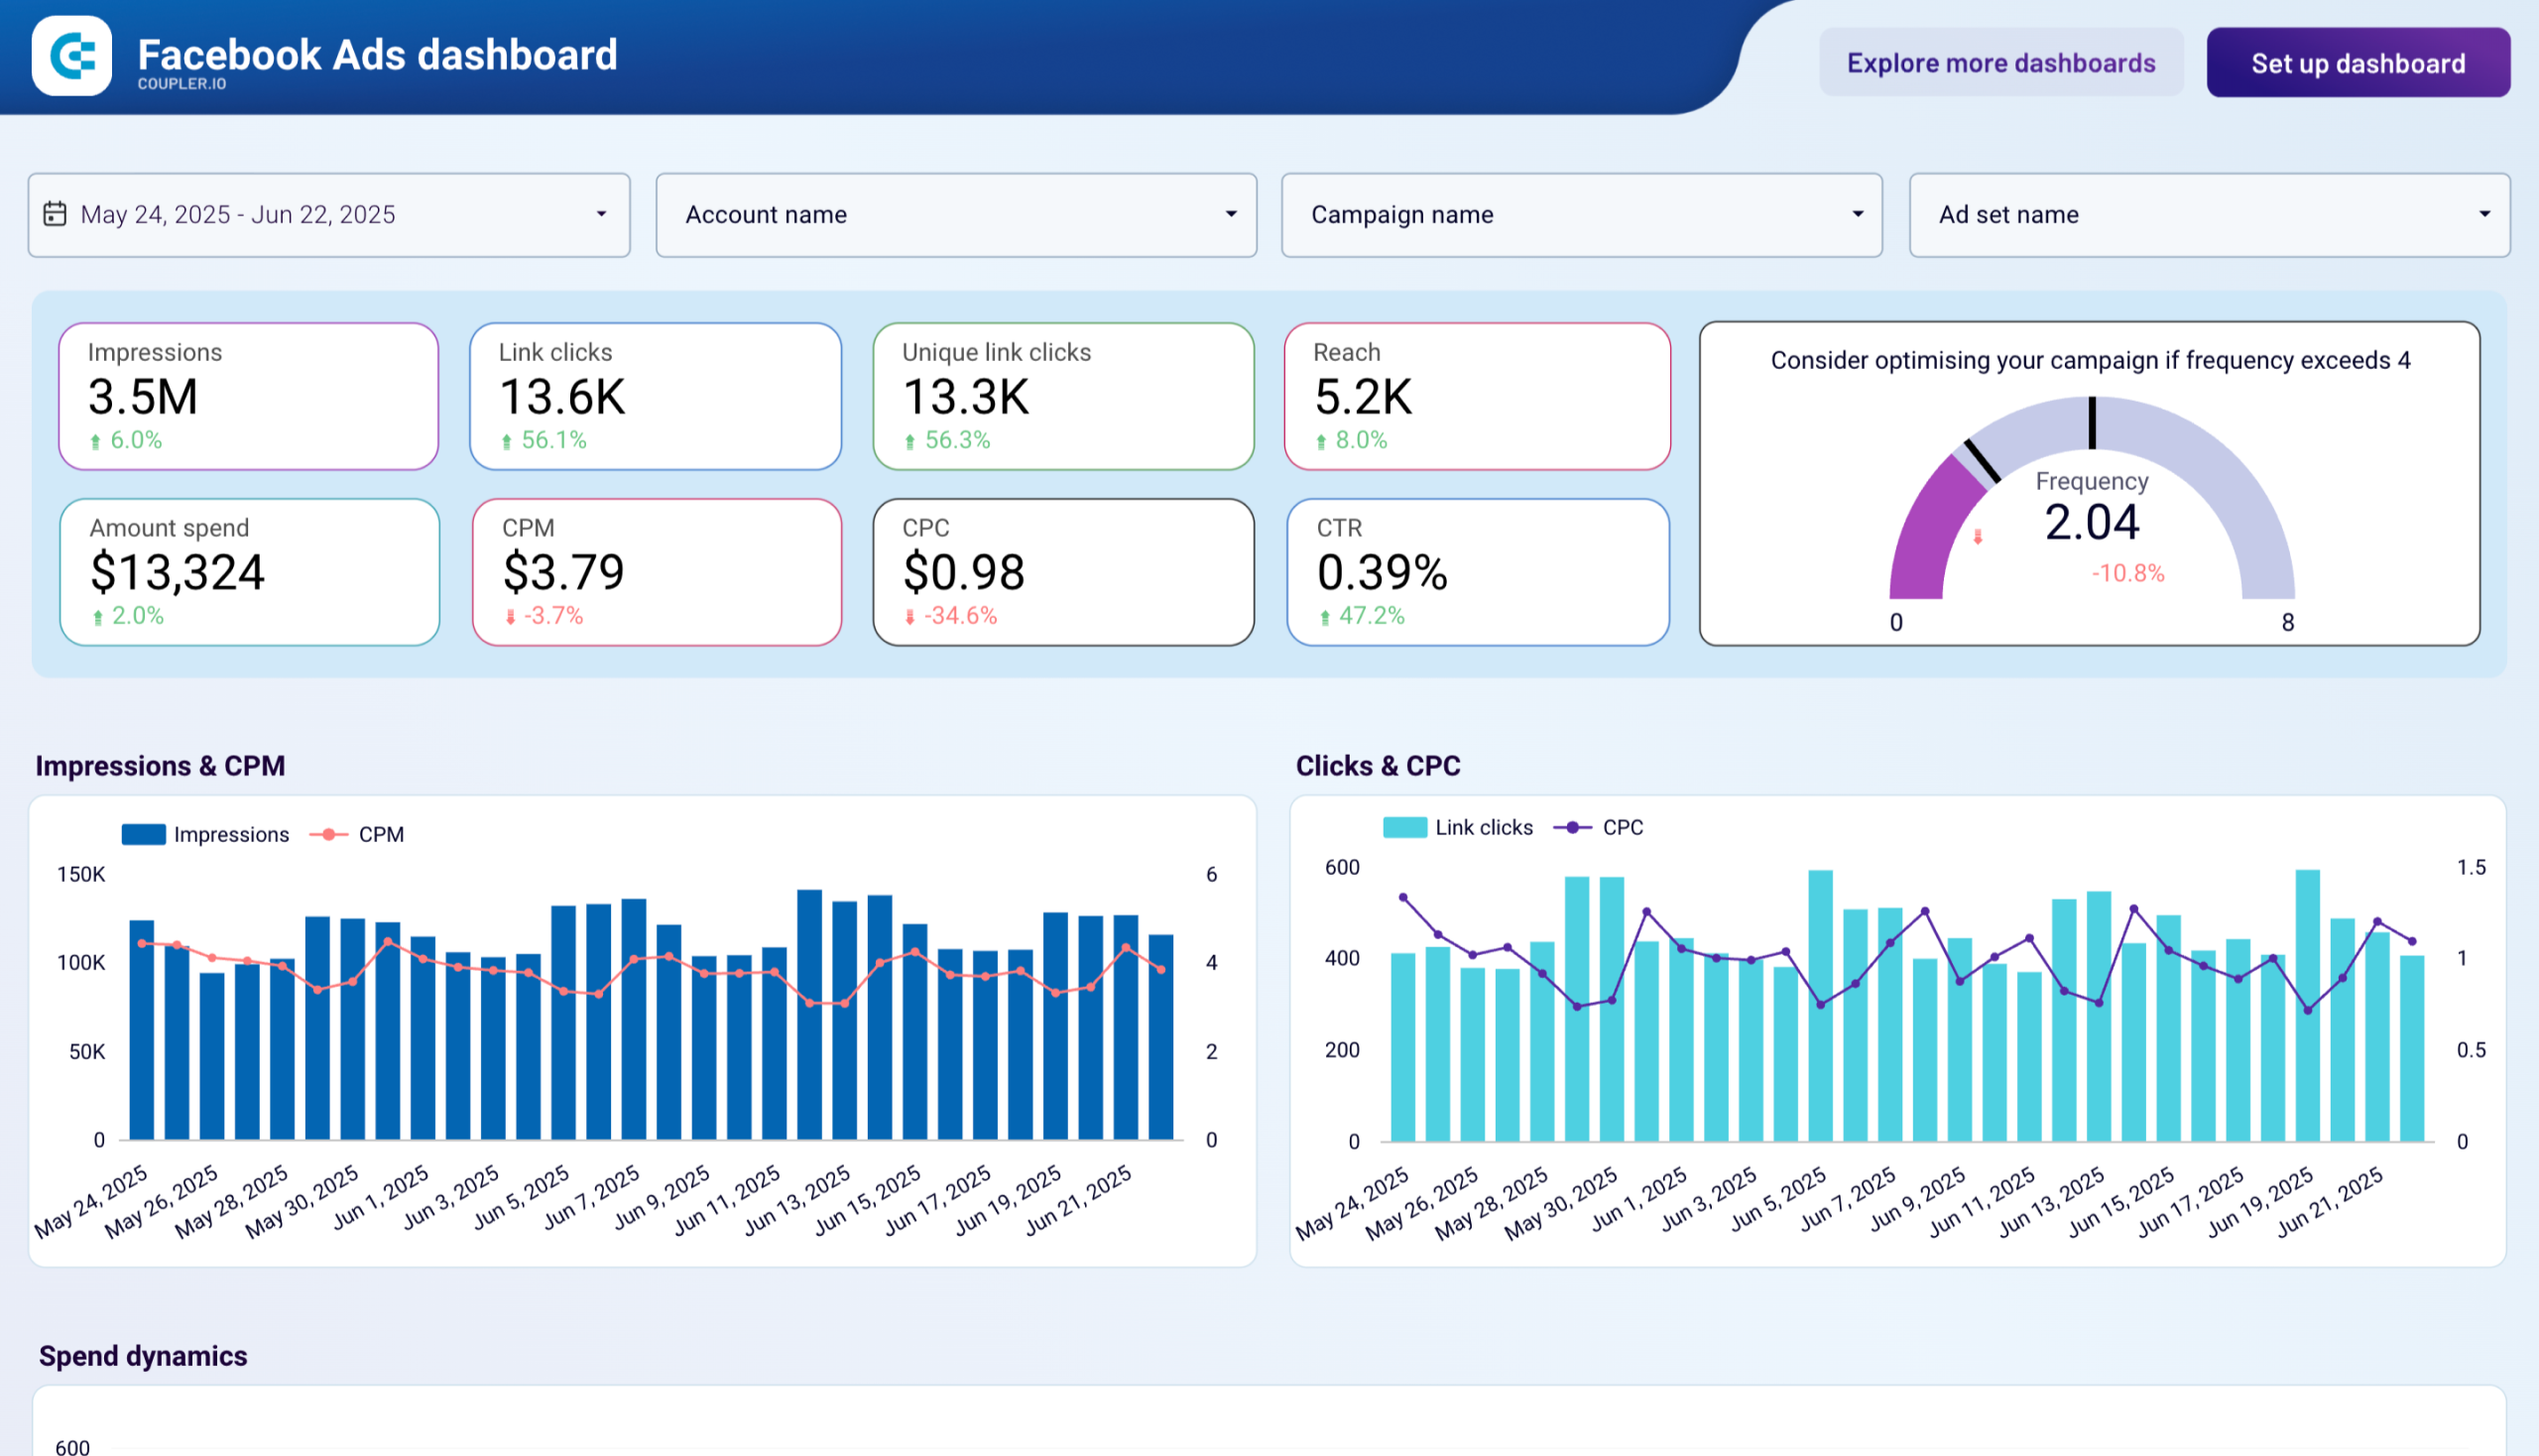
Facebook Ads campaign dashboard
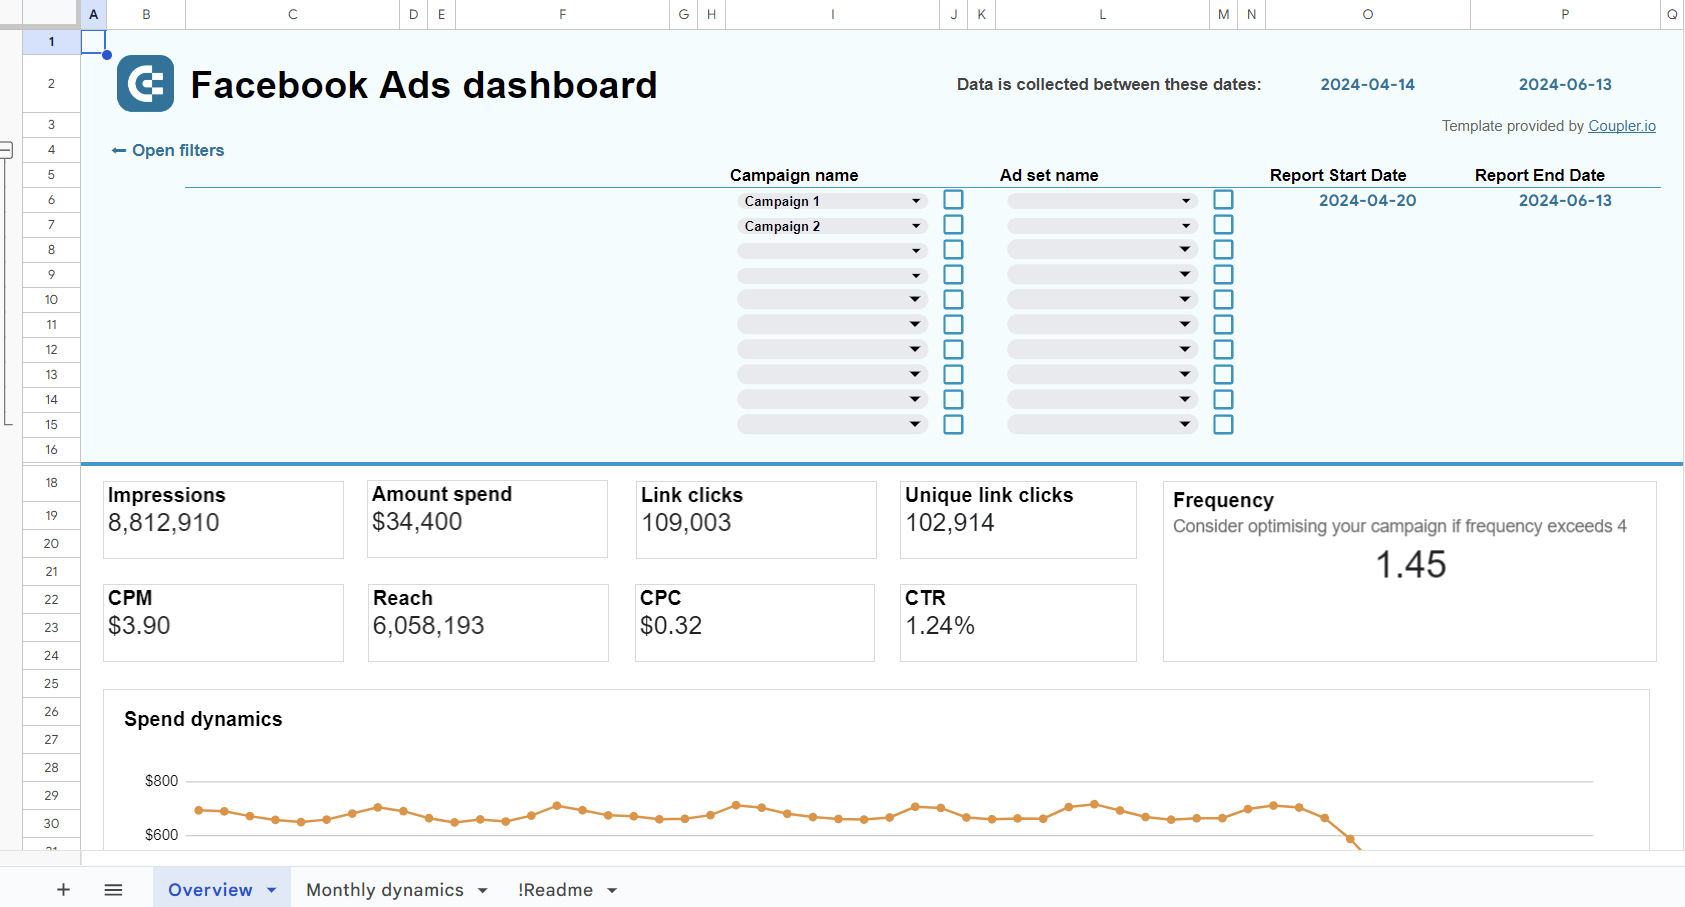
This template covers the performance layer most marketers check daily: spend, impressions, reach, clicks, CTR, CPC, and conversions, broken down by campaign and ad set. It also includes an ad frequency meter for spotting fatigue before it inflates your costs, demographic breakdowns by age and gender, and geographic distribution for regional budget decisions.

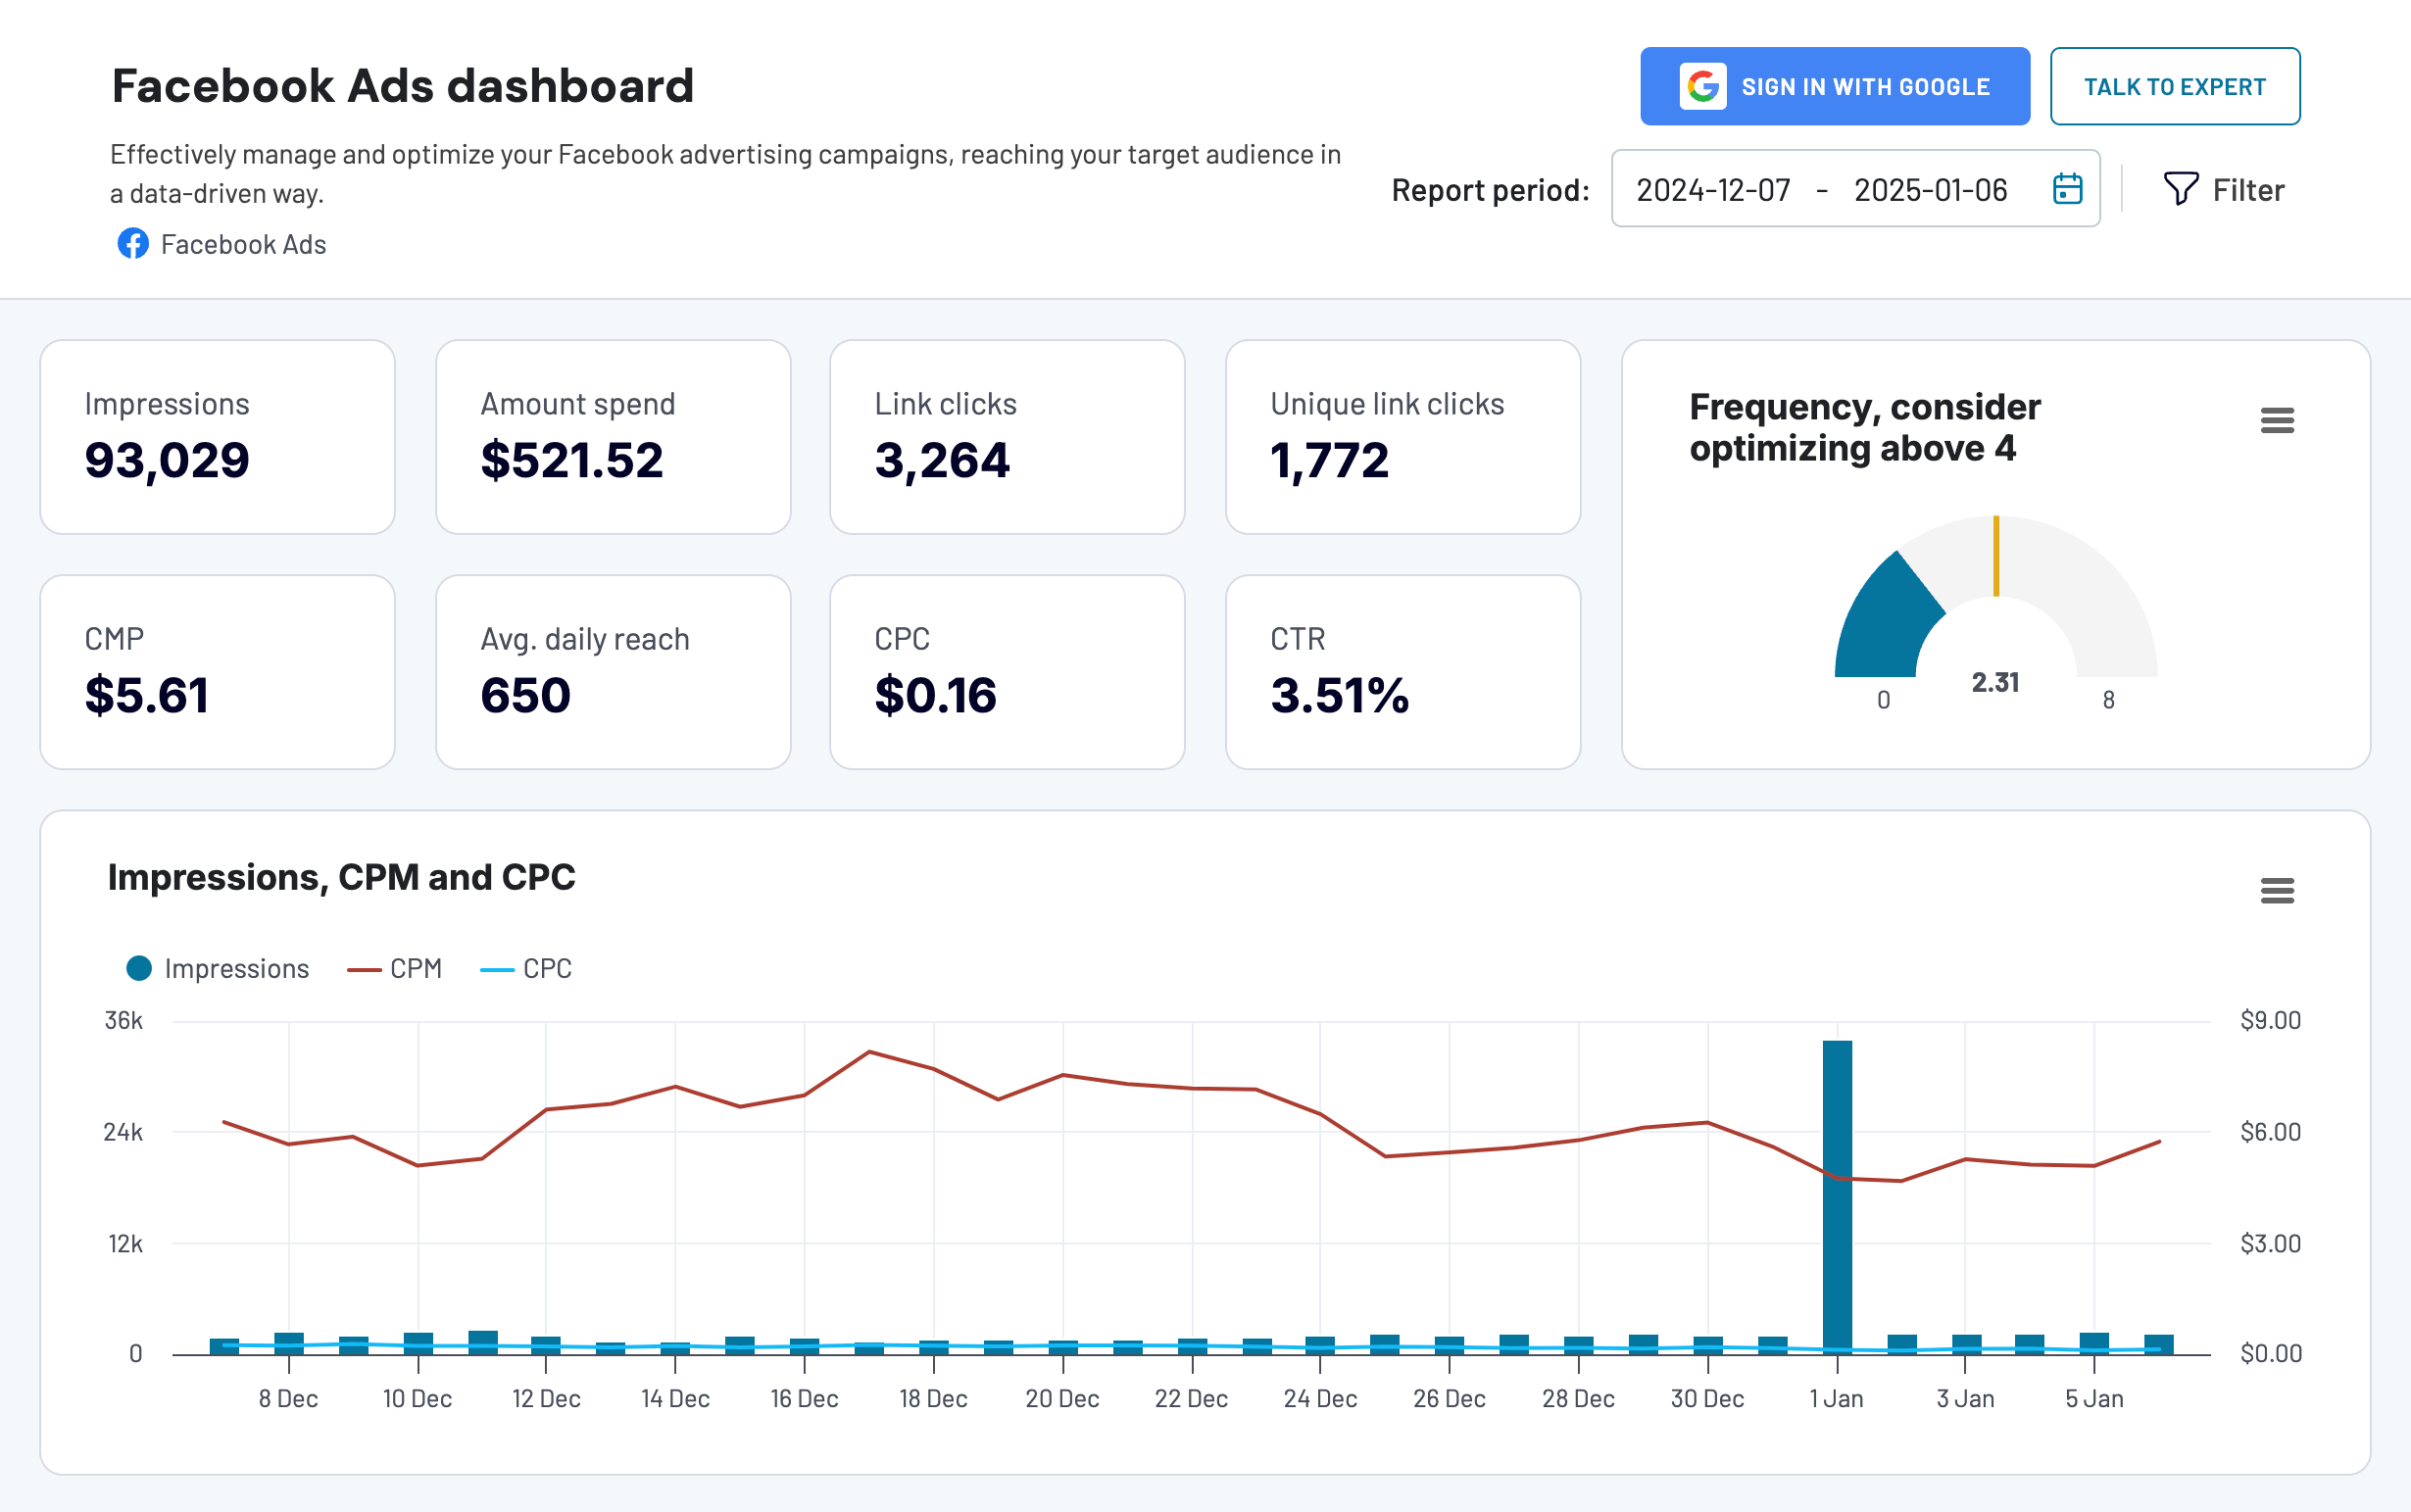
The dashboard is built into Coupler.io. If you prefer an external tool, the same template is available for Looker Studio, Power BI, and Google Sheets.






Facebook Ads leads breakdown report template
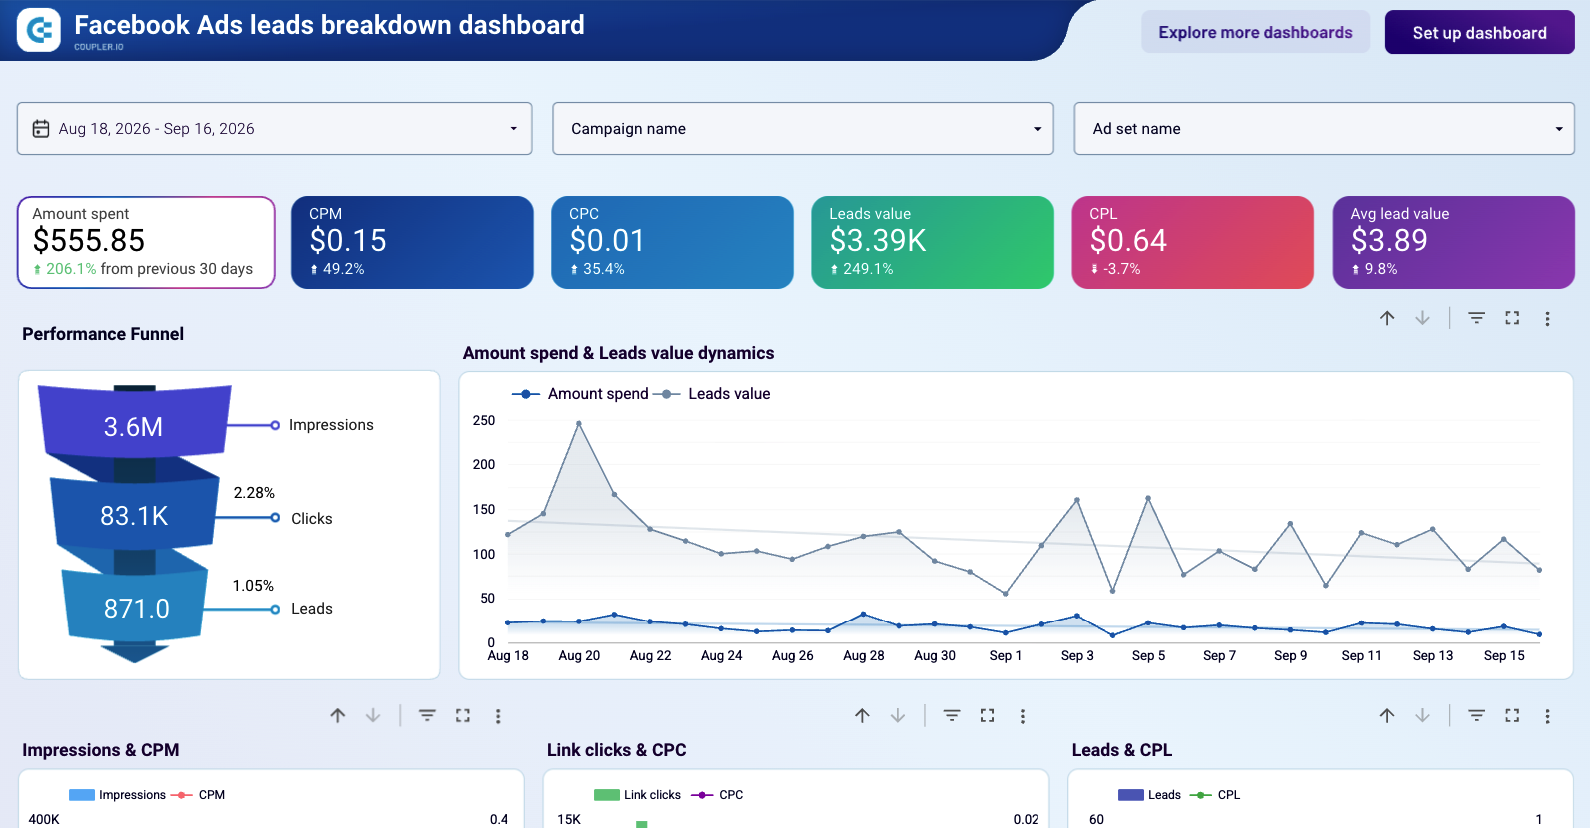
This template tracks the funnel from impressions to leads: total lead volume, cost per lead over time, and lead distribution by campaign, ad set, age, gender, and region. Use the cost-per-lead trend to catch budget drift early, and the demographic splits to see which audiences actually convert into leads versus which ones just click.
Facebook Ads leads breakdown template

Facebook Ads leads breakdown template
Preview dashboardFacebook Ads purchases breakdown report template
This one focuses on the conversion side: ROAS, purchase value trends, and purchase volume broken down by demographics and geography. It answers the question the leads dashboard does not: which campaigns turn clicks into actual revenue, and at what cost.
Facebook Ads purchases breakdown report

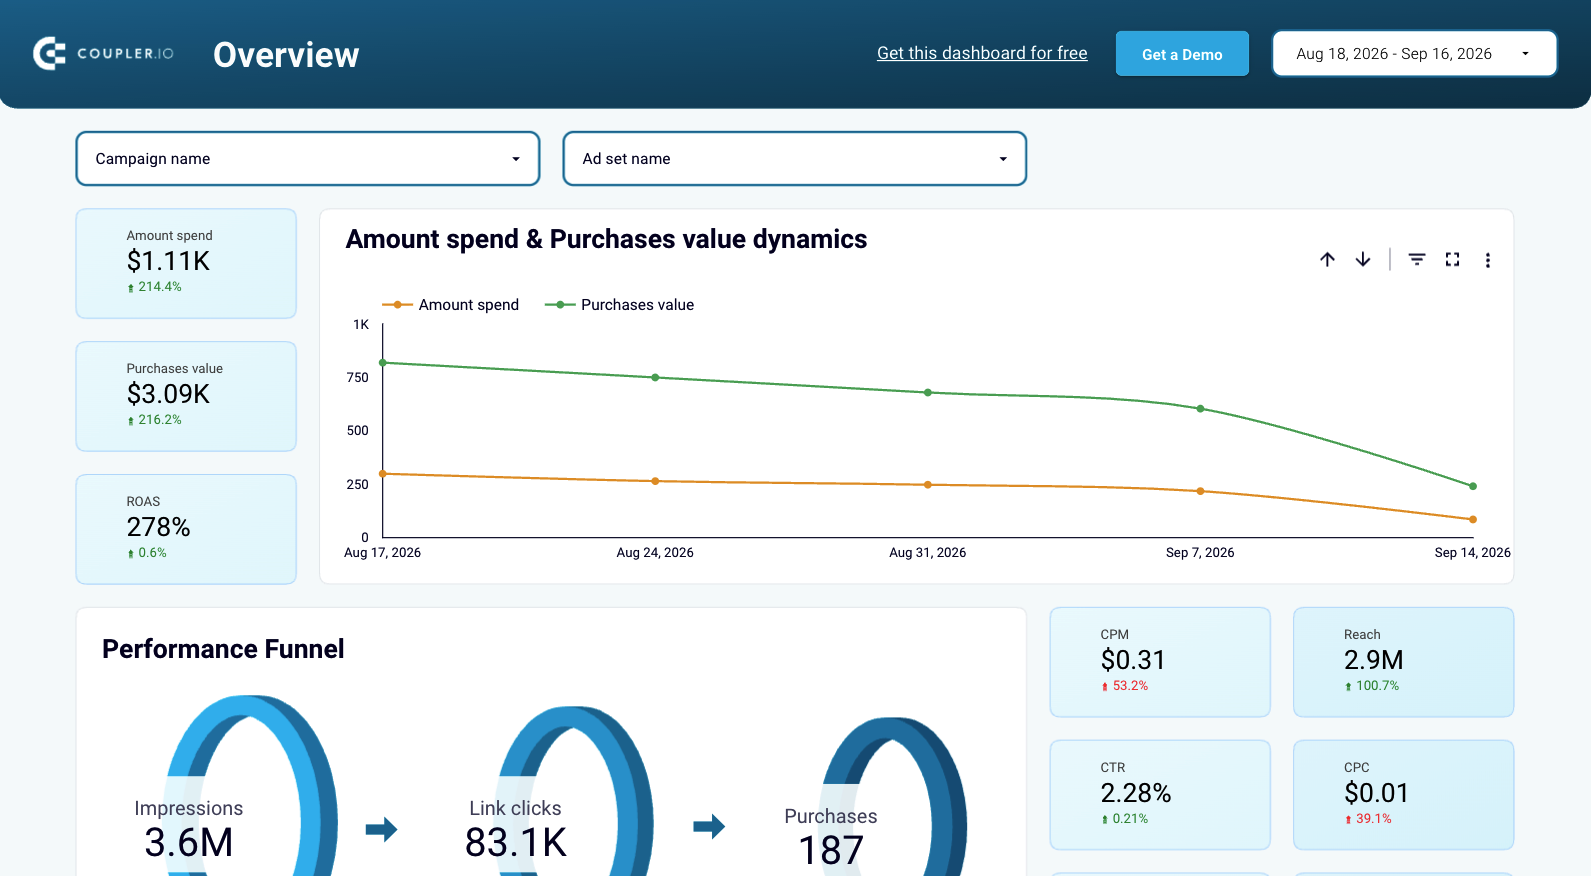
Facebook Ads purchases breakdown report
Preview dashboardMeta Ads creatives report template in Looker Studio
This template shows performance at the creative level across both Facebook and Instagram Ads: impressions, clicks, spend, and CTR per creative. It also tracks weekly CPM and CPC fluctuations, so you can spot when a creative starts costing more for the same results. Useful for teams running regular creative-refresh cycles who need to know which images and copy variants to keep, pause, or replace.
Meta Ads creatives report template

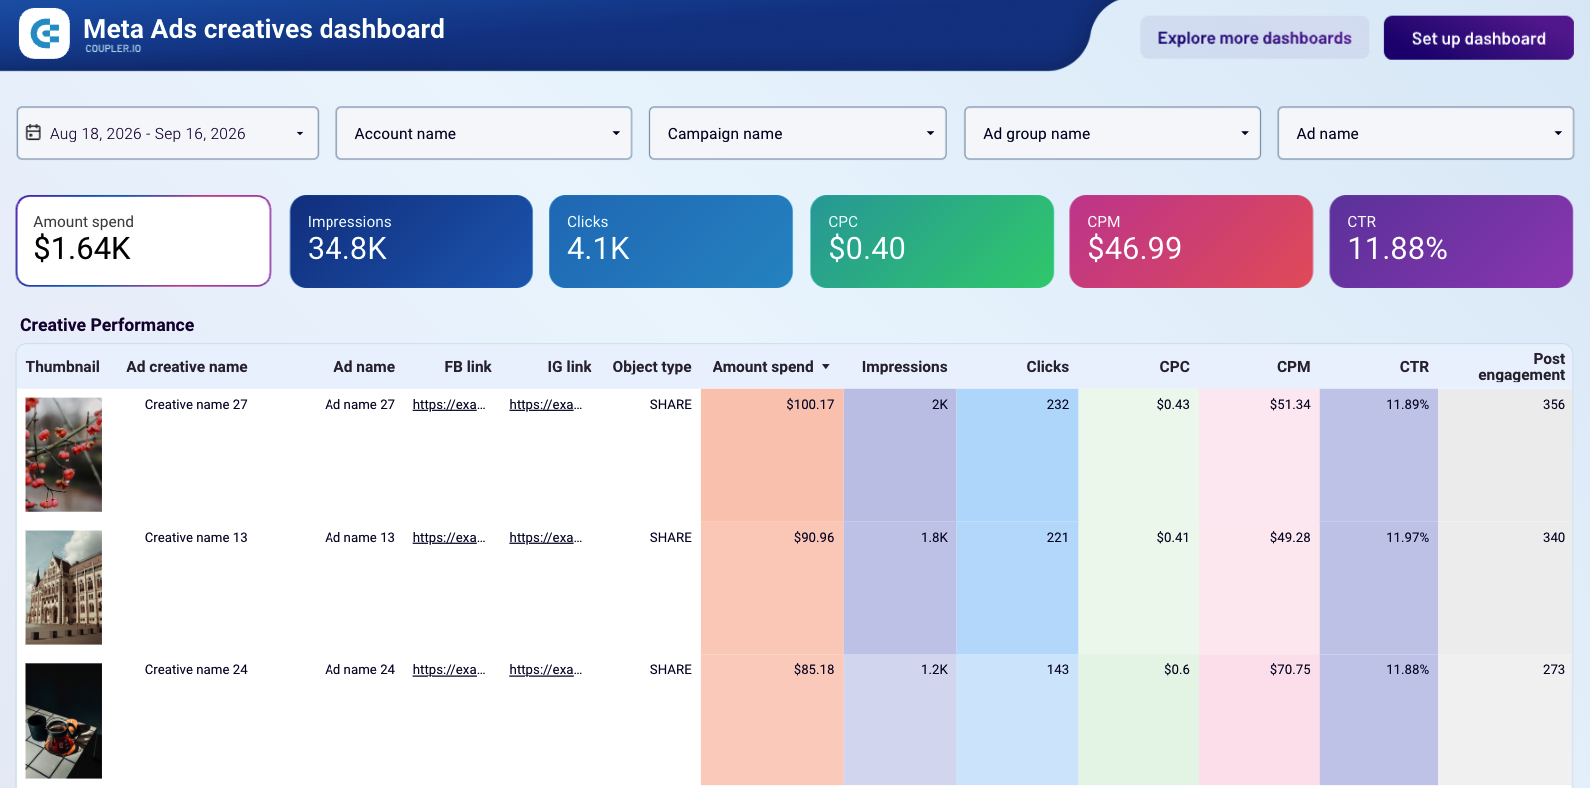
Meta Ads creatives report template
Preview dashboardFacebook Ads PPC report template with cross-channel connectivity
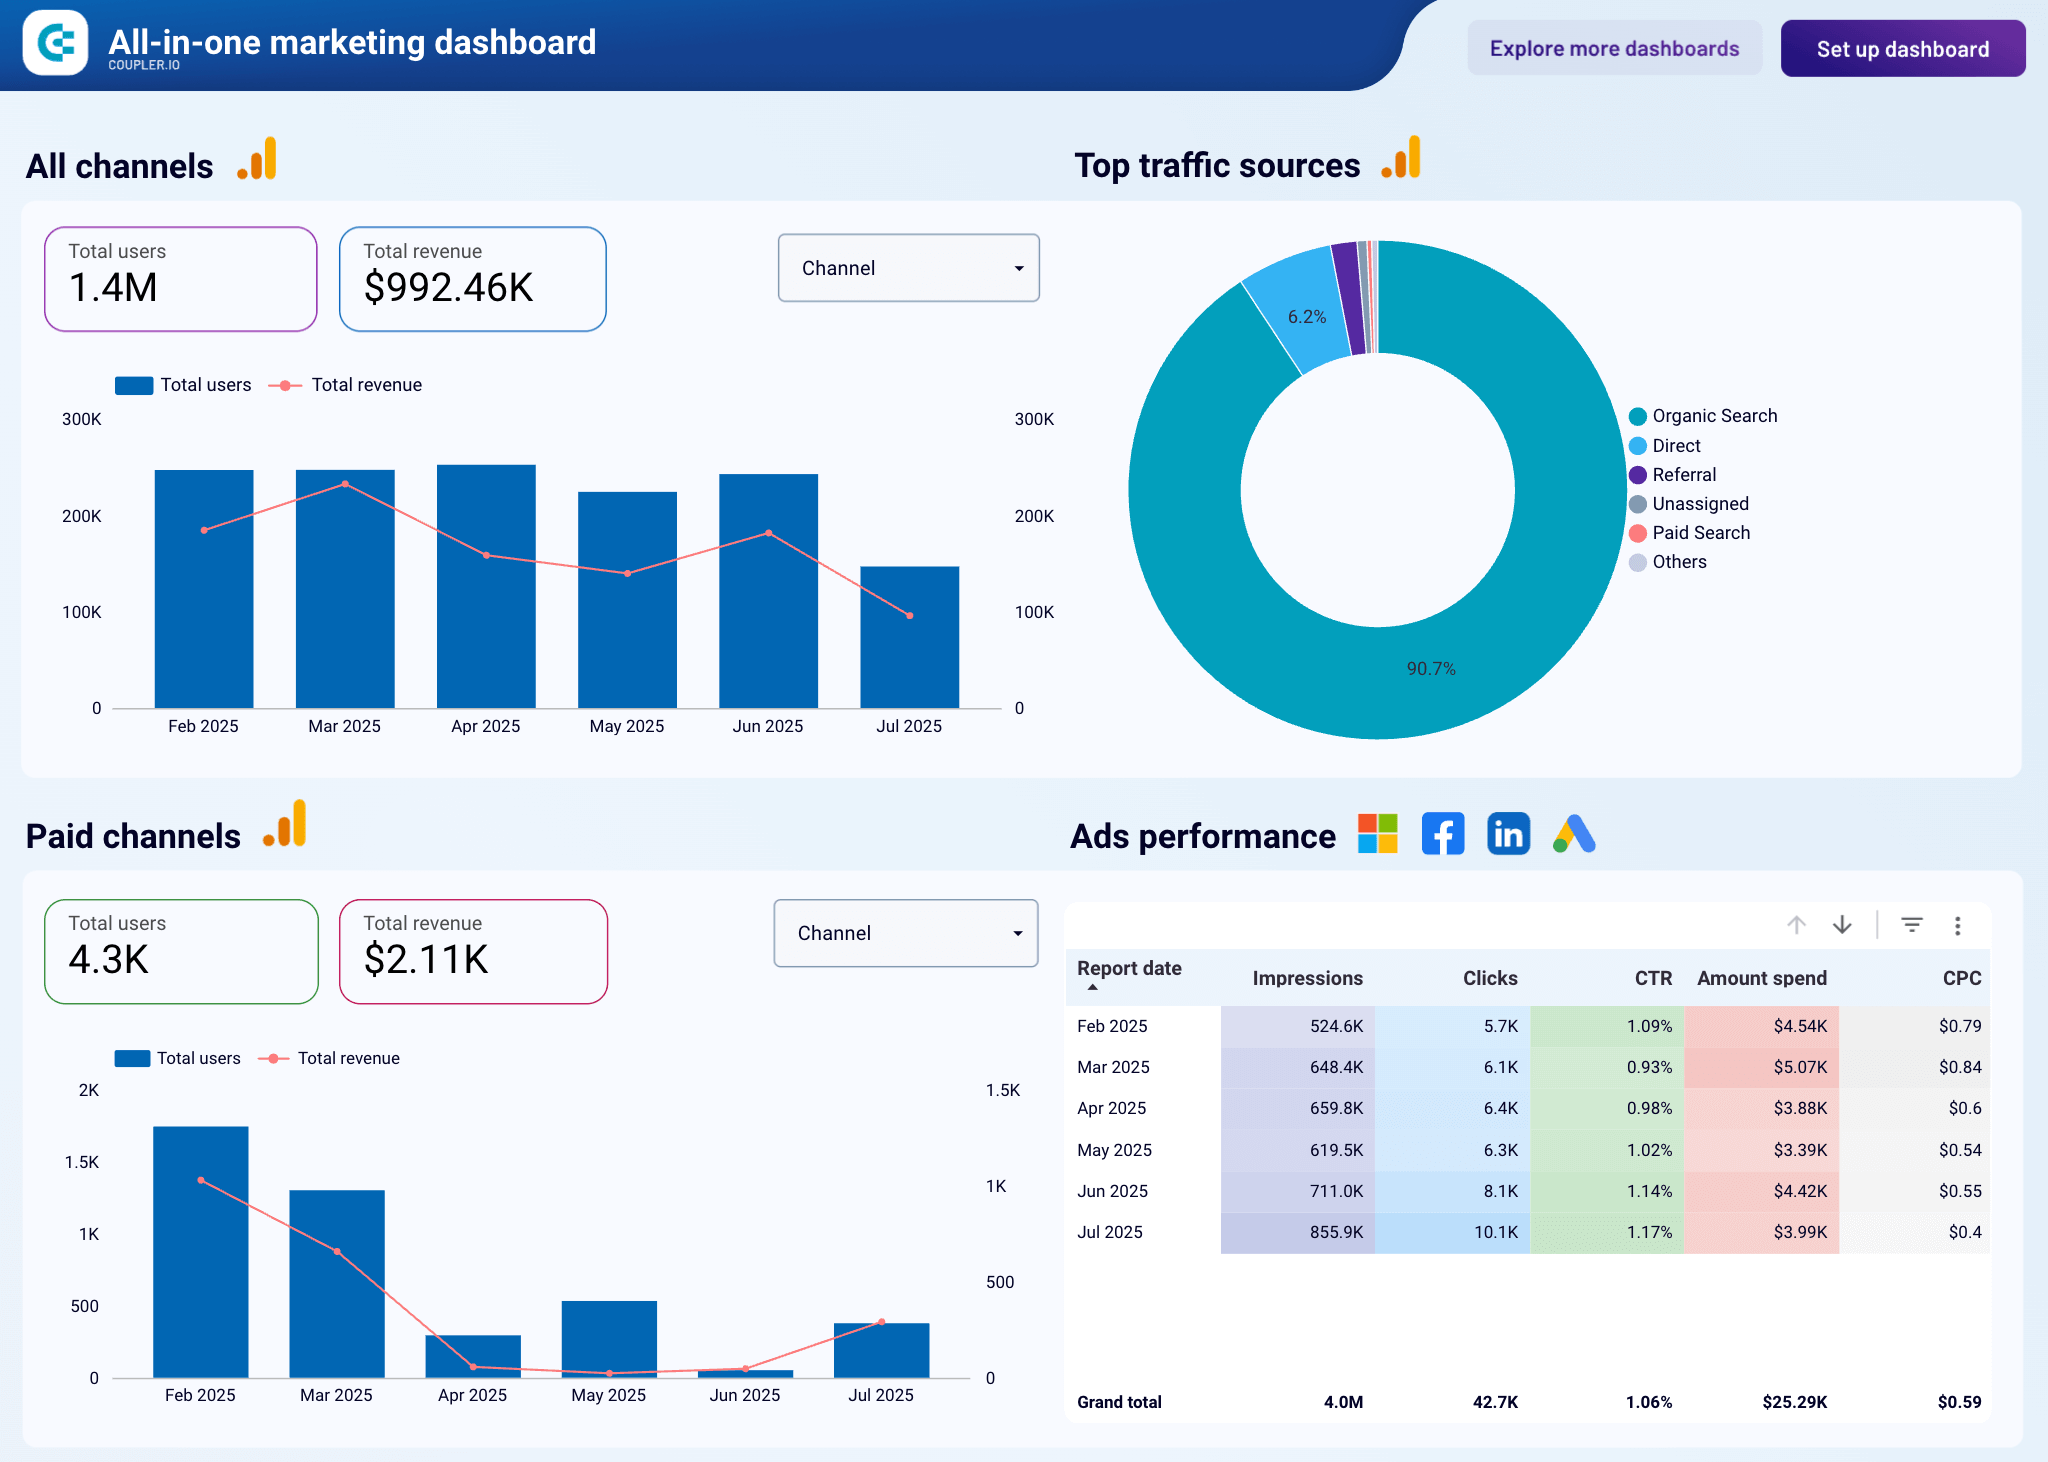
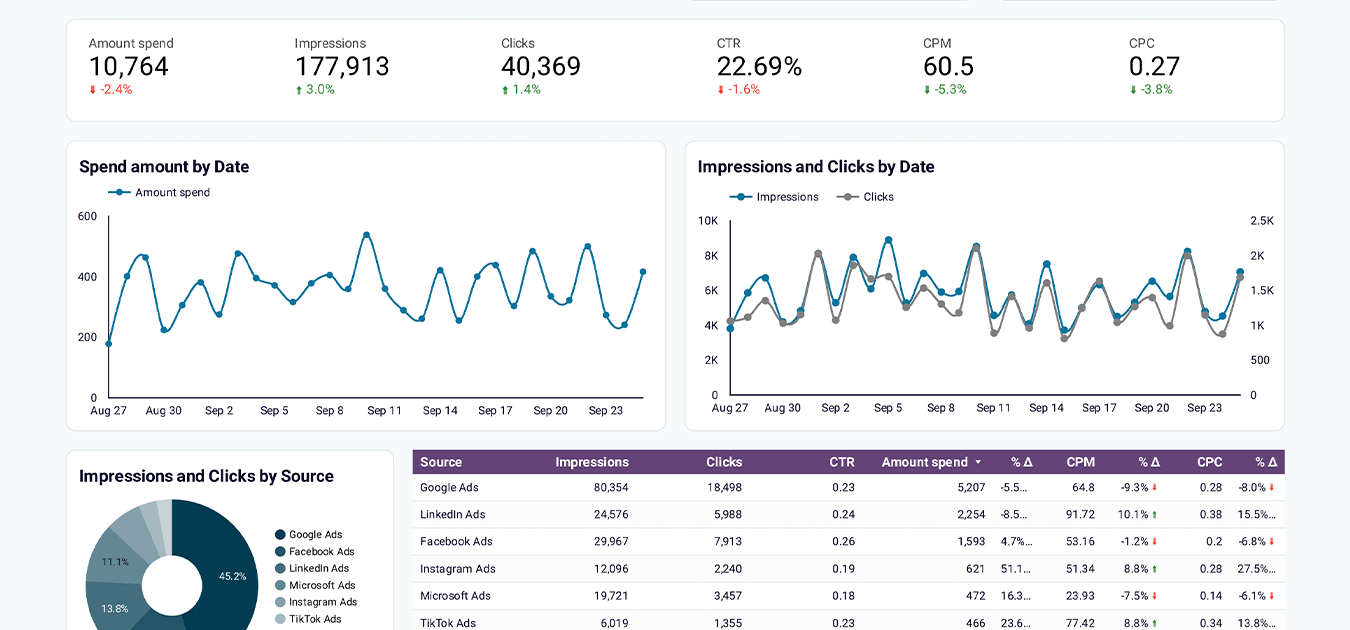
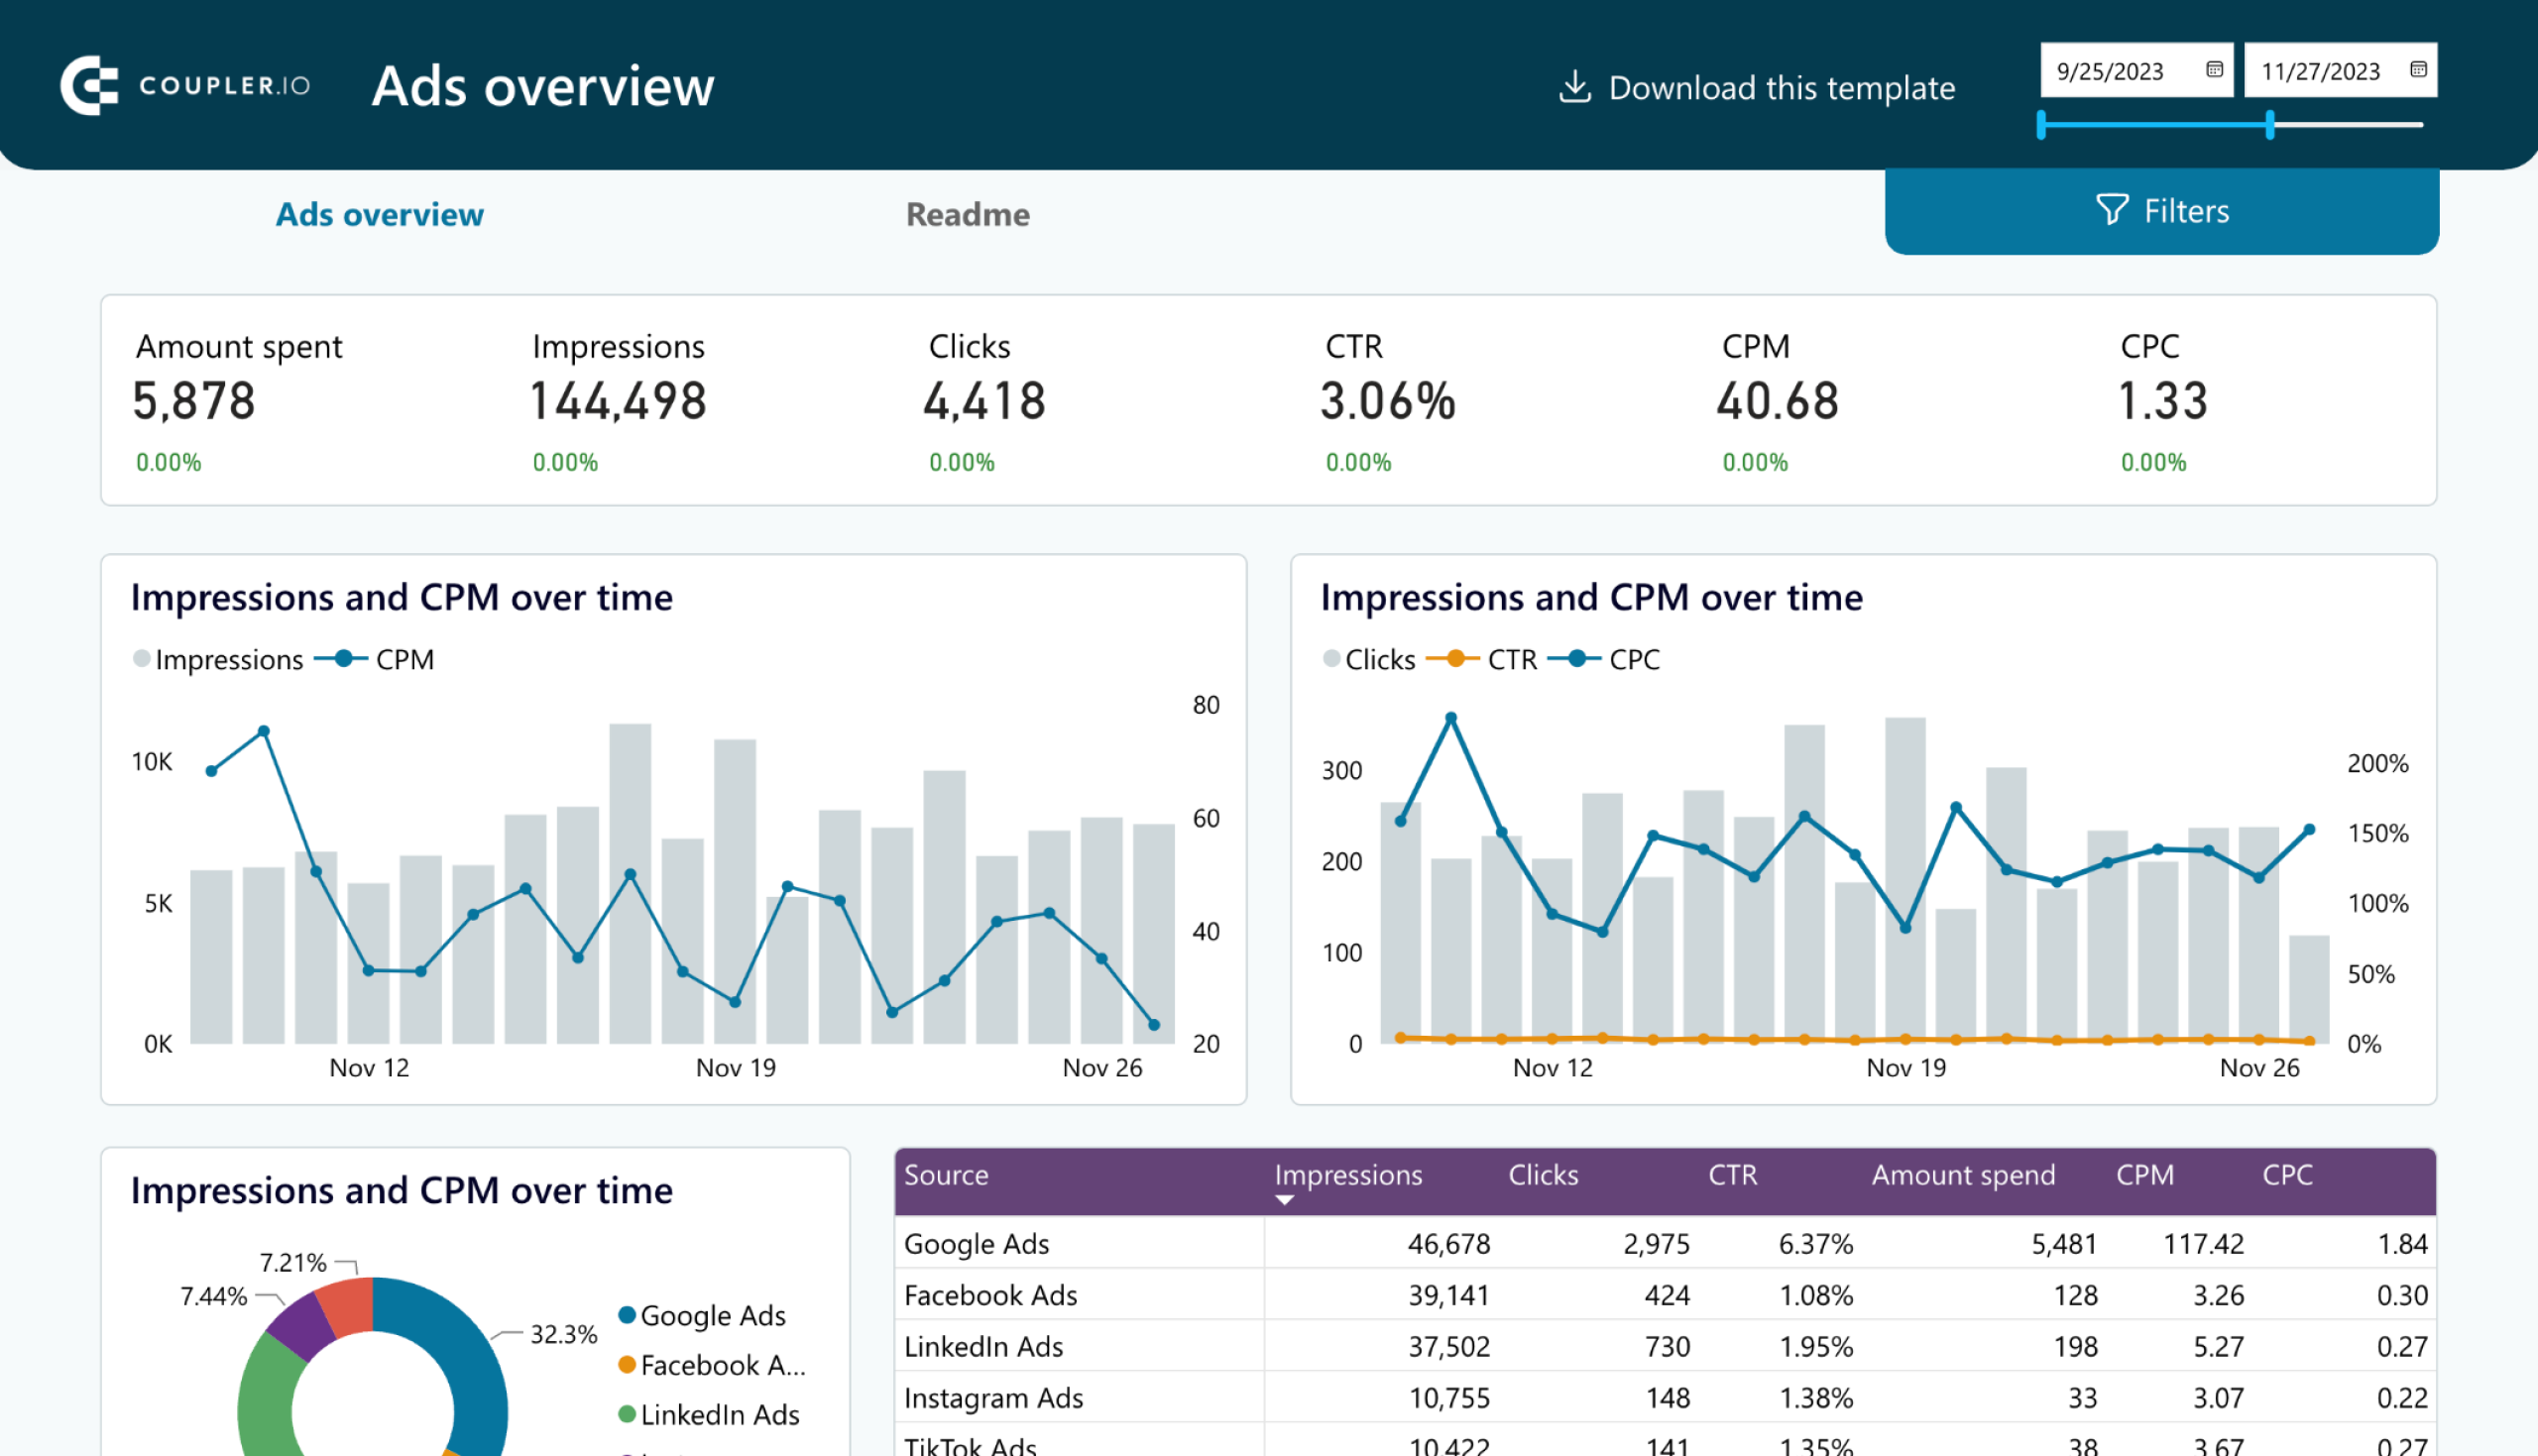
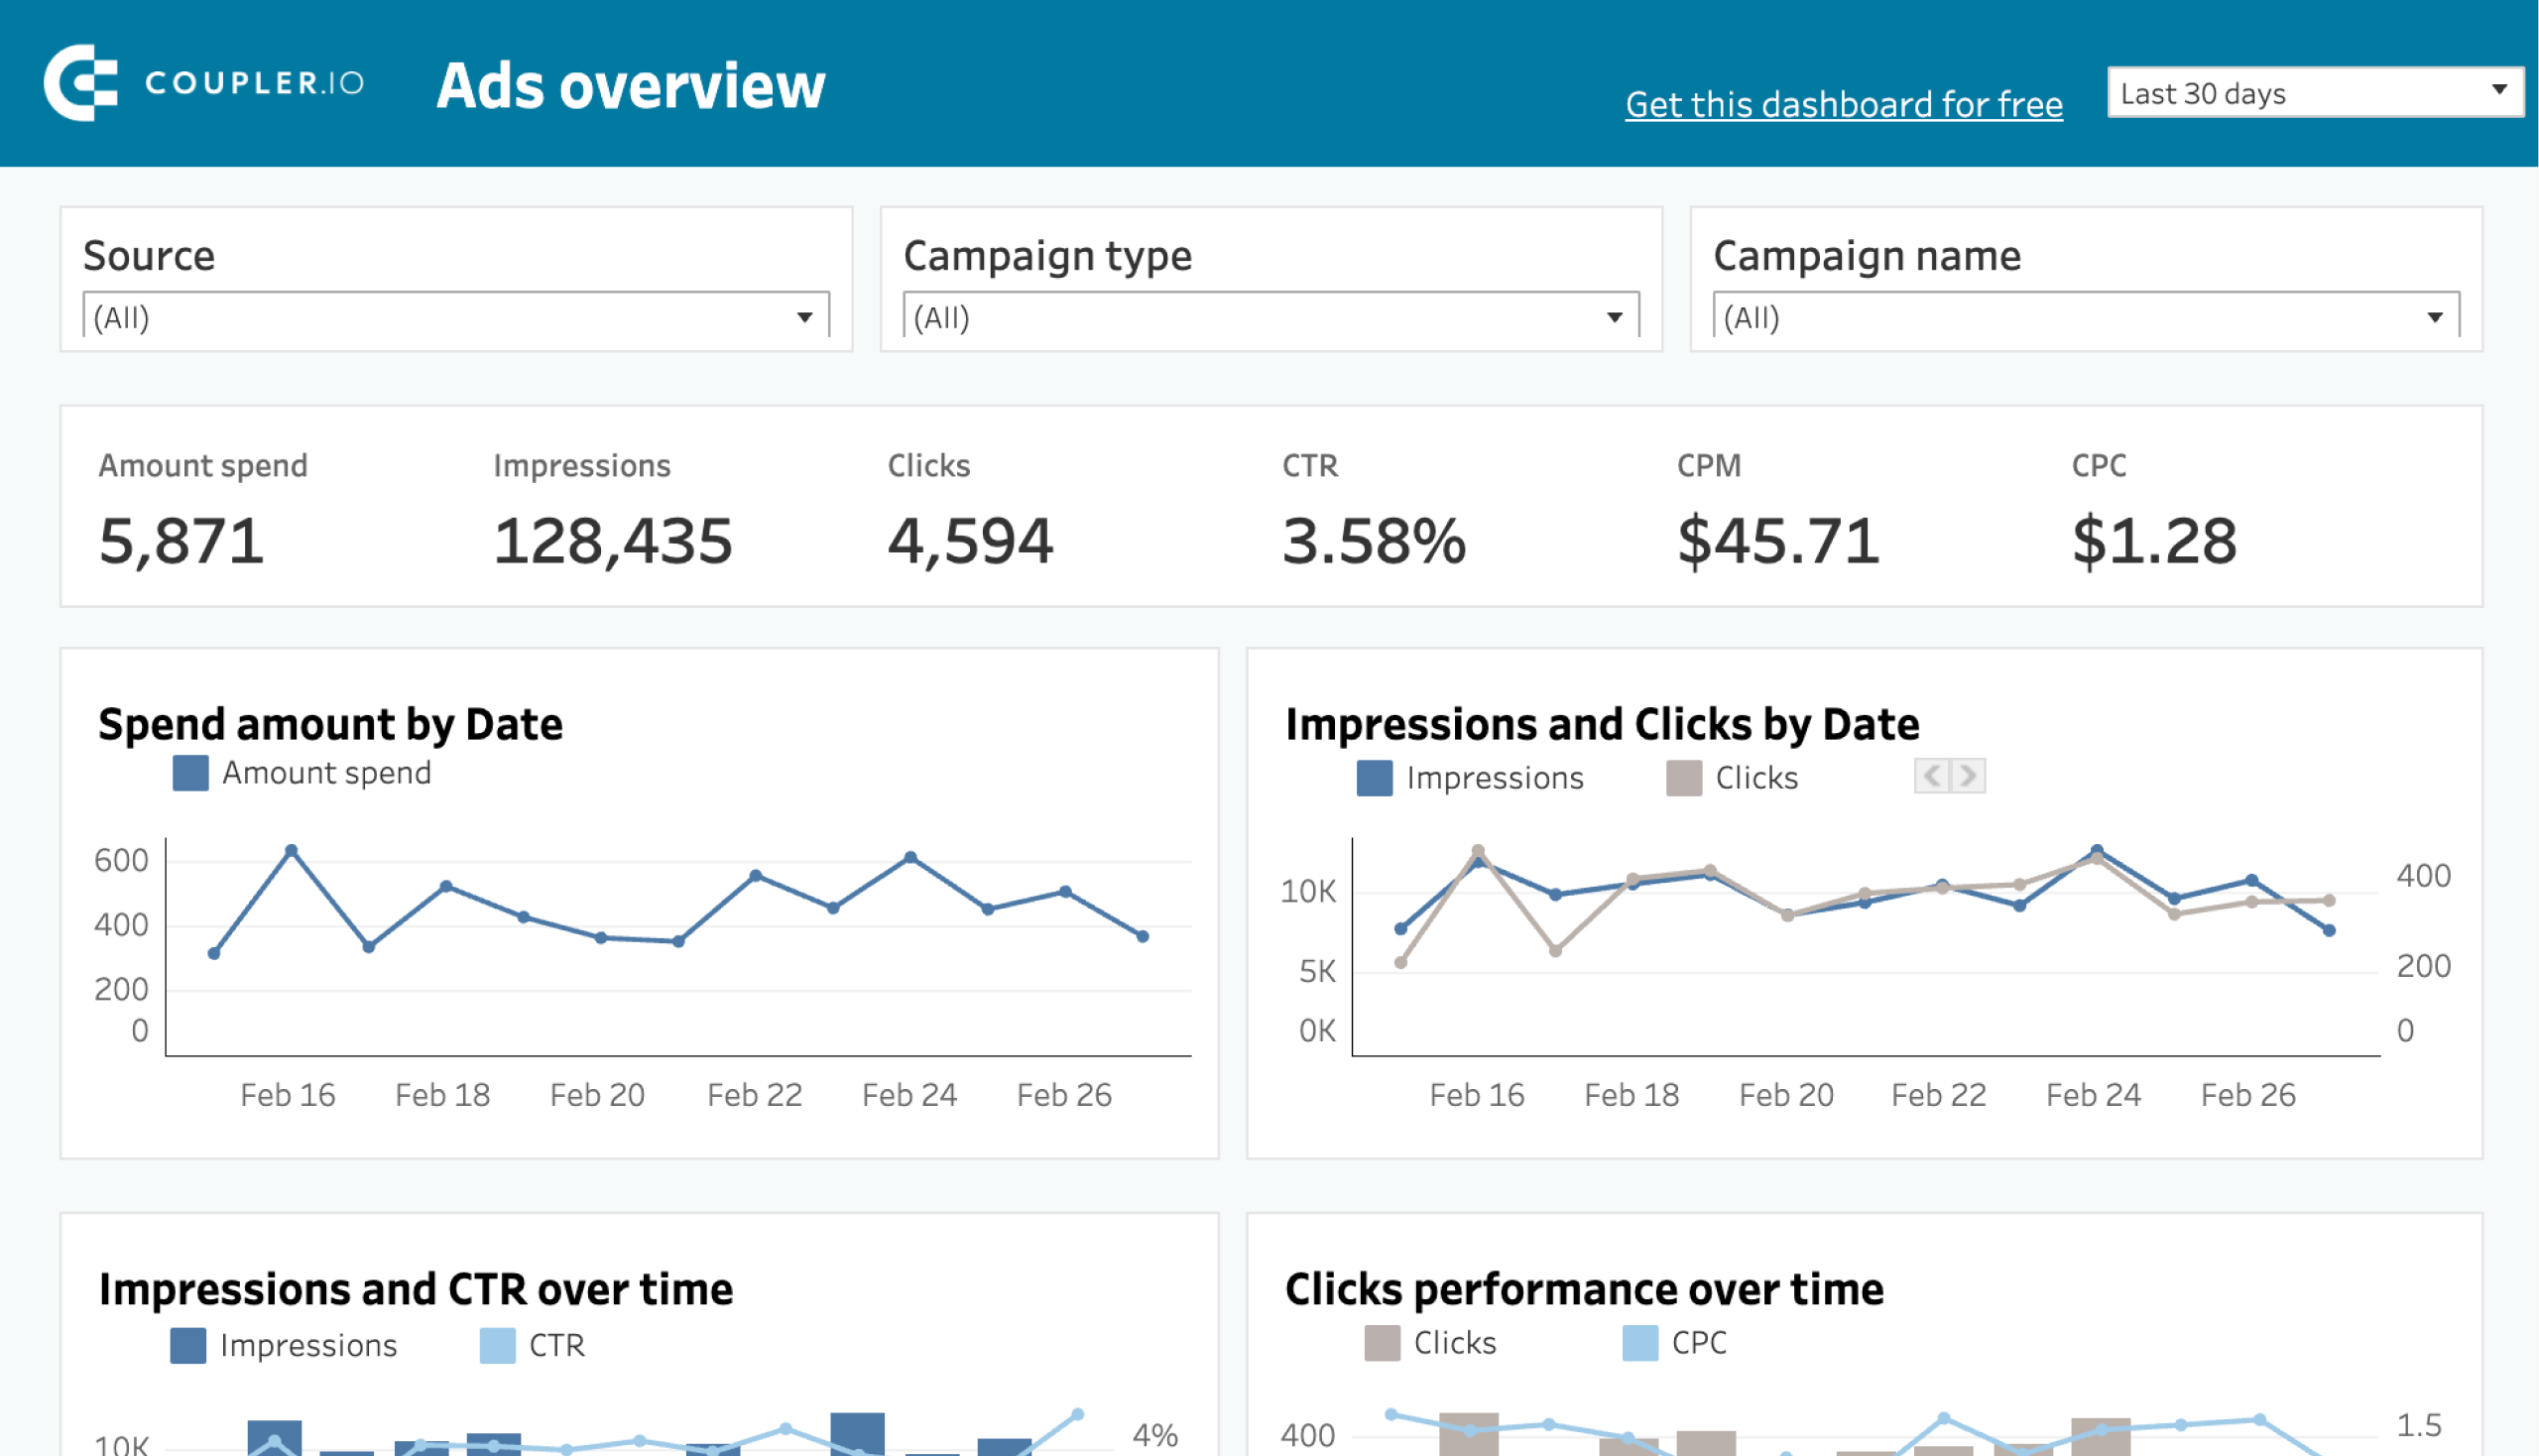
This dashboard pulls performance data from Facebook Ads, LinkedIn Ads, Instagram Ads, Google Ads, and TikTok Ads into one view. CPC, CPM, and conversion rates sit side by side across platforms, so you can compare channel efficiency without switching between five tabs.

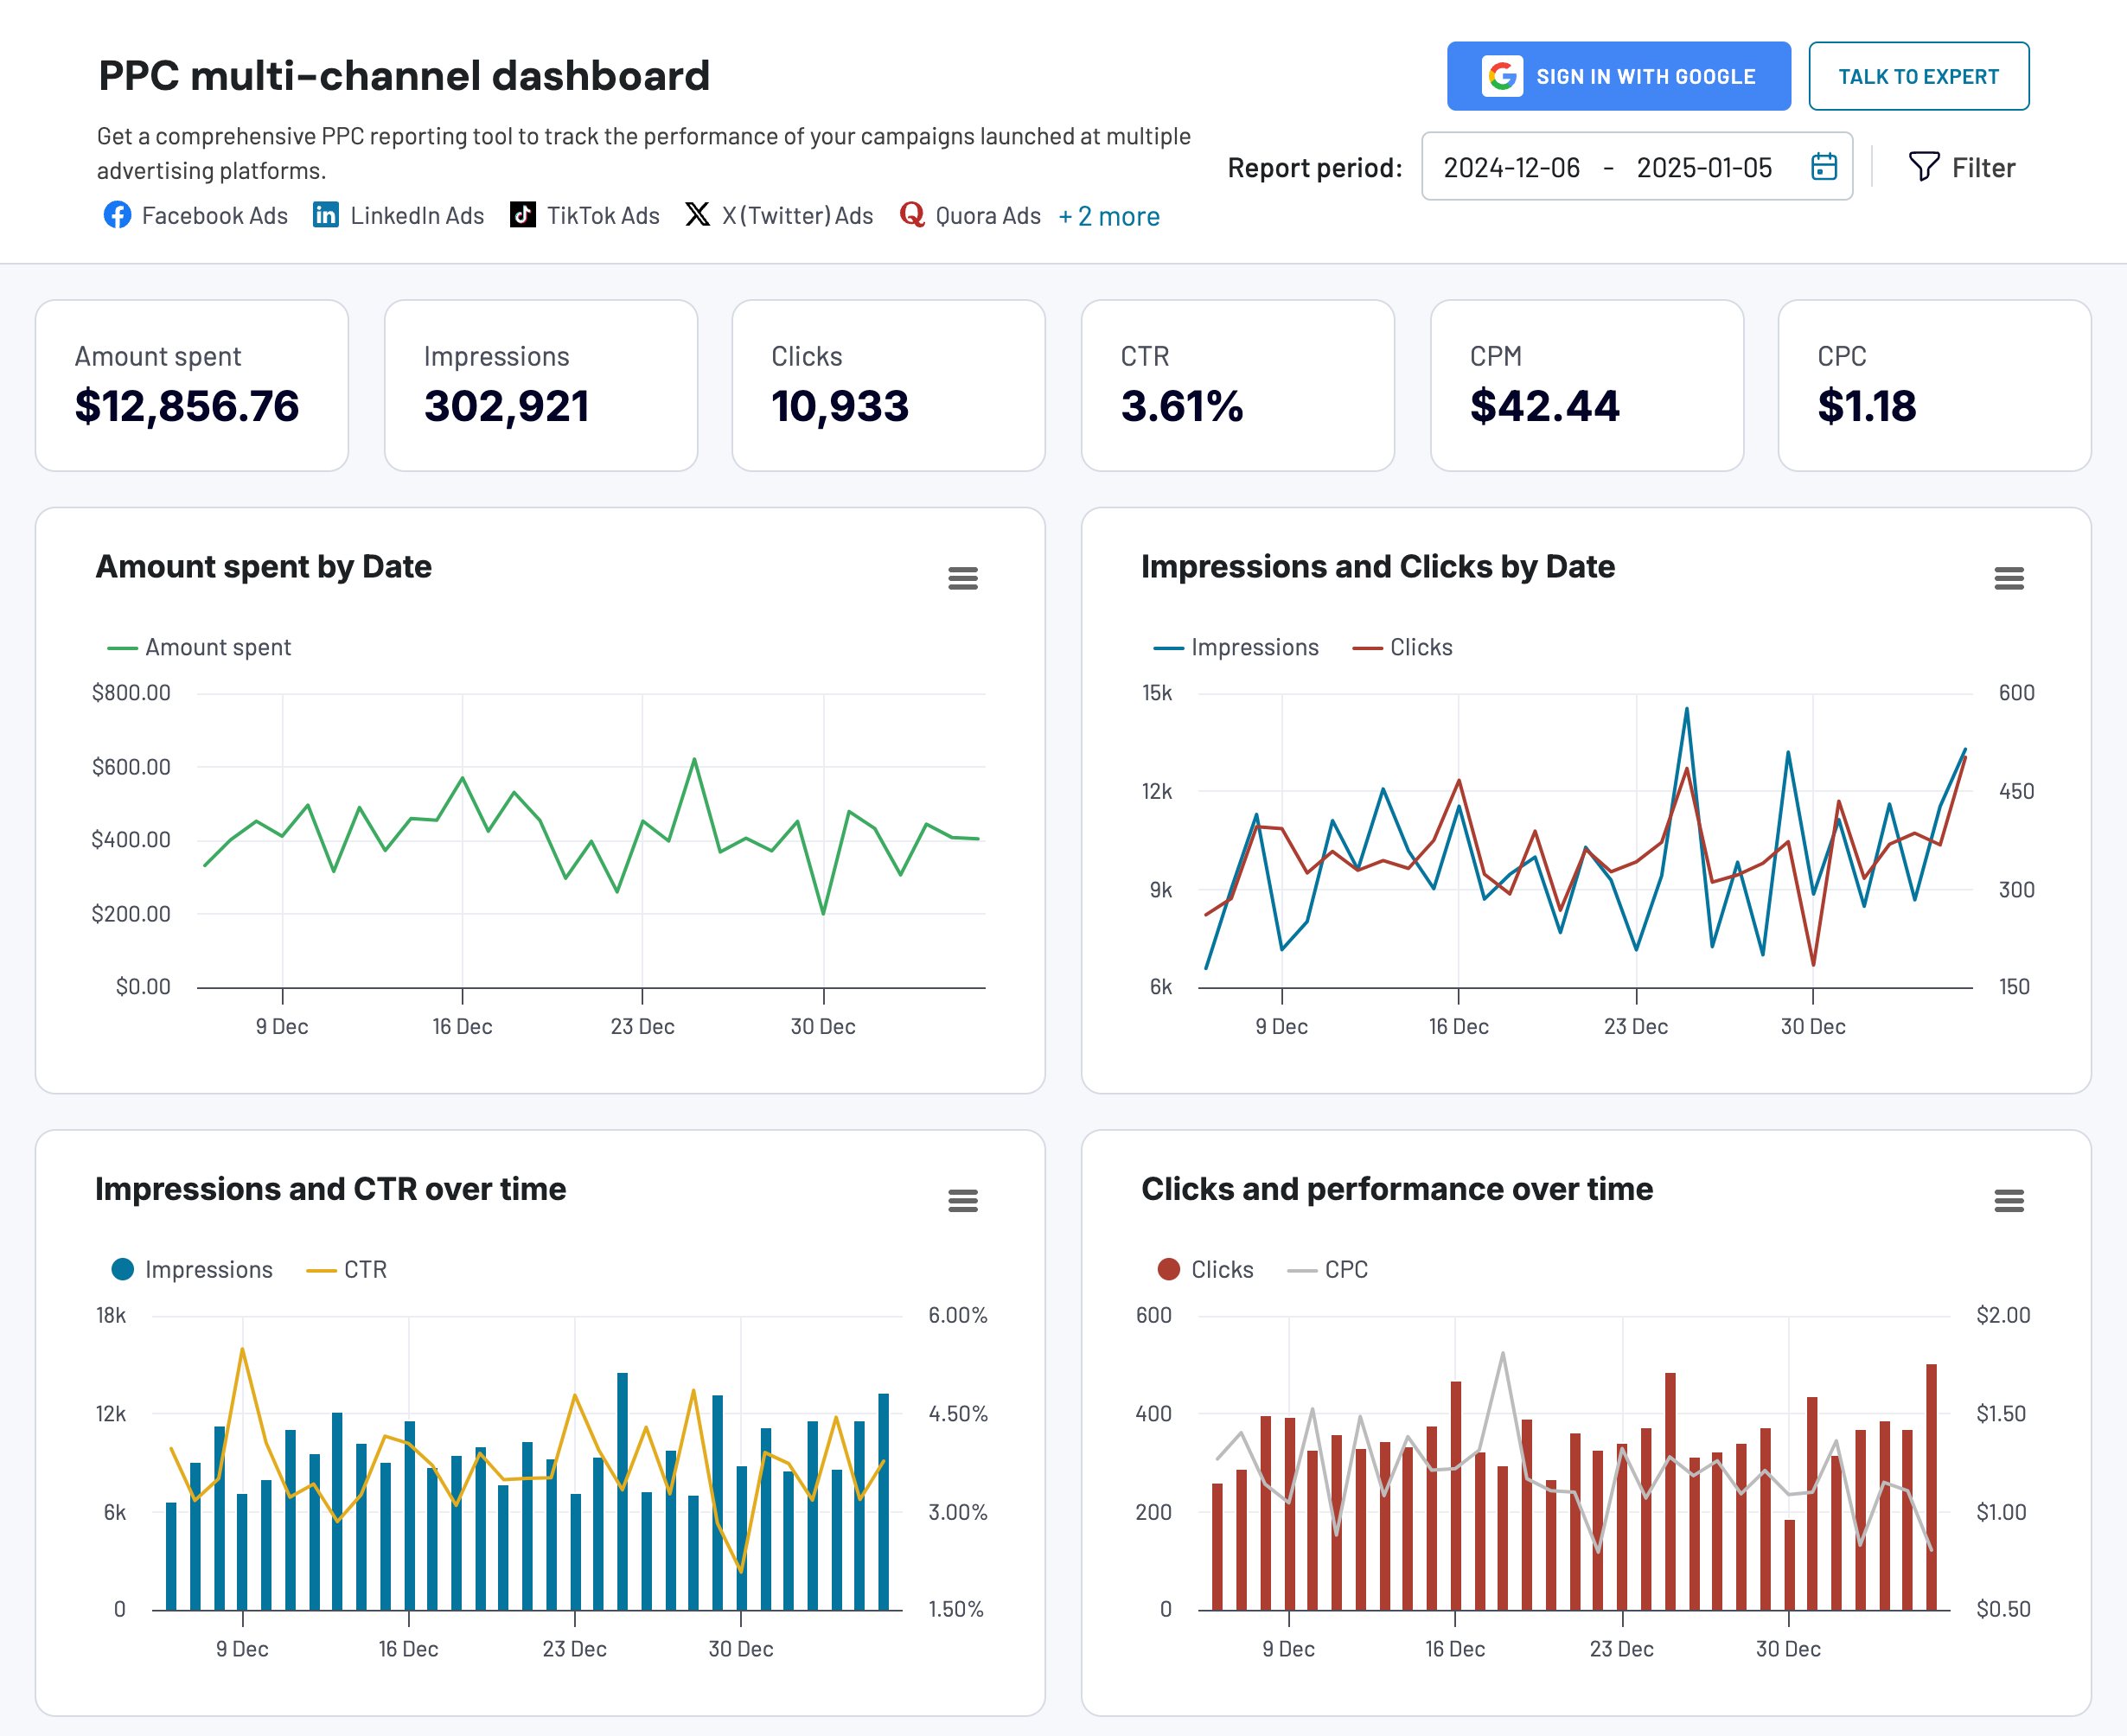
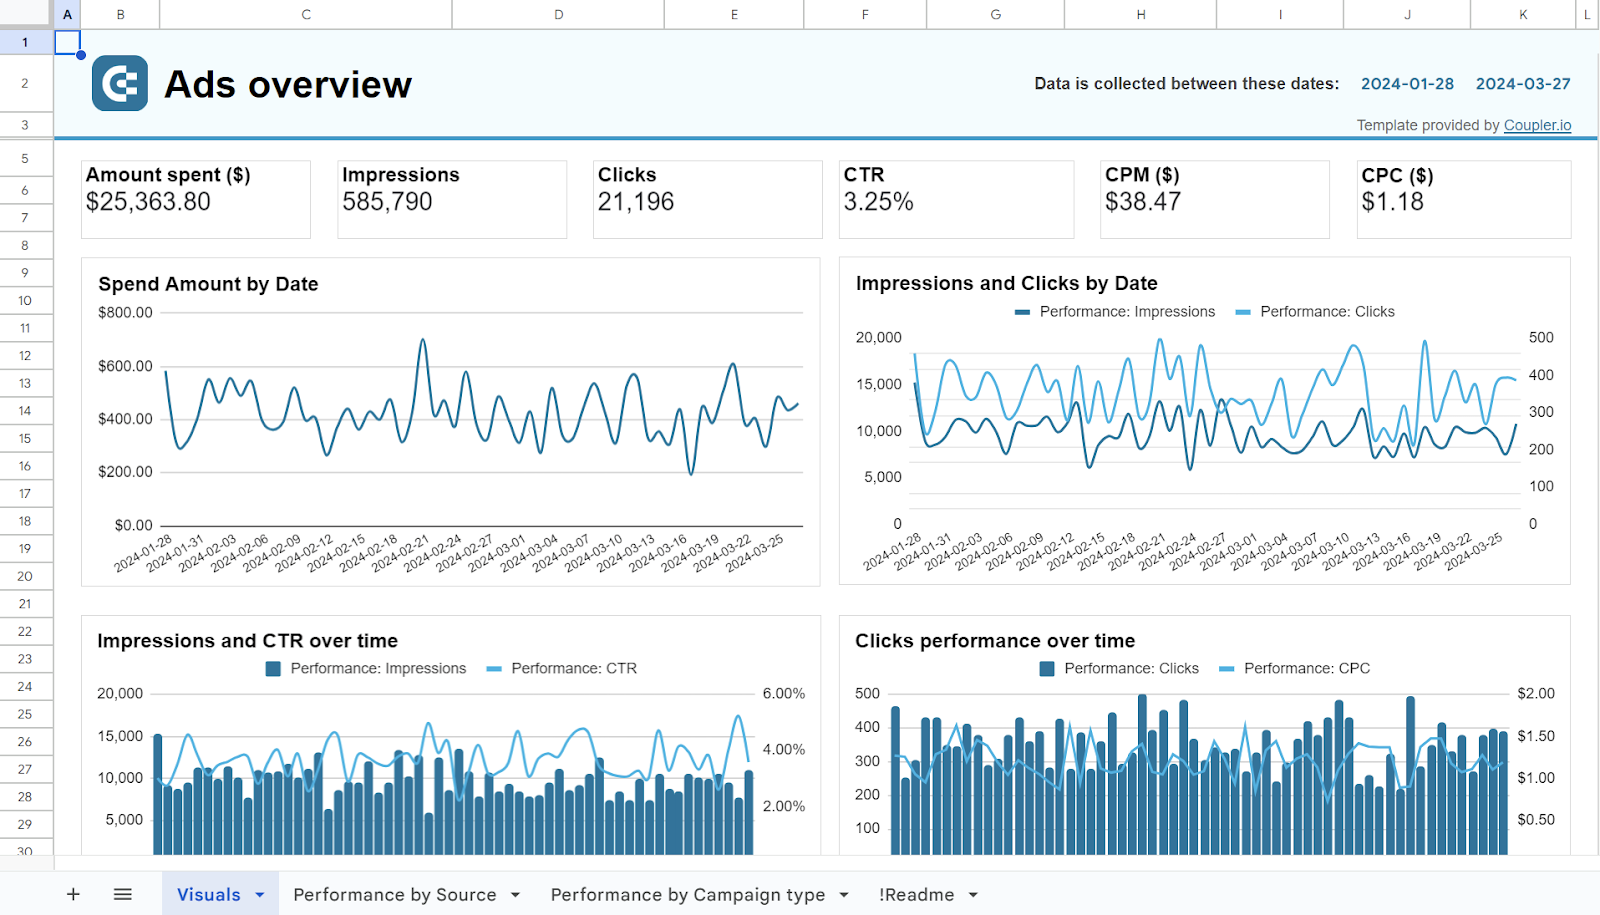
Coupler.io also provides this dashboard as a template for different destinations including Google Sheets, Looker Studio (former Google Data Studio), Power BI, and Tableau.






Other ways to connect Facebook Ads to BigQuery
If your requirements are simpler, or your team already maintains a Facebook Developer App, one of these alternatives may be enough.
BigQuery Data Transfer Service (free, native)
Google offers a native, free connector for Facebook Ads through the BigQuery Data Transfer Service. It works for basic ingestion, with real limits worth knowing up front.
Transfers run once a day at most. The refresh window tops out at 30 days, and you are limited to a fixed set of reports with no custom reporting. Setup requires a Facebook Developer App and a long-lived access token that expires every 60 days. Regeneration is manual. Miss it, and the pipeline quietly stops.
There is also no cross-channel blending. You get raw Facebook Ads tables you will model yourself.
If your needs are basic (one Facebook Ads account, daily refresh, no joins with other channels), it works and costs nothing beyond BigQuery storage.
Manual CSV
Export a CSV from Facebook Ads Manager, upload it to BigQuery. It works for a one-off check, but every refresh means repeating the whole process. There is no automation, no scheduling, and no transformation step.
Facebook Ads API
The Facebook Ads API lets you pull exactly the fields you want on whatever schedule you define. The trade-off: you write and maintain the code yourself. That means authentication handling, pagination, rate limiting, error recovery, and token renewal.
We covered the details in a separate guide. See the Facebook Ads API walkthrough.
Which method should you use?
It depends on how often you need fresh data and how much setup you want to manage.
Go with Coupler.io if you want the pipeline running in minutes, need refreshes more often than once a day, or plan to blend Facebook Ads with other sources. It is also the only option here that lets you describe the pipeline in plain English and skip the configuration screens.
Go with the BigQuery Data Transfer Service if daily refreshes and a fixed report set cover your needs, and you do not mind maintaining a Facebook Developer App and renewing the token every 60 days.
Go with manual CSV for a single, one-time analysis where automation is not worth the setup.
Go with the Facebook Ads API if your engineering team needs programmatic control and custom extraction logic.
Send Facebook Ads data to BigQuery and analyze it with AI, all inside Coupler.io
Get started for freeFAQ
Is there a free way to send Facebook Ads data to BigQuery?
Yes. Google’s BigQuery Data Transfer Service is free and native. It is limited to daily refreshes, a 30-day window, and a fixed set of reports, and it requires renewing a Facebook token every 60 days.
How often can the data refresh?
With Coupler.io, anywhere from every 15 minutes to monthly. Google’s native transfer runs once a day at most.
Do I need a data engineer?
No. Coupler.io connects with a Facebook login and can build the whole pipeline from a plain-English description. No SQL, no code.
Does this include Instagram Ads data?
Facebook Ads and Instagram Ads run through the same Meta Ads infrastructure, so any method that pulls from the Facebook Ads API (including Coupler.io and the Data Transfer Service) includes Instagram placement data by default. In Coupler.io, you select the ad account, and campaigns from both platforms come through in the same table.