You’ve probably already asked Claude what’s working on your social channels. It’s good at that part: give it the numbers, and it will explain what moved and why in language you can drop straight into a client update. But it reads whatever you give it, and a manual export is just a snapshot that goes stale the moment you download it.
Coupler.io handles that part. It connects your social platforms, keeps the data fresh, and runs the math, so Claude gets clean, calculated numbers and does what it’s actually good at: reading them and telling you what they mean. Learn how to connect social media data to Claude once and get every answer you can trust and act on.
A dashboard shows you the numbers and leaves you to work out what they mean. Claude does that interpreting for you, reading from the data Coupler.io’s Analytical Engine has already calculated. That’s Claude AI social media analytics in practice. Once your platforms are connected you can analyze social media performance with Claude using the metrics you already report on.
Core social media metrics Claude can help you interpret:
- Engagement rate, measured against reach
- Follower growth over time
- Reach and impressions, and the gap between them
- Posting frequency and cadence
- Best time to post, by platform
- Content-format performance: Instagram Reels vs. carousel vs. static, Shorts vs. long-form
The value shows up when these metrics meet. Reach can climb while engagement rate stays flat, which usually means content is traveling but not landing, and a single dashboard rarely makes that obvious. You track social media engagement with Claude well when it can weigh the numbers against each other, and that depends on data arriving structured and already calculated.
With Coupler.io, you can connect Instagram Insights, Facebook Page Insights, LinkedIn, TikTok Organic, YouTube, and 400+ sources to Claude. You get your data refreshed on a schedule and available to Claude through a read-only channel, so it can query the data in natural language.
Link Coupler.io to Claude, once
A one-time connection, and every channel's data is a question away in Claude. No exports, no rebuilding, just ask and act on what comes back.
Try it for free
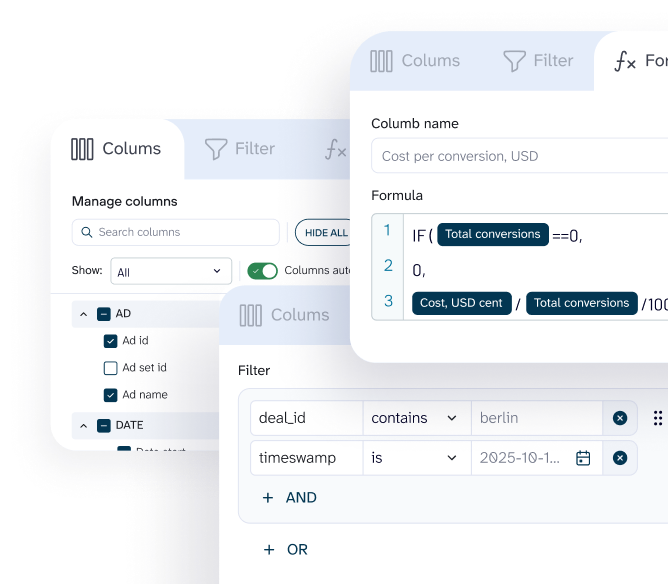
There are just two things you do: connect your data, then start asking. When you need the platforms blended or the metrics aligned, you just say so in plain language, and Coupler.io handles it for you. Here’s how an agency social media manager runs a 90-day review before a client call.
Step 1: Connect data to Claude
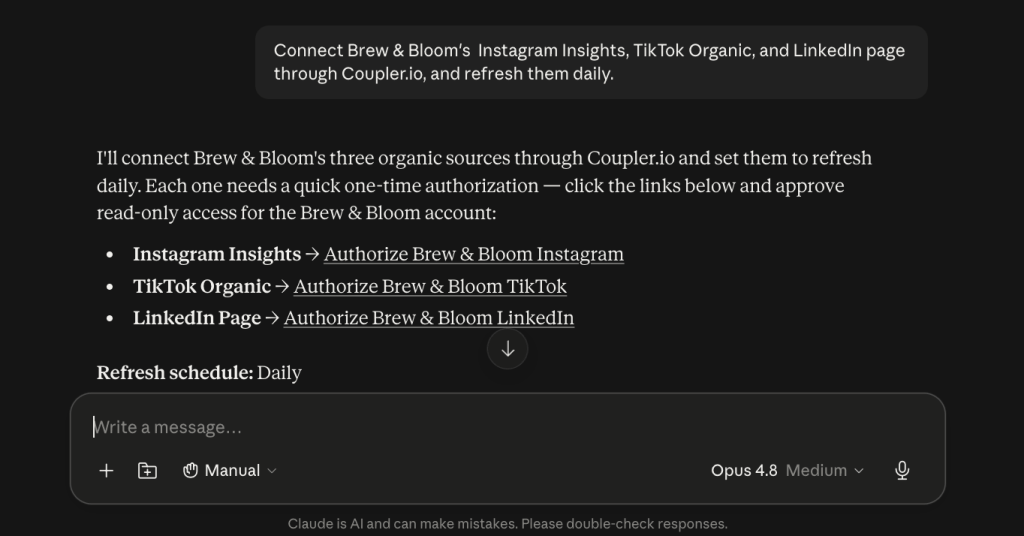
The manager asks Claude to connect the client’s channels through Coupler.io:
Connect Brew & Bloom's Instagram Insights, TikTok Organic, and LinkedIn page through Coupler.io, and refresh them daily.
Claude sets up the connection through Coupler.io. The manager authorizes each account once when prompted, and the data refreshes daily from then on.

To ensure clean cross-platform comparison, the manager asks Claude to blend them into one data set with a single engagement rate. Coupler.io does the blending and the math; the manager just asks:
Blend Brew & Bloom's Instagram, TikTok, and LinkedIn into one data set for the last 90 days of organic posts. Use one engagement rate across all three: total engagements divided by reach.

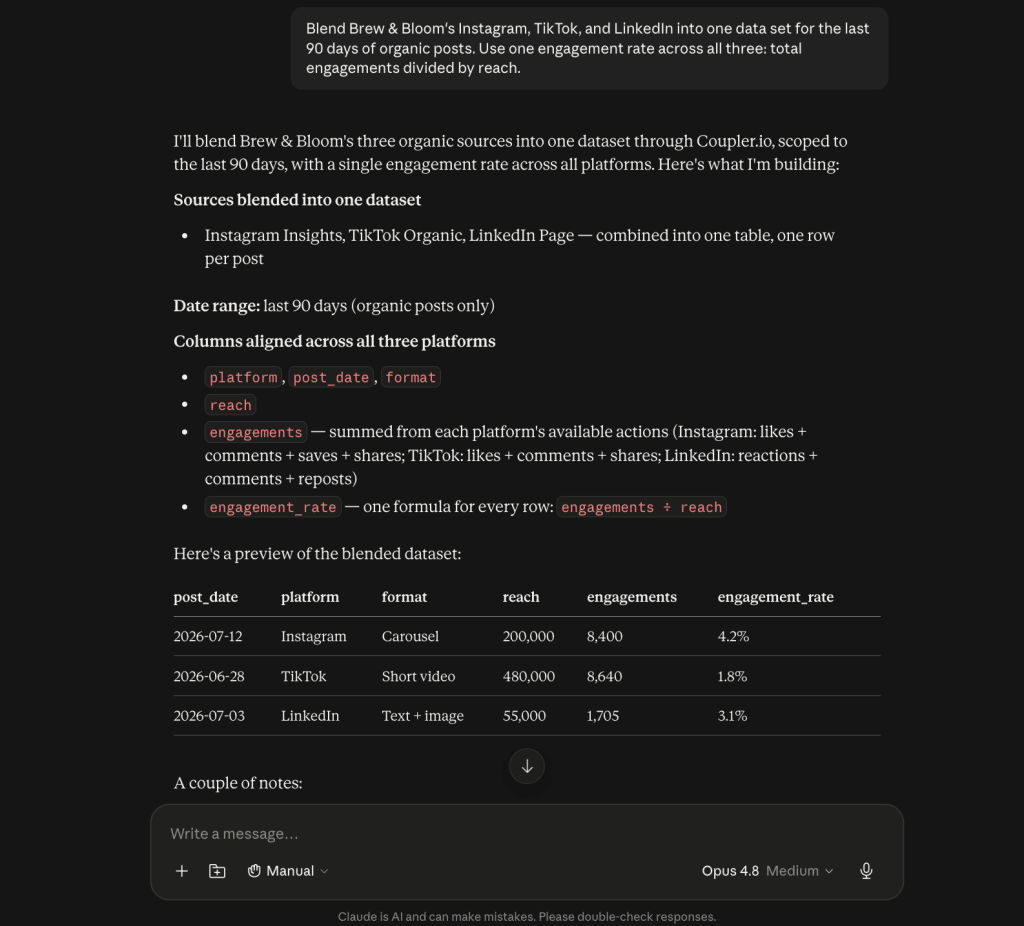
Now a 4.2% on Instagram, a 1.8% on TikTok, and a 3.1% on LinkedIn mean the same thing, so the comparison is fair.
Note: give Claude context first
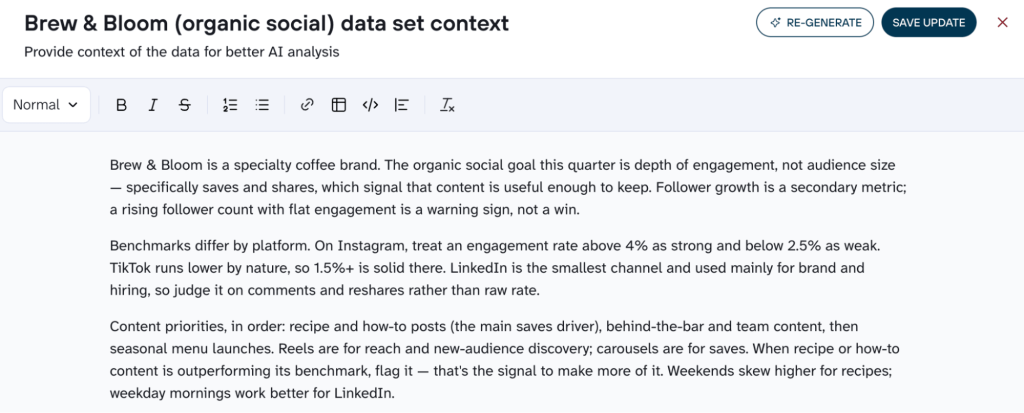
Context is what makes Claude’s data analysis accurate and specific to the client. There are two types of context to add to the data set in Coupler.io, once, and every question after runs against them:
- Data context documents what each column means: that
engagement_rateis engagements over reach, or thatsavesonly exists on some platforms. As a result, Claude reads the structure correctly on its own. - Business context tells Claude what the account cares about: the goal this quarter, or the engagement rate that counts as strong for this niche. With that in place, Claude weighs each number against the target and tells you where it lands.
Step 2: Ask the first question
With the data connected, the manager asks in plain language:
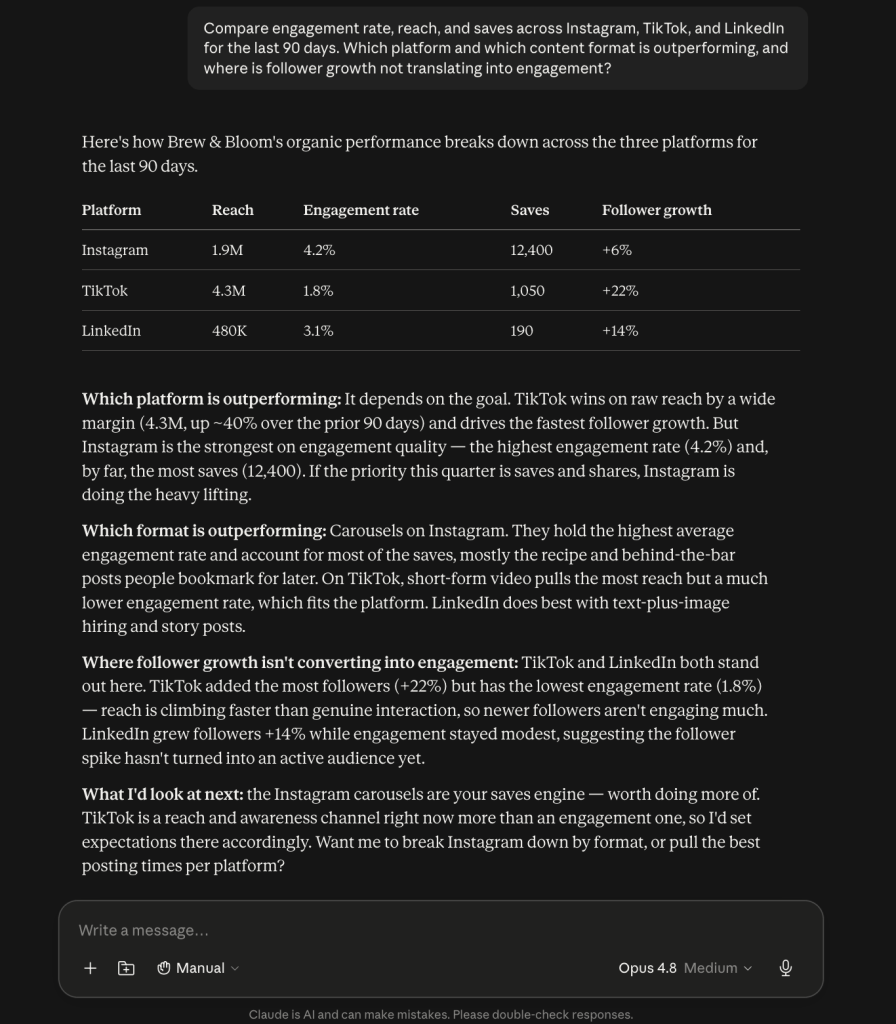
Compare engagement rate, reach, and saves across Instagram, TikTok, and LinkedIn for the last 90 days. Which platform and which content format is outperforming, and where is follower growth not translating into engagement?
Claude answers from the connected data and reads the numbers in plain words: TikTok drives the most reach and the fastest follower growth, but its engagement rate is the lowest, so newer followers aren’t interacting much. Instagram has the strongest engagement and, by far, the most saves, led by carousels. LinkedIn’s follower growth hasn’t turned into post engagement yet.

The manager can stop at this point or keep asking to narrow in on whatever stood out:
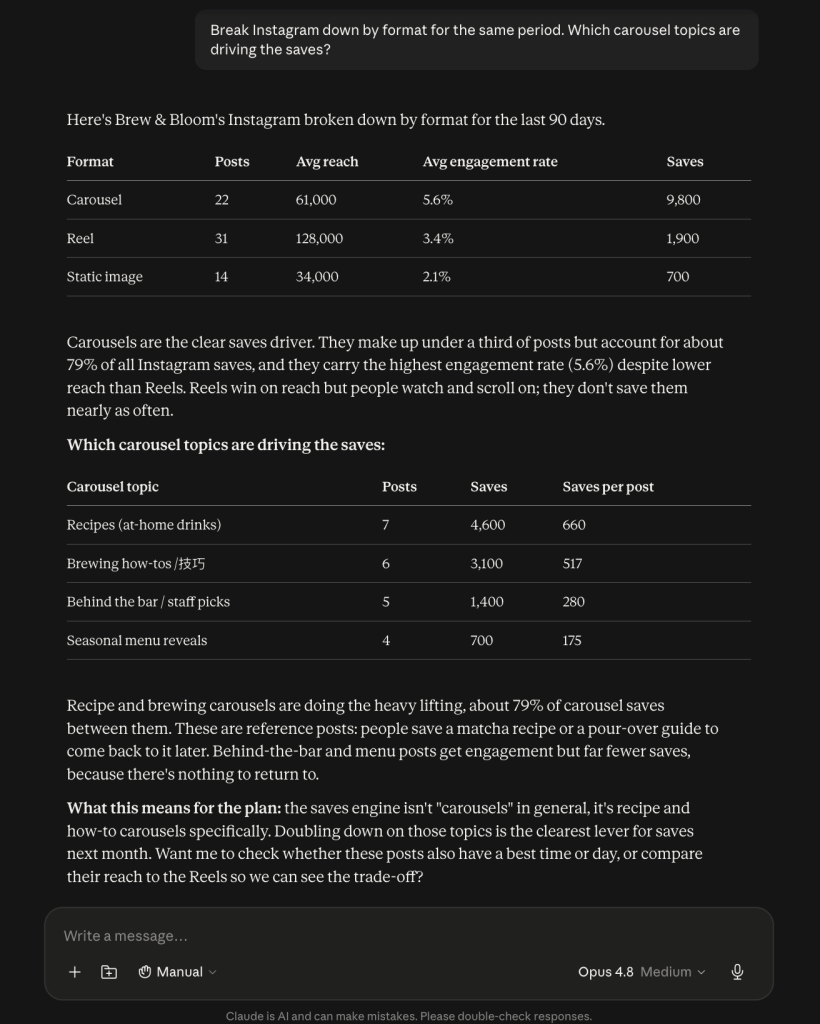
Break Instagram down by format for the same period. Which carousel topics are driving the saves?
Claude answers from the same data set, no new setup. A minute of follow-ups turns “Instagram is your saves engine” into “recipe carousels are the saves engine,” which is specific enough to brief into next month’s content.

That’s a cross-platform social media performance analysis with Claude, done in minutes and ready for the call.


Get the "why" behind your numbers with Claude & Coupler.io
Start your free trialThe 90-day review you just walked through is the kind of thing managers run every reporting cycle. Instead of rebuilding it each month, set it up once and rerun it in a line. Most of this reporting repeats on a cycle, and that repetition is where Coupler.io saves the most time. Your data refreshes on a schedule, so the same prompt always runs on the latest available numbers, and you never re-export anything. That’s what it takes to automate social media reporting with Claude: one saved prompt, always fresh data behind it.
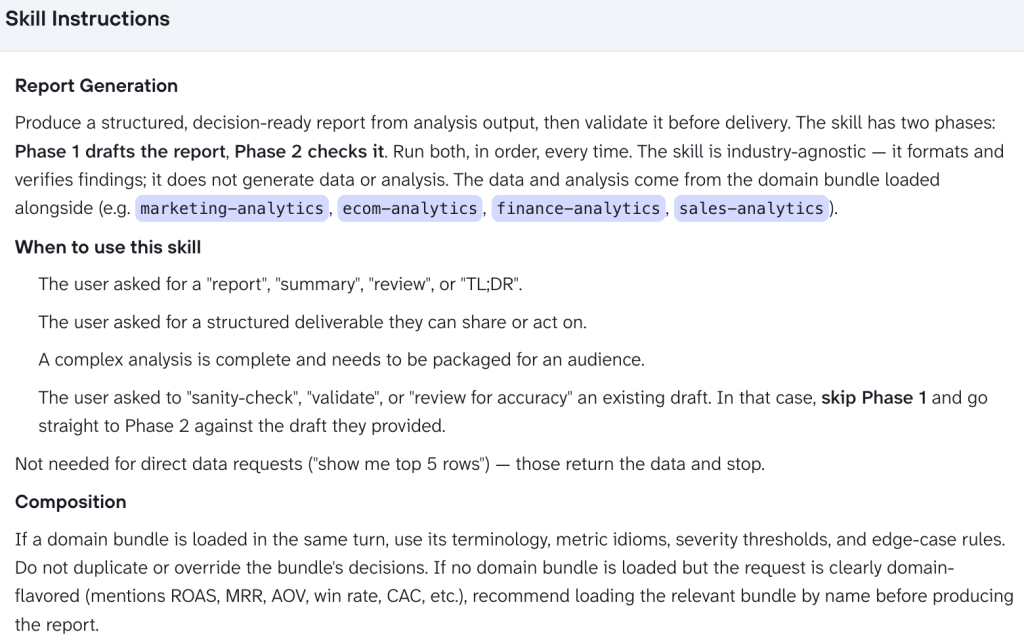
Your monthly client report comes out formatted, checked, and consistent without you rebuilding it, because Coupler.io’s report-generation Skill assembles it from the analysis. You get a structured summary, platform breakdown, notable changes, and recommendations with verified calculations. The format stays consistent month to month, which is what clients want to see.
To run that report every cycle without rebuilding it, give each client its own Claude Project. The Project holds the client’s context and saved report prompt and uses the Coupler.io connection you set up. The setup happens once. After that, running the report is a single line (for example, “Run the monthly report for Brew & Bloom“), and anyone on the team can run it. For an agency, that’s the difference between a reporting week and a reporting hour. Ten clients, ten Projects, one reusable prompt each, with the data staying up to date on its own.
The walkthrough showed how fast a single analysis is. The bigger question is whether it holds up as something you run every week, for every client. It does, and here’s what makes the difference.
Every channel in one place, and it stays that way.
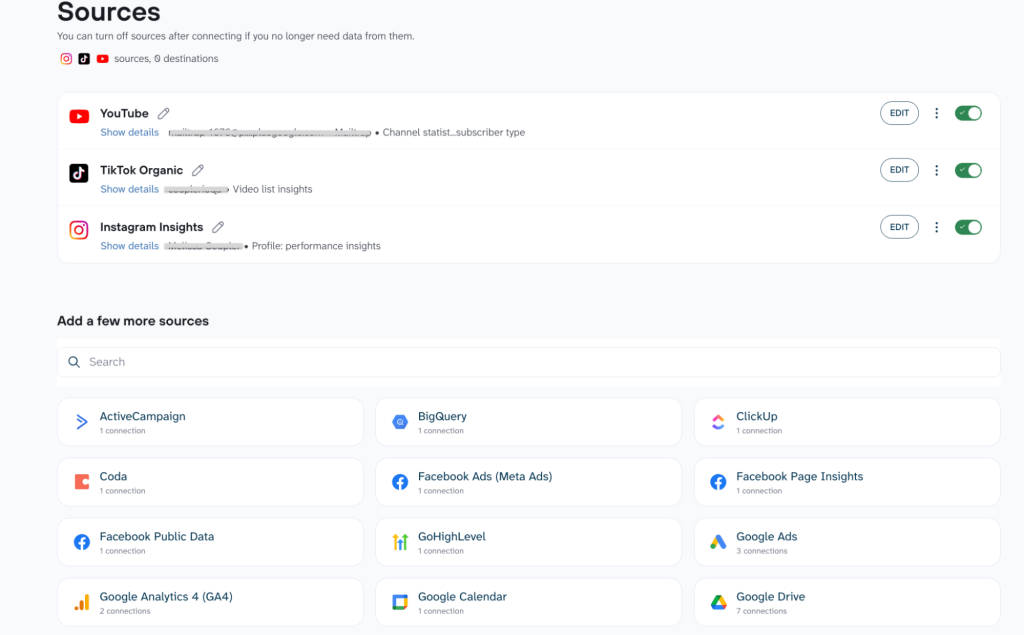
Most social reporting starts with four logins and four exports before you can say anything at all. With one connection, Instagram, TikTok, LinkedIn, and YouTube sit in the same place, and you compare them by asking a question, not stitching screenshots together. Coupler.io reaches 400+ sources, so when a client picks up a new channel or you take on a new account, it drops into the same view.

Numbers you can actually trust side by side.
Every platform calculates engagement in its own way, so their native rates were never really comparable, which quietly undermines a lot of cross-channel reports. With one engagement rate applied everywhere, a 4% on Instagram and a 4% on TikTok finally mean the same thing. You skip the normalization spreadsheet and the manual reconciling, and the comparison you put in front of a client holds up when they check it.
Context you set once, working in every answer.
The first time, you tell Claude what “saves” means, which platforms even have it, and what a strong engagement rate looks like for this niche. After that, you never restate it. Every question runs against that context, so Claude tells you whether a 3% is strong or weak for this account rather than reporting it in a vacuum, and a new teammate gets the same informed answers without learning the brief.

A client report that reruns itself.
The report you build this month is the one you’ll want next month, barely changed. Save it as a Coupler.io Skill, or use one from the library, and it comes back in a single line, so a reporting cycle that used to eat a morning of copy-paste takes a few minutes. It produces the same structure every time, which is exactly what clients want to see. Anyone on the team can run it.

Answers that are always up-to-date.
Because the connection refreshes on a schedule, every answer comes from the latest data. You never send a client a number and then wonder whether it came from last week’s export. For recurring reporting, that reliability is what separates a tool you check now and then from one your team depends on.
Coverage, comparable numbers, context that sticks, and reports you rerun: that’s the gap between a quick answer and one you’d put in front of a client.
With Coupler.io, you connect your business data to Claude through its MCP server (a protocol that lets Claude work with external tools and data). In the described setup, Claude queries your connected data in natural language, with no code on your side. That live connection plus plain-language querying is what Claude MCP social media analytics comes down to. The security lies in how Coupler.io implements the connection: it’s read-only, so when you analyze your social media performance with Claude, your data remains unchanged, and you control what to expose. The channel is encrypted, Coupler.io is SOC 2 Type II, GDPR, and HIPAA compliant, and data sent for analysis isn’t retained by Anthropic for training, which matters when the numbers belong to a client.
For the manager, Brew & Bloom is one of a dozen accounts, and the same MCP connection scales to all of them. Every client’s Instagram, TikTok, and LinkedIn reach Claude the same way, so she isn’t wiring up a fresh workflow per account or repeating CSV exports each reporting cycle. Freed from pulling and cleaning data, social media managers can act on what it shows, and the patterns Claude surfaces feed the next growth strategy: post more of what earns saves, and rethink what stalls.
One connection or a manual stopgap?
Pasting numbers or uploading a CSV works for a question you won’t ask again. For anything recurring, the Coupler.io connector is the only method that holds up. Here’s where each fits:
| Method | Setup effort | Data freshness | Best for |
|---|---|---|---|
| Coupler.io connector | One-time, no code | Refreshes on schedule | Recurring, multi-platform reporting |
| CSV export to Claude | Repeated each time | Stale at export | A single ad-hoc look |
| Copy-paste from dashboard | Very low, manual | Stale, one screen | A quick one-off question |
See what's working across all your channels with Coupler.io
Get started for freeBack at Brew & Bloom, the 90-day review was one long question. But a few questions come up every reporting cycle, and these are the ones the manager saves to reuse. They run on the same connected data, so Claude answers from recently refreshed, calculated numbers. Swap the platforms and dates for your own client.
1. Weekly performance summary
Every Monday, she turns the week’s numbers into a social media performance report she can send Brew & Bloom as-is:
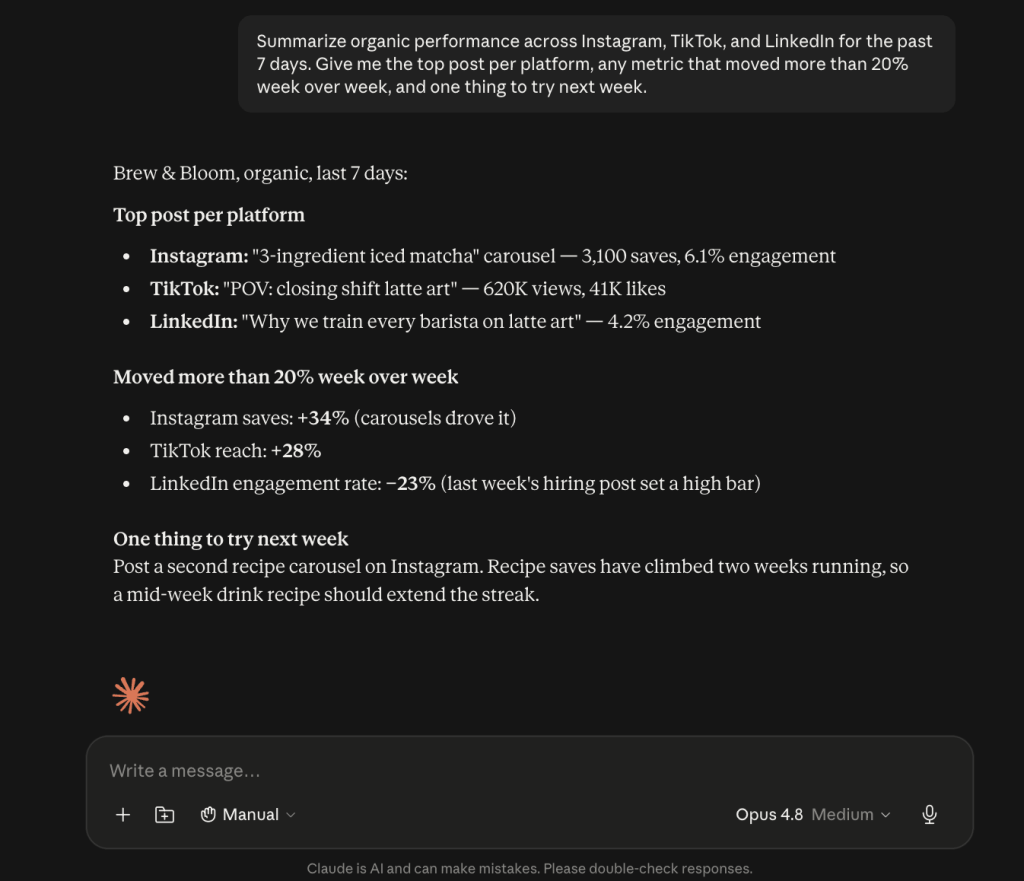
Summarize organic performance across Instagram, TikTok, and LinkedIn for the past 7 days. Give me the top post per platform, any metric that moved more than 20% week over week, and one thing to try next week.
Claude replies with a short written recap: the standout posts, the notable swings, and a suggestion for the week ahead. Use it to decide what to flag on the client call and what to test next.

2. Content format breakdown
Discover which format to make more of:
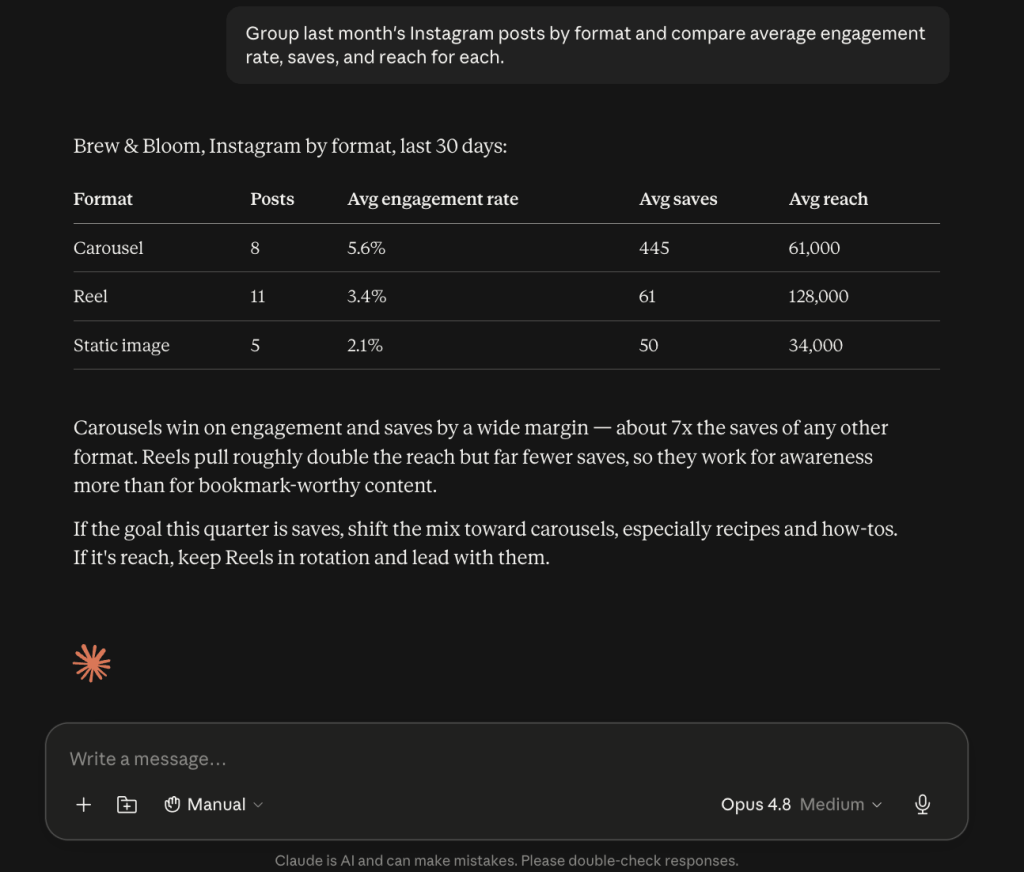
Group last month's Instagram posts by format and compare average engagement rate, saves, and reach for each.
Claude ranks the formats by metric. You might find carousels win on saves while Instagram Reels pull more reach. From there, you shift the content mix toward whichever matches the client’s goal.

3. Engagement anomaly detection
Catch the outlier before the client asks about it:
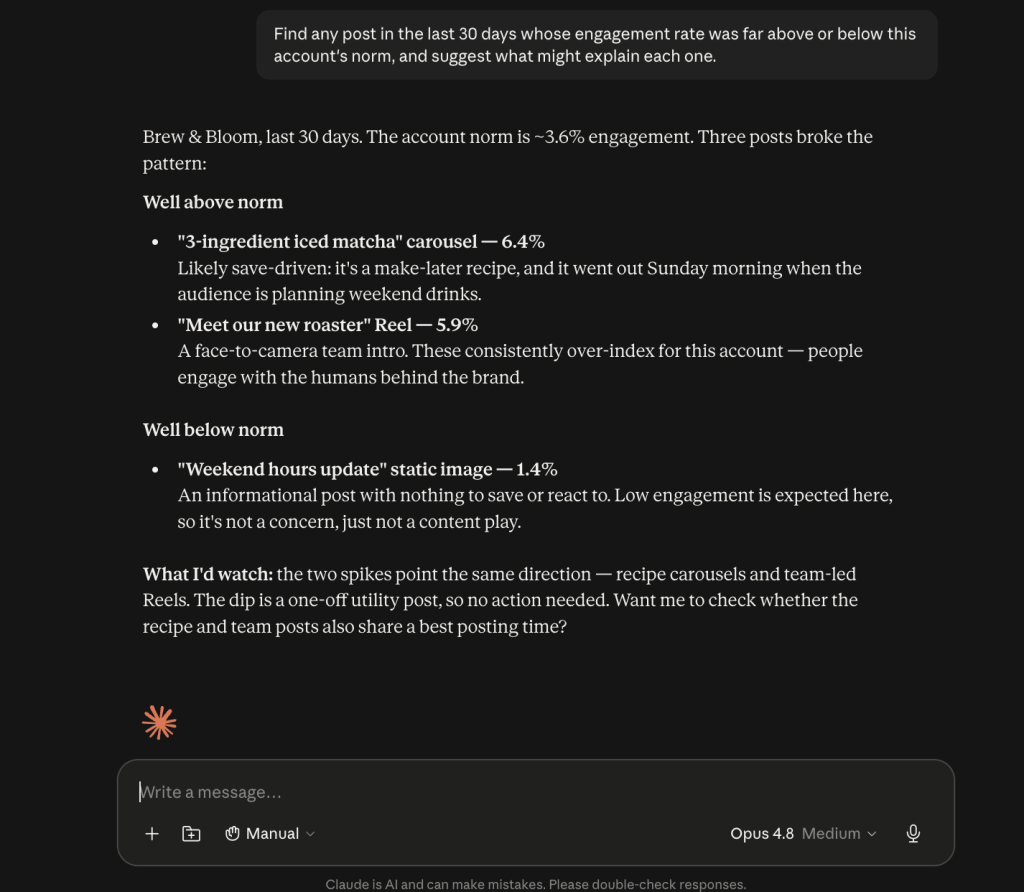
Find any post in the last 30 days whose engagement rate was far above or below this account's norm, and suggest what might explain each one.
Claude flags the posts that broke the pattern and offers a likely reason for each. You can look into what coincided with a spike, and catch a dip before it becomes a trend.

Prompts like these cover the everyday work. The real value of these Claude prompts for social media analysis is that you save the good ones and stop rewriting them.
Go from raw metrics to an AI report in minutes with Coupler.io
Try it for freeWith Brew & Bloom’s data flowing into Claude, the analysis is only as good as the questions the manager asks. Connecting your data to Claude removes the busywork, but it doesn’t make every answer correct on its own. The quality still depends on how you frame the question and what you tell Claude about the account. A few habits trip up teams new to Claude AI for social media analysis, and each one is easy to avoid once you know it’s there. Here are the common ones and what to do instead.
| Mistake | What goes wrong | How to avoid it |
|---|---|---|
| Date ranges too short | A 3-day window reads one viral post as a trend | Ask for at least a few weeks of data, so a single strong post doesn’t skew the whole picture. |
| No business context | Claude doesn’t know the client’s goals or benchmarks | State the goal and what “good” looks like in Coupler.io’s Context |
| Treating every insight as urgent | Not every swing needs a response | Ask Claude what’s worth acting on, not just what changed |
| Reporting numbers before verifying | A wrong figure in a client report costs trust | Let Coupler.io’s Analytical Engine calculate, so figures hold up |
One caveat worth stating: pre-calculated metrics still depend on your source data. If a platform changes a metric definition or a connector misses a field, clean math on top won’t fix it. Coupler.io keeps the calculations consistent, but the inputs are still yours to get right (the source data, the metric definitions, and the date range you choose).
Handle these, and AI social media analytics becomes something to rely on because you stop second-guessing every figure before it goes out.
Pick one client and connect their channels this week. The first review takes a few minutes; after that, every Monday’s report is a single question away, and the setup earns its keep the first time you skip a morning of exports. That’s social media analytics with Claude.ai in practice: less time assembling numbers, more time deciding what to do with them.
Turn a reporting morning into a single question
Get started for free