Power BI can pull data from a wide range of business apps, and for most sources, the connection is quick. But not every app your team relies on has a native Power BI connector, and that gap can quietly hold your reporting back. I’ve tested four methods to connect data to Power BI and laid them out below, from a no-code option that takes minutes to a fully custom build.
TL;DR: Choose the right method for your team
The right choice depends on where your data lives, who on your team will set it up, and how much time you want to spend. Here is a quick look at all the methods:
| Method | Best for connecting | Technical skills needed | Setup time |
| Coupler.io | SaaS apps — ad platforms, CRMs, ecommerce, finance | None | Minutes |
| Built-in connectors | Microsoft ecosystem — SQL Server, Excel, SharePoint, Dataverse | Low | Minutes to hours |
| Dataflows | Teams sharing data across multiple reports on Pro or Premium | Low to Medium | Hours |
| APIs and custom connectors | Proprietary internal systems with dev team support | High | Days to weeks |
Here is a bit more detail on each:
Coupler.io is a no-code integration and AI analytics platform that connects Power BI to over 400 business apps, including ad platforms like Facebook Ads, CRMs like HubSpot, ecommerce tools like Shopify, finance apps like QuickBooks, and more. It handles data collection, blending, and automated delivery to Power BI on a schedule, no developer needed.
Built-in connectors are native connectors available in Power BI. They work well if your data already lives in Microsoft tools like SQL Server, Excel, SharePoint, or Dataverse. No extra setup required.
Dataflows are a cloud-based data preparation layer built directly into the Power BI Service. They are a good fit when multiple reports across your team need to pull from the same data source with the same transformations applied every time.
APIs and custom connectors are for engineering teams connecting Power BI to systems with no existing connector available anywhere else, like an internal ERP, a proprietary database, or a legacy tool your company built in-house. This method gives you full control, but it’s time-intensive to build and maintain.
Method 1: Connect your business apps with Power BI using Coupler.io
Your business probably runs on more tools than Power BI can natively connect to. Your ad data lives in Google Ads or Facebook Ads, your CRM runs on HubSpot, and your finances sit in Xero or QuickBooks Online. I’ve found that getting all of that into Power BI without a proper integration takes way more effort than it should.
Coupler.io connects all of those to Power BI without code. The setup of Power BI integrations takes three steps. You choose your data sources, combine and transform the data, and Coupler.io delivers the result to Power BI on a schedule you set. Once the data is ready, you can focus on building visuals without extra preparation.
Step 1: Collect your source data
You can try it out right away for free. Select your data source in the form below and click Proceed. You’ll be offered to create a Coupler.io account with no credit card required.

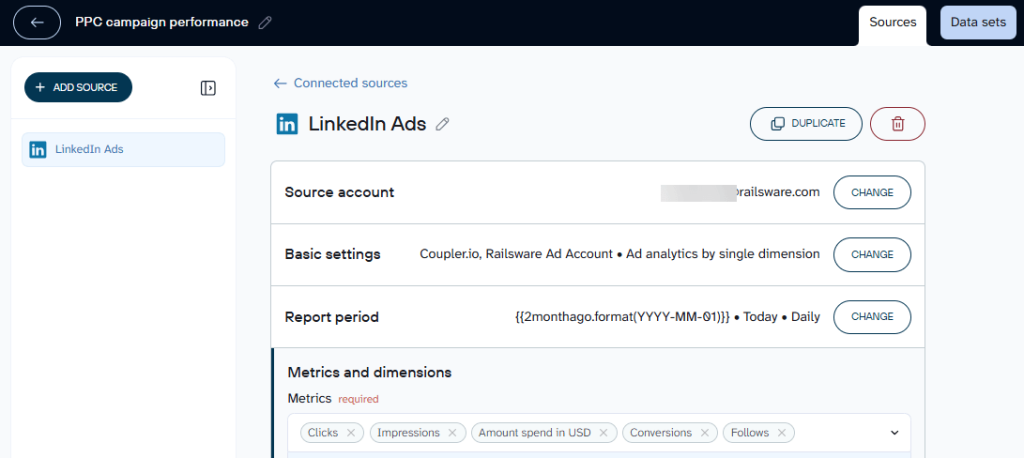
Connect your source account. Once authorized, specify what data you want to extract. For example, for LinkedIn Ads, you select your ad account, pick your metrics, and set a date range.

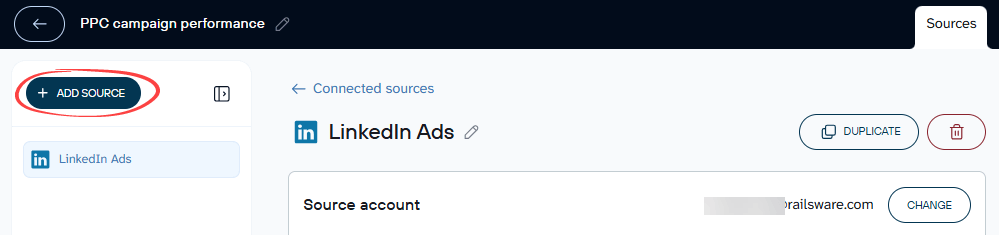
You can add multiple sources to a single data flow. Click the Add Source button and connect each new app the same way. This lets you gather Power BI data from several tools and combine it.

Coupler.io shows a live preview of up to 500 rows once your sources are connected, so you can confirm the data looks right before moving forward.
Step 2: Blend and organize your data before it reaches Power BI
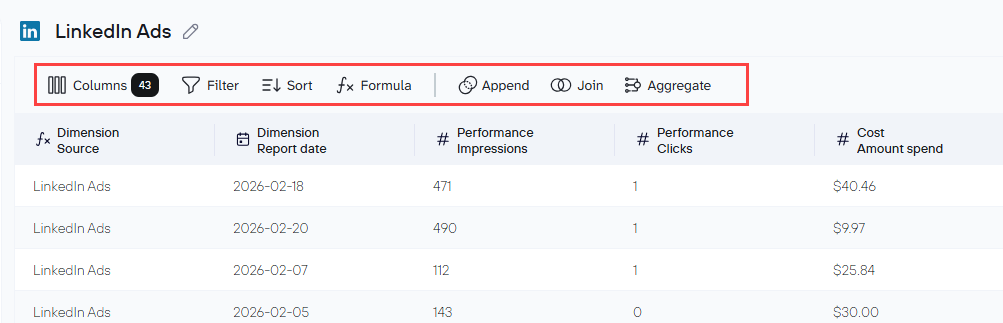
In the Data Sets tab, you can filter rows, sort data, rename and reorder columns, change data types, and create calculated fields using formulas. For combining data from multiple sources, use Append or Join.

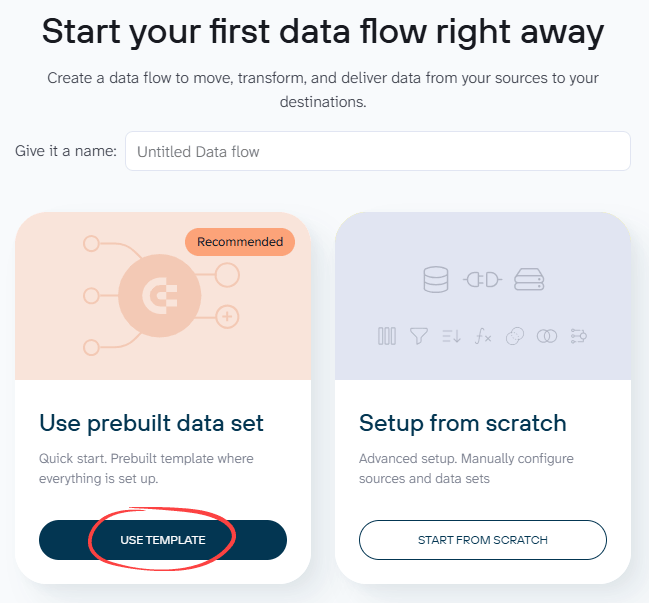
If you’d rather skip the manual setup, Coupler.io offers data set templates for popular sources and common reporting combinations. When creating a new data flow, you can choose to start from a template instead of building one from scratch.

Templates are available for both single and multiple sources and organized by category: marketing, finance, sales, and ecommerce. A PPC campaign performance template, for example, pulls from Google Ads, Facebook Ads, LinkedIn Ads, and other ad platforms simultaneously. The Append logic is configured for you, so all campaign data lands in one unified table with columns aligned across sources.

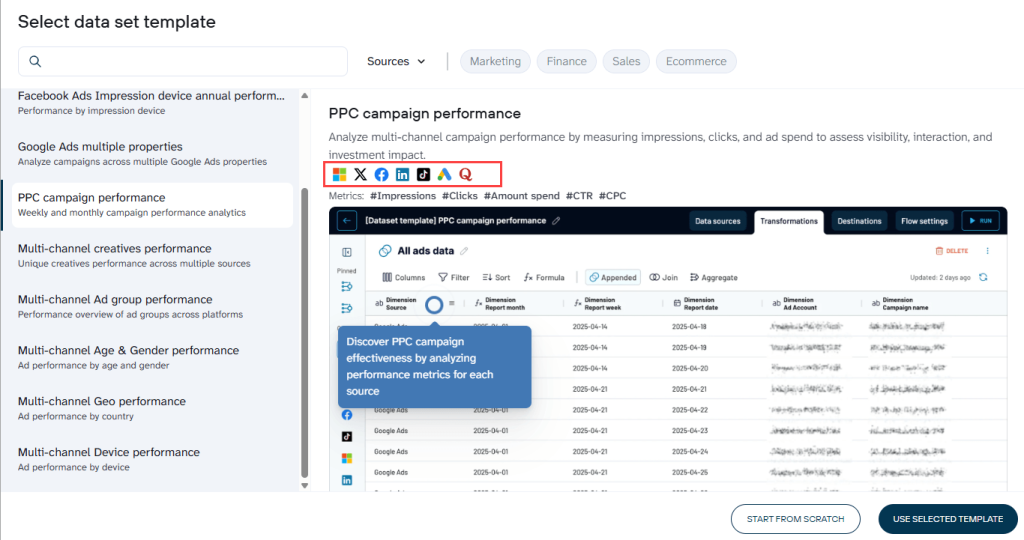
All you do is pick a template and connect your accounts. The data arrives in Power BI already structured and ready for DAX measures and visuals
Step 3: Set your refresh schedule and send data to Power BI
In your Power BI destination setup, generate an Integration URL for your output dataset and copy it.


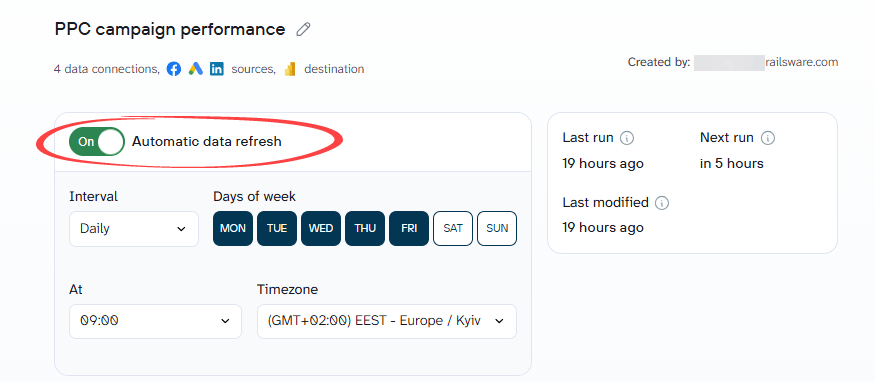
Then head to the Flow settings tab, enable the Automatic data refresh toggle, and choose how often you want Coupler.io to pull fresh data from your sources. Refresh frequency ranges from once a month to every 15 minutes depending on your plan.

Click Save and Run.
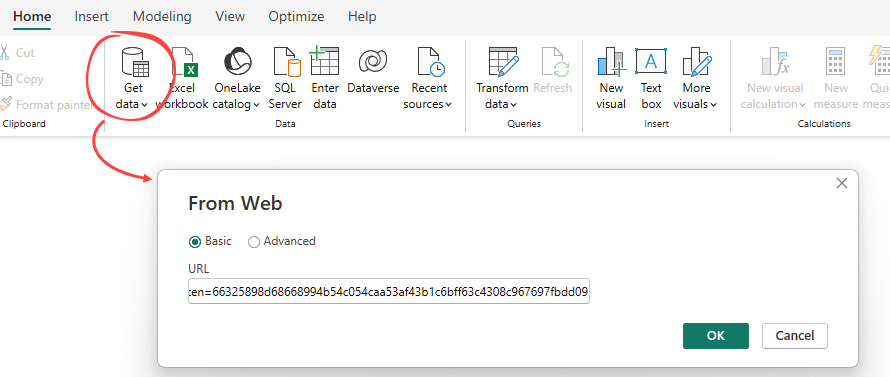
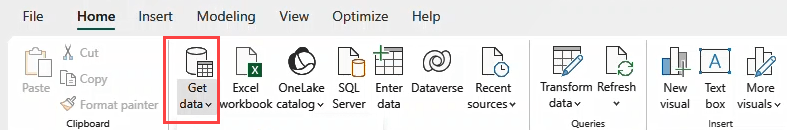
Now open Power BI Desktop. In the Home ribbon, click Get Data and select Web from the options. Paste your Integration URL into the dialog and click OK. Power BI fetches your data and opens it in the Power Query Editor, where you can review the structure before loading it.

When everything looks right, click Close and Apply. Your dataset loads into Power BI and you’re ready to start building your report.
Bonus: Ask questions about data with Coupler.io’s AI Agent
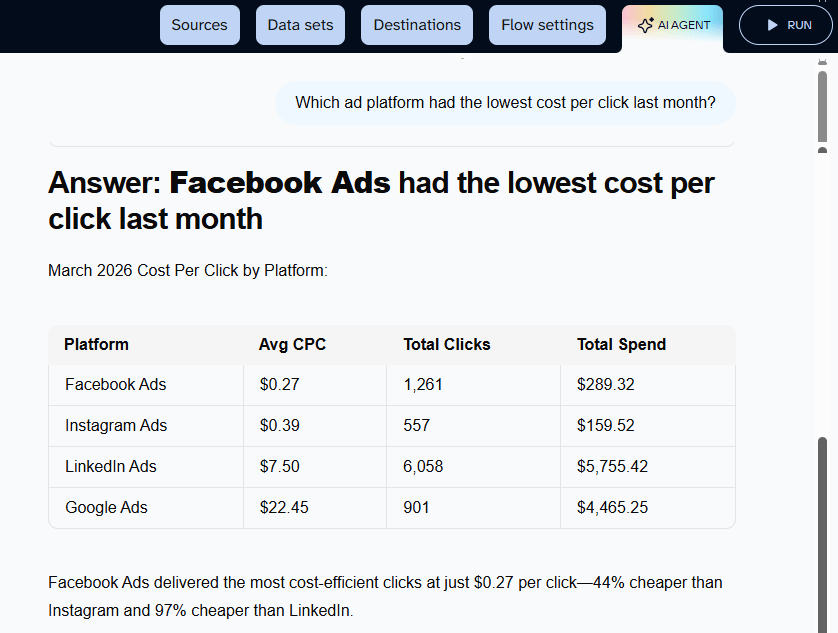
Once your data is connected, Coupler.io’s AI Agent lets you explore it in plain English before committing to a full dashboard build.
Ask questions like:
Which channel generated the most clicks last month?What is the total ad spend by platform?How do clicks and impressions compare across Google Ads, Facebook Ads, and LinkedIn Ads?
The Agent passes your query to Coupler.io’s Analytical Engine, which runs the calculation, checks the results, and returns a clear answer instantly.

From there, you can continue with follow-up questions to dig deeper or refine the analysis.


Connect 400+ data sources to Power BI with Coupler.io
Get started for freeTurn your business data into Power BI visualizations with templates
Once your data is connected, Power BI gives you full flexibility to build the reports your team actually needs. You can start from scratch and design your own visuals, or use pre-built dashboard templates to get a working report up faster. I’ll walk through a few examples to show what becomes possible once your data is flowing in.
PPC multi-channel comparison table
For marketing and PPC teams, one of the most valuable views you can build in Power BI is a single table that brings every paid channel together in one place.
Facebook Ads, Google Ads, LinkedIn Ads, Twitter Ads, Instagram Ads, TikTok Ads, Quora Ads, and Bing Ads all appear side by side, with a grand Total summarizing performance across all platforms. Each row is a platform while each column is a metric including impressions, clicks, spend, CTR, CPM, and CPC.

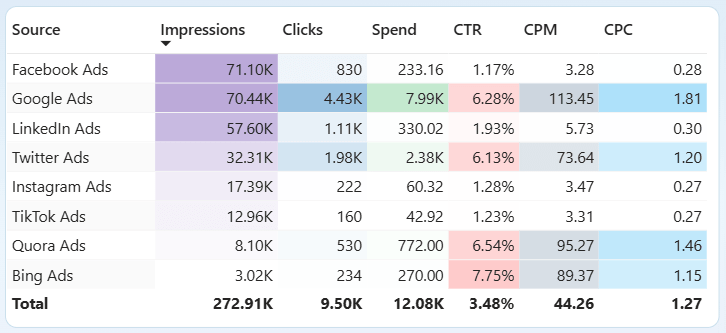
Building this from scratch means connecting each ad platform, appending the data into one unified table, and aligning column names across sources. Coupler.io’s PPC multi-channel dashboard template does all of that for you. The data pipeline, the blending, and the report structure are already set up.
Ecommerce product performance
Connect Shopify to Power BI and you get a clear picture of which products are driving your revenue. A horizontal bar chart ranking your top products by net sales makes it immediately obvious where to focus inventory investment, promotional spend, or restocking decisions.
You can build this data visualization yourself once your Shopify data is loaded. It’s a straightforward bar chart in Power BI with products on Y-axis and net sales on the other.

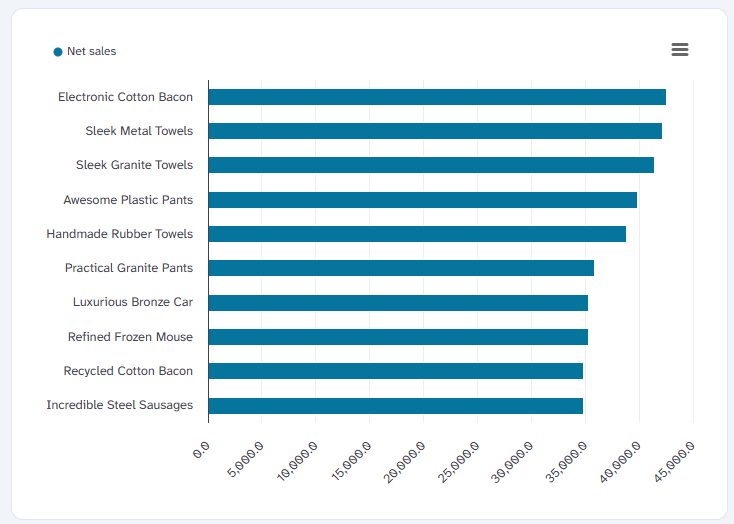
If you’d rather skip the data preparation and go straight to the insight, Coupler.io’s Shopify orders dashboard template pre-configures the pipeline so product names, sales figures, and date fields arrive in Power BI already structured and ready to visualize.
Sales pipeline overview
Pull data from Salesforce or HubSpot into Power BI and build a live view of your pipeline broken down by deal stage and type. The stacked bar chart below shows pipeline value across different stages, with each bar segmented by deal type, such as Partnership, Reactivation, Remarketing, etc.

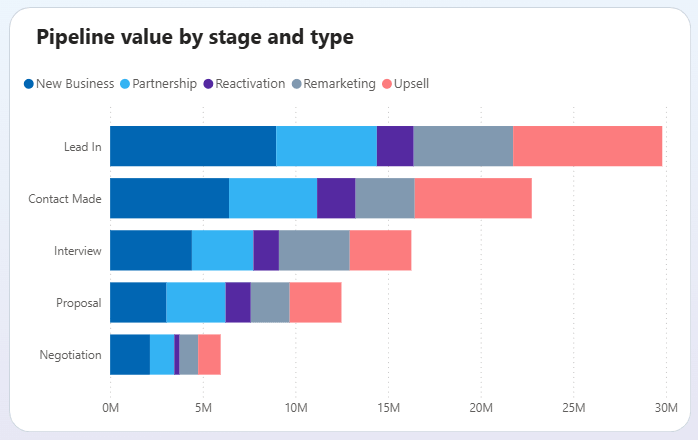
Once you load data to Power BI from your CRM, this kind of view is straightforward to build.. The bigger time saving is on the data side. Coupler.io’s Salesforce CRM dashboard template handles the connection, structures the data, and delivers a ready-to-use report so you can skip straight to the analysis.
Method 2: Import data to Power BI with built-in connectors
Power BI includes native data connectors built directly into the application. These connectors are accessible from the Get Data menu. If your data lives in a supported source, this is the most direct way to import data to Power BI.
How many data sources can Power BI connect to
Power BI supports over 190 native data sources across seven categories:
| Category | Example connectors |
| Files | Excel, CSV, JSON, XML, PDF, Parquet |
| Databases | SQL Server, MySQL, PostgreSQL, Snowflake, BigQuery, Oracle |
| Microsoft Fabric | Lakehouses, Warehouses, KQL Databases |
| Power Platform | Dataverse, Dataflows |
| Azure | Azure SQL, Blob Storage, Data Lake, Synapse Analytics |
| Online Services | Salesforce, Google Analytics, SharePoint list, Dynamics 365, Zendesk, Adobe Analytics |
| Other | OData, ODBC, Web, R Script, Python Script |
This coverage works well for teams that rely on Microsoft tools. Sources like SQL Server, Excel, SharePoint list, and Dataverse connect smoothly and are fully supported in both Power BI Desktop and the Service.
For data that lives on a local server or on-premises database, you will need to install an on-premises data gateway before scheduled refresh will work through the Power BI Service. Cloud sources like Azure SQL, Snowflake, and Salesforce do not require a gateway.
Limitations appear with many modern SaaS tools. There is no native connector for platforms like:
- Shopify, WooCommerce, and other ecommerce tools
- HubSpot and most CRM platforms beyond Salesforce
- Google Ads, Facebook Ads, LinkedIn Ads, and other ad platforms
- Stripe and QuickBooks Online. The QuickBooks Online connector was removed in August 2025 due to authentication changes. If your reports depended on it, refresh would no longer work.
If your source isn’t on the native list, use Coupler.io to connect data to Power BI without code or complex setup. It covers over 400 business apps, including all the platforms listed above.
Automate reporting in Power BI with Coupler.io
Get started for freeHow to get data using connectors
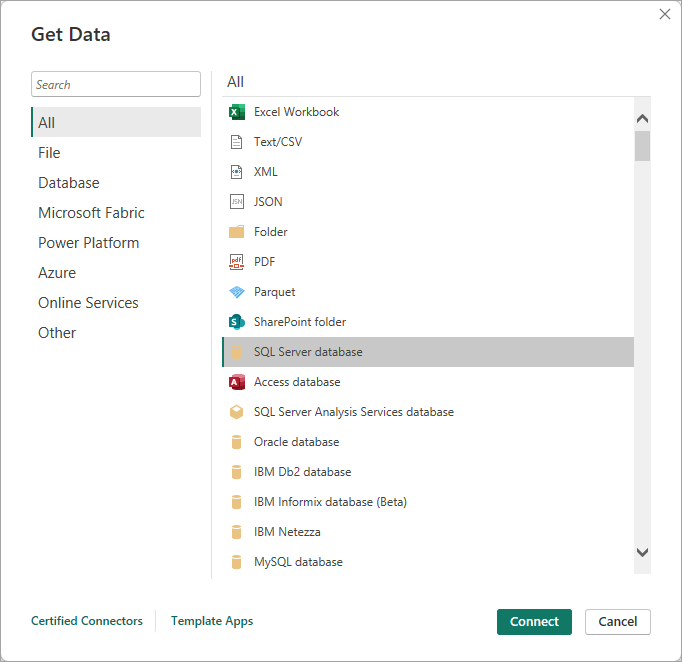
Step 1: Open Get Data
Open Power BI Desktop and click Get Data in the Home ribbon. A dialog will appear showing all available connectors organized by category.

Step 2. Select and authenticate your source
Find your data source in the list or search by name. Select it and click Connect.

Depending on the source, you will either enter your database credentials or follow an authentication flow to connect your account.

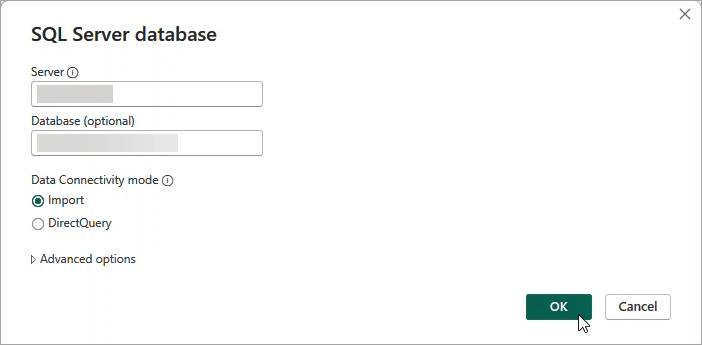
For database sources like SQL Server, this is also where you choose your connection mode.
- Import copies a snapshot of your data into Power BI’s in-memory engine, which gives you fast-loading visuals and full DAX support.
- DirectQuery keeps a live connection to your source, so every visual interaction queries the underlying data in real time.
Not all connectors support both modes. File-based sources like Excel and CSV are Import only. For database sources that do support both, Import is the better default for most reporting needs. Switch to DirectQuery only if your team genuinely needs real-time data and your source can handle the additional query load.
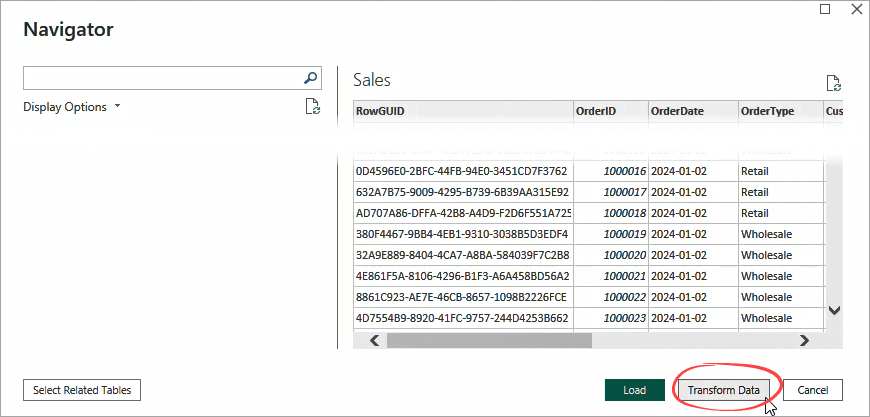
Step 3: Load data into Power BI
You will see a preview of your data. Click Transform Data to open the Power Query editor if you want to clean, filter, or reshape the data before it loads.

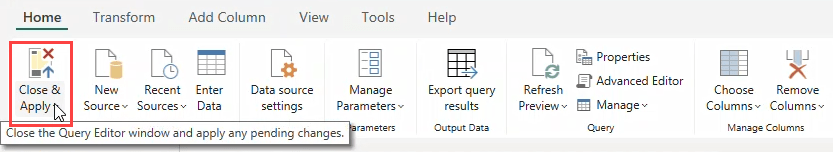
Once everything looks right, click Close and Apply. This is how you load data to Power BI and get it ready for building your report.

Method 3: Load data to Power BI using Dataflows
Dataflows are a cloud-based data preparation layer built directly into the Power BI Service. They run entirely in the browser with no Power BI Desktop installation needed. The transformation interface uses Power Query Online, which works in a familiar way to Power BI Desktop. Some advanced features behave differently in the browser environment, but the core experience is the same.
Learn more about how to transform data in Power BI.
The main advantage of dataflows is reusability. When you connect data to Power BI directly from each report, every report manages its own connection, applies its own transformations, and runs its own refresh separately. If five reports need the same data prepared the same way, that work happens five separate times. Updating the logic means touching every report individually.
Dataflows move that preparation to one shared place. You define the transformation logic once. Every report that connects to it gets the same clean, consistent data. Update the dataflow and all connected reports benefit automatically.
When to use dataflows
Use dataflows when multiple reports need to pull from the same source with the same preparation logic applied. Before setting one up, confirm two things:
- You are working in a shared workspace. Dataflows are not available in personal workspaces (My Workspace).
- Your license level supports the features you need.
Power BI currently has two generations of dataflows.
- Dataflow Gen1 works with Pro, PPU, and Premium licenses but is now in legacy status with no new features planned.
- Dataflow Gen2 is the current version built on Microsoft Fabric.
Microsoft recommends Gen2 for all new projects. The steps below use Gen2.
How to create a dataflow
Step 1. Create your dataflow
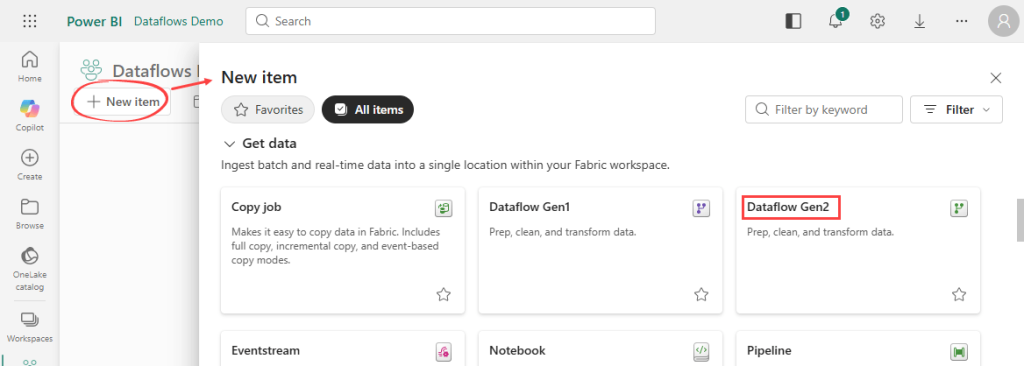
Navigate to your shared workspace. Click New item and select Dataflow Gen2.

Give your dataflow a name and click Create. The Power Query Online editor opens automatically.
Step 2. Connect, transform, and load your data
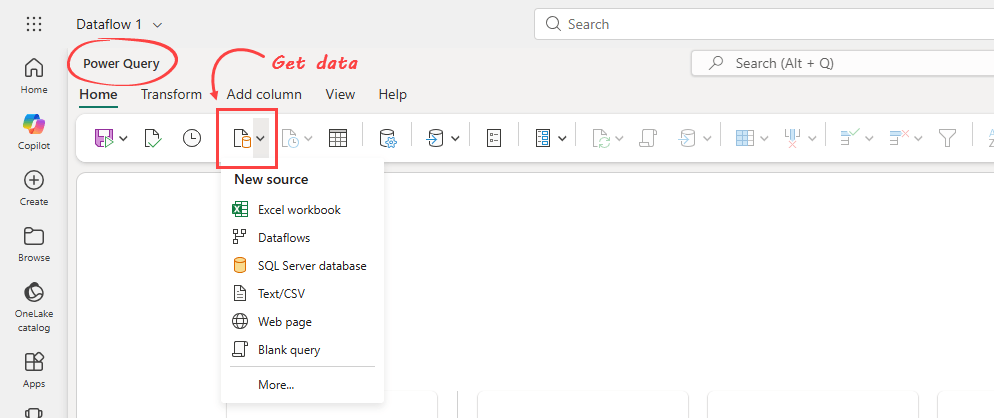
In the Power Query Online editor, select Get Data. Choose your data source from the connector list, enter your connection details, and authenticate. Select the tables you need and click Create.
Apply any transformation you need in the editor. You can filter rows, rename columns, change data types, or merge queries. The interface works in a familiar way to Power Query in Power BI Desktop.

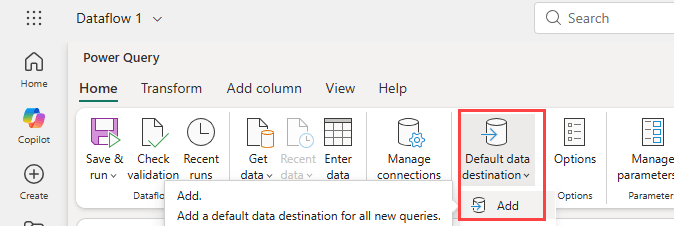
Before finishing, set your data destination. In the Home ribbon, select Add data destination. For Power BI reporting, Lakehouse is the most common choice. Select your workspace, choose or create a table name, and save the destination settings.

When everything is configured, click Save & run in the Home ribbon.
Step 3. Set your refresh schedule
Back in your workspace, find your dataflow and click the ellipsis next to it. Select Schedule. Set your refresh frequency, time zone, and preferred times, then apply.

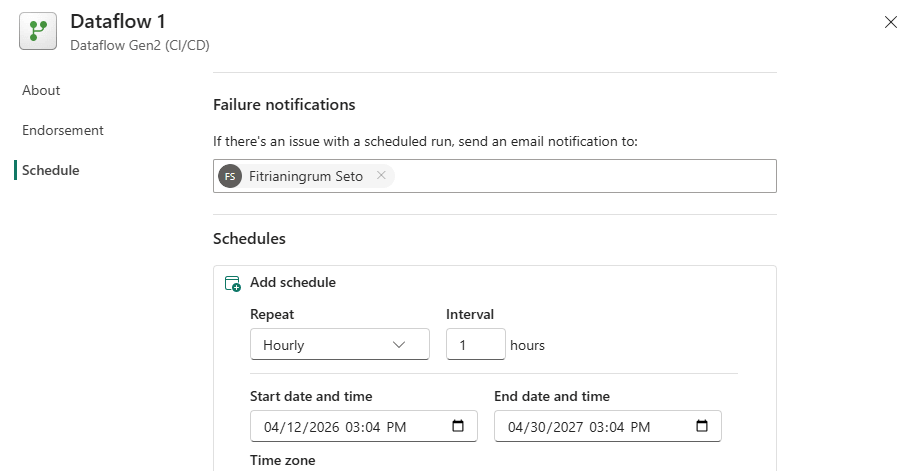
Your dataflow will pull fresh data automatically on that schedule.
Method 4: Load data to Power BI using APIs and custom connectors
If your data source has no existing connector and you have a development team to build and maintain one, this is the route for you.
The first requirement is an API. Power BI connects to external systems by sending requests to an endpoint and receiving data back. If your internal system does not already expose an API, your development team will need to build and publish one first. Without that access point, there is nothing for Power BI to connect to.
Once the API is in place, you have two ways to connect it to Power BI.
- The built-in Web connector handles straightforward API calls without any custom development.
- For more complex sources with authentication requirements or large datasets, building a custom connector using the Power Query SDK gives you a proper, reusable integration that behaves like any other native source in Power BI.
How to build a custom connector
Step 1. Install the Power Query SDK
Start by installing the Power Query SDK for Visual Studio Code. This is the official Microsoft toolkit for building custom Power BI connectors.
Step 2. Write the connector logic
Write the connector using M language, which is Power Query’s underlying formula language. The code defines how Power BI authenticates with a source and retrieves data. You’ll need solid experience with authentication flows and API pagination to get this right.
Microsoft maintains a library of connector samples and patterns on GitHub that you can use as a starting point.
Step 3. Build and deploy the connector
Once complete, the connector is packaged into an extension file and placed in a designated Custom Connectors folder on your machine. Before it can be loaded in Power BI Desktop, a security setting needs to be adjusted to allow uncertified extensions. See Microsoft’s connector extensibility documentation for the full setup steps.
Step 4. Publish and maintain
A report built on a custom connector needs a configured on-premises data gateway before it can refresh automatically in the Power BI Service. You are also responsible for maintaining the connector over time as the source API or authentication method changes.
Best practices for connecting business data to Power BI
A reliable data connection is the foundation of any useful Power BI report. Once you use Power BI to connect with your project data, how you maintain that connection determines whether your dashboards stay accurate over time. I’ve seen plenty of reports go stale because of small oversights, so these tips are worth reading before you pick a method.
Know your refresh limits before you choose a method
Refresh limits in Power BI apply to Import mode only. DirectQuery queries the source live on every visual interaction, so no scheduled refresh is needed.
For Import mode, limits vary by license:
- Power BI Pro allows up to eight scheduled refreshes per dataset per day with a minimum 30-minute gap between each
- Power BI Premium and Premium Per User allow up to 48 per day. The built-in scheduler still enforces 30-minute intervals, but shorter intervals are achievable via Power Automate or the Power BI REST API
For most business teams, eight refreshes per day is more than enough. If your team needs updates every 30 minutes throughout the day, that requires a Premium license. For truly live data, DirectQuery is the right choice over scheduled refresh entirely.
If you use Coupler.io, it handles the data preparation on its own schedule. Power BI simply picks up the latest data whenever its next scheduled refresh runs.
Default to Import mode and switch to DirectQuery only when you have a clear reason
Import mode copies your data into Power BI’s in-memory engine, which gives you fast-loading visuals and full DAX support.
DirectQuery keeps a live connection to your source, but it runs a fresh query every time a visual loads. Depending on how your source system handles that load, this can slow reports down noticeably.
For most business reporting needs, Import mode is the right default. Switch to DirectQuery only if your team genuinely needs to see data as it changes in the source and your source system can handle the additional query volume without performance issues.
Avoid Beta and Preview connectors in production reports
Power BI labels connectors as Generally Available, Preview, or Beta. Microsoft explicitly advises against using Beta or Preview connectors in production environments because they can change, break, or disappear without notice.
The QuickBooks Online connector is a direct example of this risk. It carried a Beta label throughout its existence and was fully removed by Microsoft in August 2025 with no replacement planned. Finance teams who had built dashboards around it found their scheduled refreshes permanently broken overnight.If you rely on a connector that carries a Beta or Preview label for a business-critical report, have a contingency plan ready.
For sources without a stable connector, Coupler.io is a safer long-term foundation. It covers QuickBooks Online and hundreds of other business apps that lack a native Power BI connector, without the stability risks that come with Beta connections.
Connect your data to Power BI with Coupler.io
Get started for freeKeep your data source credentials updated
Expired credentials are one of the most common causes of scheduled refresh failures in Power BI Service. For example, when you update a password in a source system, update the matching credentials in Power BI Service at the same time. If you miss this, Power BI stops refreshing and your report quietly shows outdated data while your team continues using it.
Consider Power Automate for event-driven data
You can use Power Automate to trigger a Power BI dataset refresh based on a specific event rather than a fixed schedule. For example, you can set a flow to refresh your dataset automatically when a file is updated in SharePoint or when a form is submitted. The Power BI connector in Power Automate handles this without code. It is a practical option for teams who want their reports to update in response to real-world events rather than waiting for the next scheduled refresh window.
Start from a template rather than a blank report
Coupler.io connects over 400 business apps to Power BI without code.
Beyond the connection itself, dataset templates take care of the data structure before anything loads, so your data arrives ready to visualize rather than requiring manual setup. If you want a complete report from day one, over 20 Power BI templates are available across marketing, sales, ecommerce, and finance.
For more complex reporting needs or a custom setup, Coupler.io’s consulting team can build dashboards and data pipelines tailored to your business.