Your Facebook Page has been publishing content for months, maybe years. The data is all there: reach by post type, follower trends, engagement rates by day, video view depth. What you don’t have is a fast way to pull clear information that actually guides decisions.
All you need is to connect Facebook Page Insights to Claude using the Coupler.io connector. This way, you won’t spend an hour manually comparing last month to the month before. Just bring data into Claude and ask it directly.
Choose the right method to load Facebook Page Insights data to Claude
| Connection method | Setup effort | Who does the math | Best for | Watch out for |
|---|---|---|---|---|
| Coupler.io | Low; no code | Coupler.io’s Analytical Engine | Recurring analysis, multi-page management, cross-channel reporting | Requires a paid plan for scheduled refreshes |
| Manual export | Low for one-off | You clean the export, then Claude works with the uploaded file | Quick one-time analysis | Data goes stale immediately; breaks for recurring use |
| Third-party MCP connector (e.g., Windsor.ai, Porter Metrics) | Low; authorize in Claude | Claude | When raw live data is enough, and custom metric definitions aren’t needed | Less control over data preparation and transformation |
| Custom MCP server | High; requires development | Your MCP layer controls the data and tool access | Internal tools, custom data logic | Build and maintenance cost; needs engineering capacity |
| API scripts / function calling | High; requires coding | Your code prepares the data before Claude receives it | Automated pipelines with full control | Engineering build time; ongoing maintenance |
For one-time analysis, a manual export works. If you need live conversational lookups from a single page, Coupler.io gets you there with minimal setup. It lets you connect Facebook Page Insights to Claude for recurring analysis across multiple pages, or when you want to combine Page Insights with other data, like ad spend or CRM activity.


Analyze your Facebook Page Insights data in Claude with Coupler.io
GET STARTED FOR FREEConnect Facebook Page Insights to Claude with Coupler.io
Think of Coupler.io as the layer between your Facebook Page and Claude. It’s a data integration platform and AI analytics solution. It extracts your Page Insights, runs calculations through the Analytical Engine, and delivers processed results to Claude on a schedule.
With the Facebook Page Insights data connector, Claude receives clean, pre-aggregated data, not raw API output it has to make sense of on its own. When you send a large Page Insights dataset directly to Claude without having it processed first, you risk getting answers that look right but aren’t.
For Facebook Page Insights specifically, Coupler.io addresses a structural problem in Meta’s reporting: if you manage more than one Facebook Page, whether for different brands, markets, or clients, there is no native way to get a combined view. Coupler.io pulls data from multiple pages into a single structured dataset, standardizes the metrics, and hands it to Claude.
Step 1: Create a data flow for Facebook Page Insights data
Sign up for a free Coupler.io account and create a new data flow with Facebook Page Insights as your source. Or use this interactive form right away:

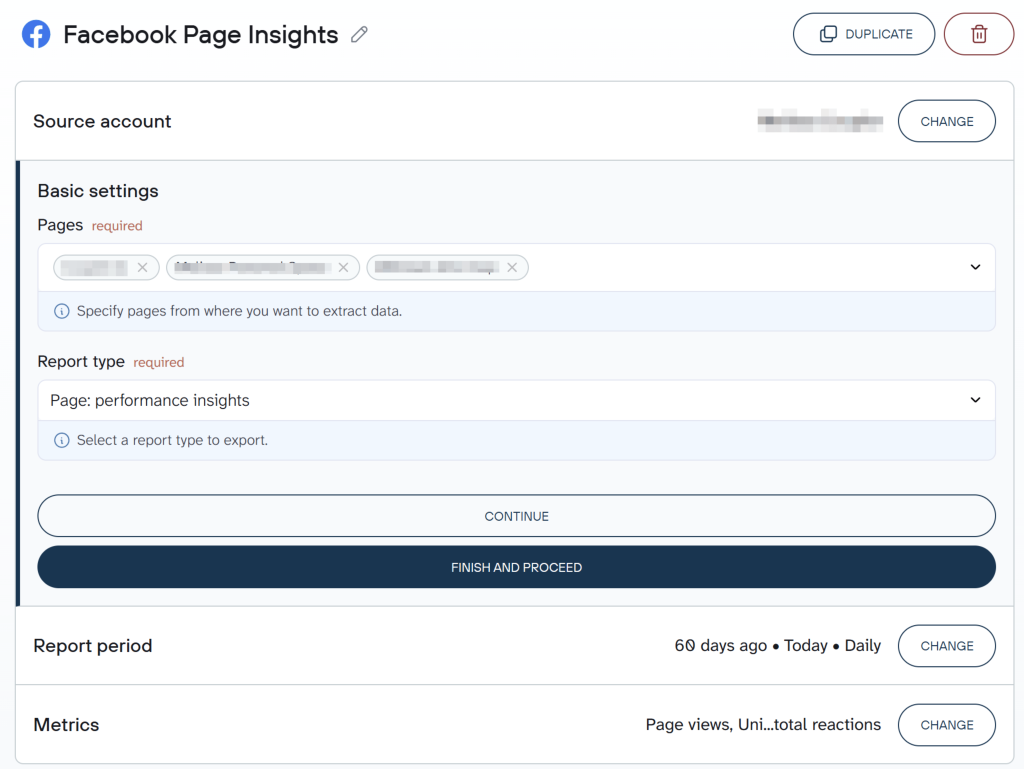
Connect your Facebook account and select the pages you want to pull data from. You can include one page or several at this stage.
Next, choose your report type. Page-level reports give you audience and reach trends over time, while post-level reports break down performance by individual content piece. Select which one best fits your needs, then specify the report period and metrics.

Coupler.io allows you to add multiple reports in your data flow or enrich Facebook Page Insights data with information from other sources.
Step 2: Organize your data and add context
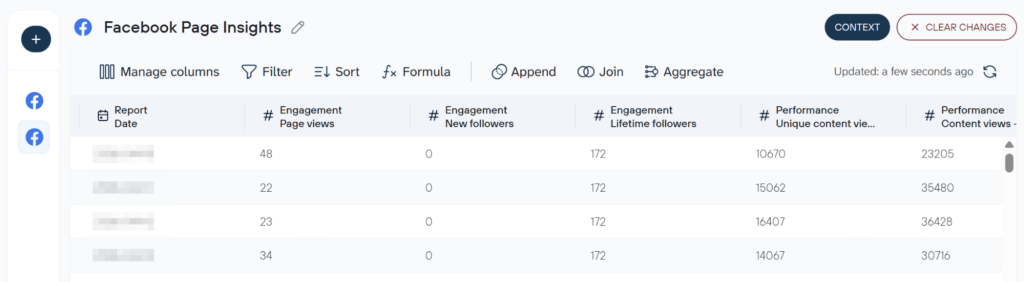
Before connecting Claude, configure how your data is organized and what context Claude should carry into every conversation. Use Coupler.io’s blend and transform tools to aggregate metrics by content format, page, or date range if the raw row-level data is more granular than you need.
Then add business context to the dataset: what a “good” engagement rate looks like for your audience size, how you define engaged users for your reporting, and any naming conventions your team uses for content categories. Claude receives this context automatically with every query. You set it once and don’t repeat yourself.

Step 3: Connect Claude and start your conversation
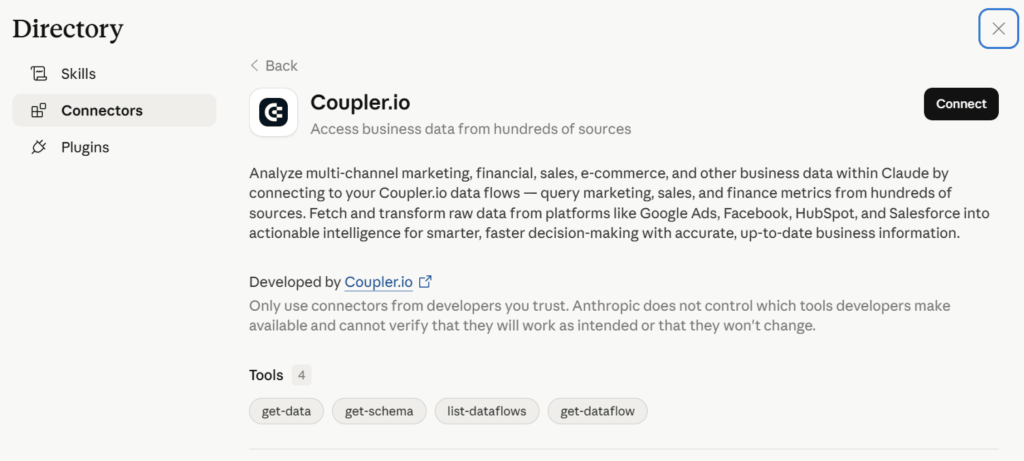
In Destinations, click Get connector. This leads you to the Coupler.io connector page. Click Connect and authorize the connection.

Go back to Coupler to run the data flow and set your refresh schedule.
Daily works well for page reporting if you want Claude to always have up-to-date data, while weekly is enough for trend analysis that doesn’t require daily granularity. Click Save and Run.
After it successfully does that, open Claude. Once connected, your Page Insights data is available in every conversation. It will ask you for permission to connect to Coupler.io MCP server every time you ask a question that needs the data set.
Here’s an example prompt on how you can start to analyze data in Claude:
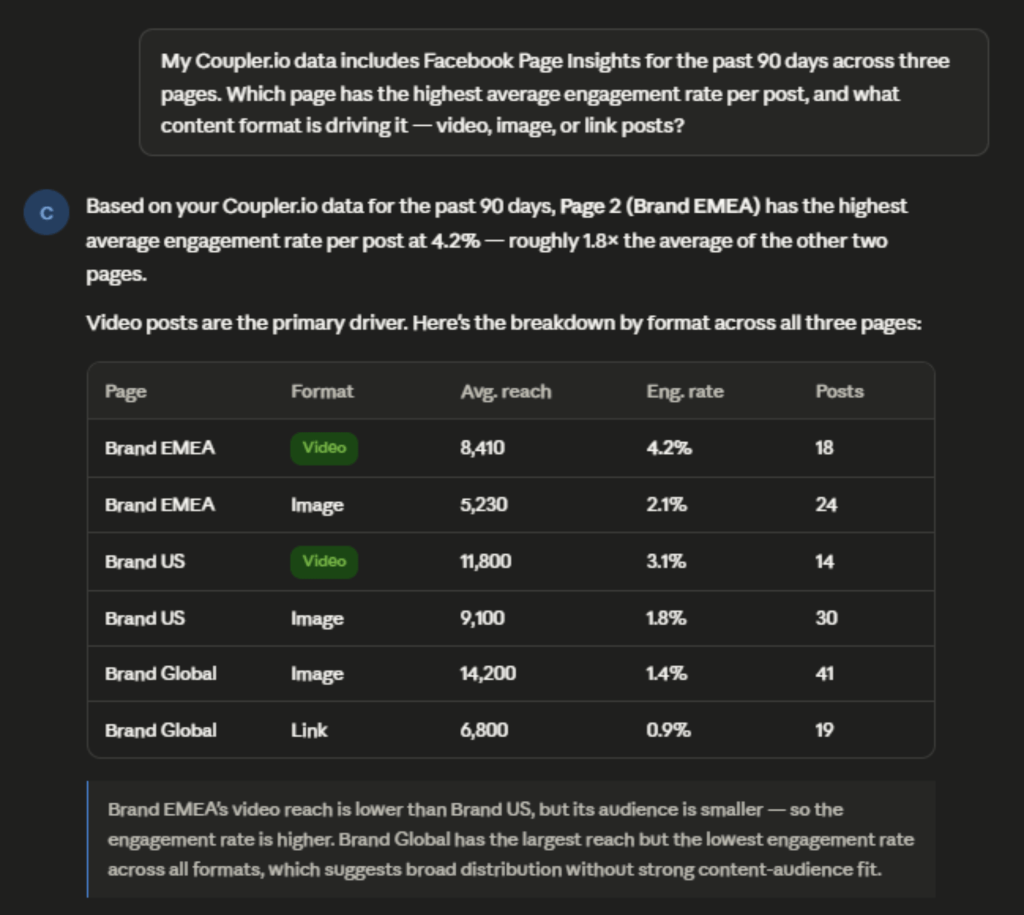
My Coupler.io data includes Facebook Page Insights for the past 90 days across three pages. Which page has the highest average engagement rate per post, and what content format is driving it, video, image, or link posts?
Claude returns a breakdown by page and format, pulling engagement rate calculations from the pre-processed data rather than computing them from raw impressions and reactions. Want to take it further? Conduct a Facebook audience analysis Claude can run directly from your Page Insights data.

Connect your Facebook Pages to Claude with Coupler.io
Get started for freeExamples of how to use Claude with Facebook Page Insights data
Identify which content format earns the most reach
Most social media managers have a sense of which content performs well but the data rarely confirms what intuition suggests. Reach varies by day of week, audience activity, and Facebook’s distribution algorithm.
A single high-performing reel can skew your mental model of what actually works on average. With Coupler.io, you can conduct a Facebook reach analysis with Claude by asking:
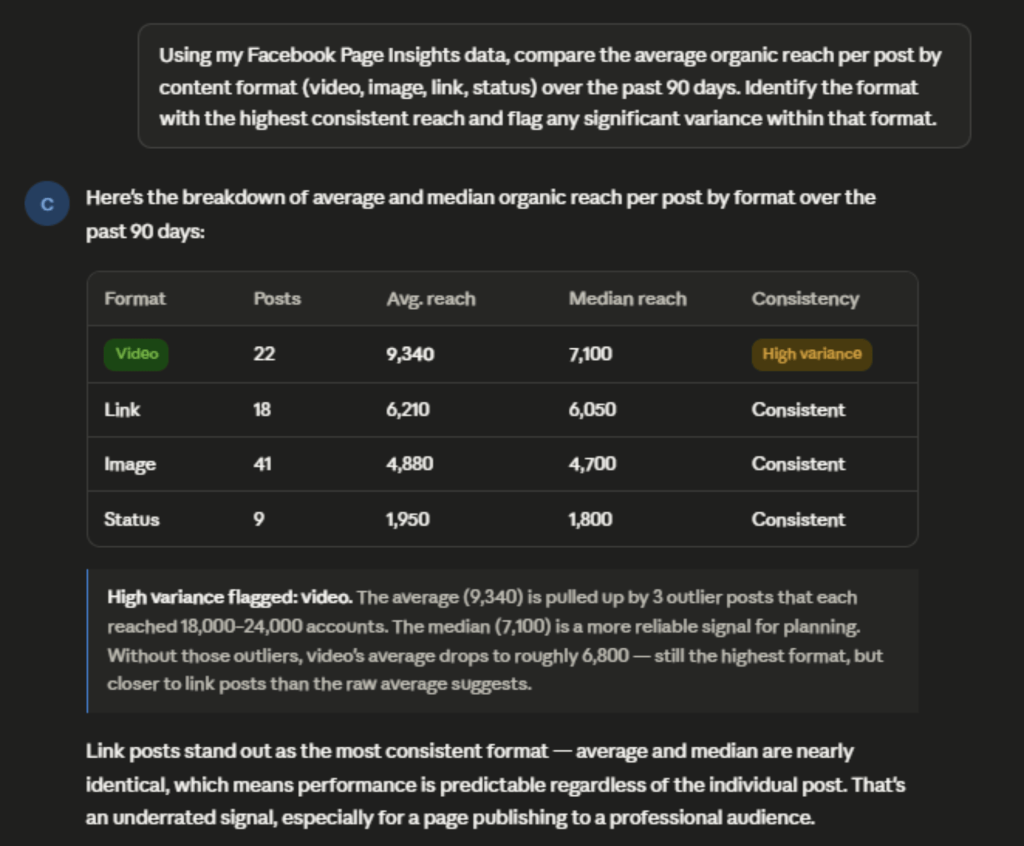
Using my Facebook Page Insights data, compare the average organic reach per post by content format (video, image, link, status) over the past 90 days. Identify the format with the highest consistent reach and flag any significant variance within that format.
Claude returns a summary table showing average and median reach by format, plus a note on high-variance outliers. From there you can ask follow-up questions, such as does video reach drop on weekends, or is the variance driven by post length?
If short-form video is consistently outperforming static images, that’s a signal to weight your publishing calendar toward it. It’s not because one reel did well, but because the pattern holds across 90 days. If link posts are punching above their weight (common on B2B pages), that’s a case for leaning into them even if they feel less “social” than other formats.

Diagnose a follower growth slowdown
A follower count that plateaus or dips is hard to diagnose through Meta Business Suite alone. The metrics are there, such as new likes, unlikes, net fans, page reach, but connecting them requires jumping between multiple views and manually comparing date ranges.
Cut the time it normally takes into a fraction when you connect Facebook Page Insights to Claude, conduct a Facebook follower growth analysis AI-led, and ask:
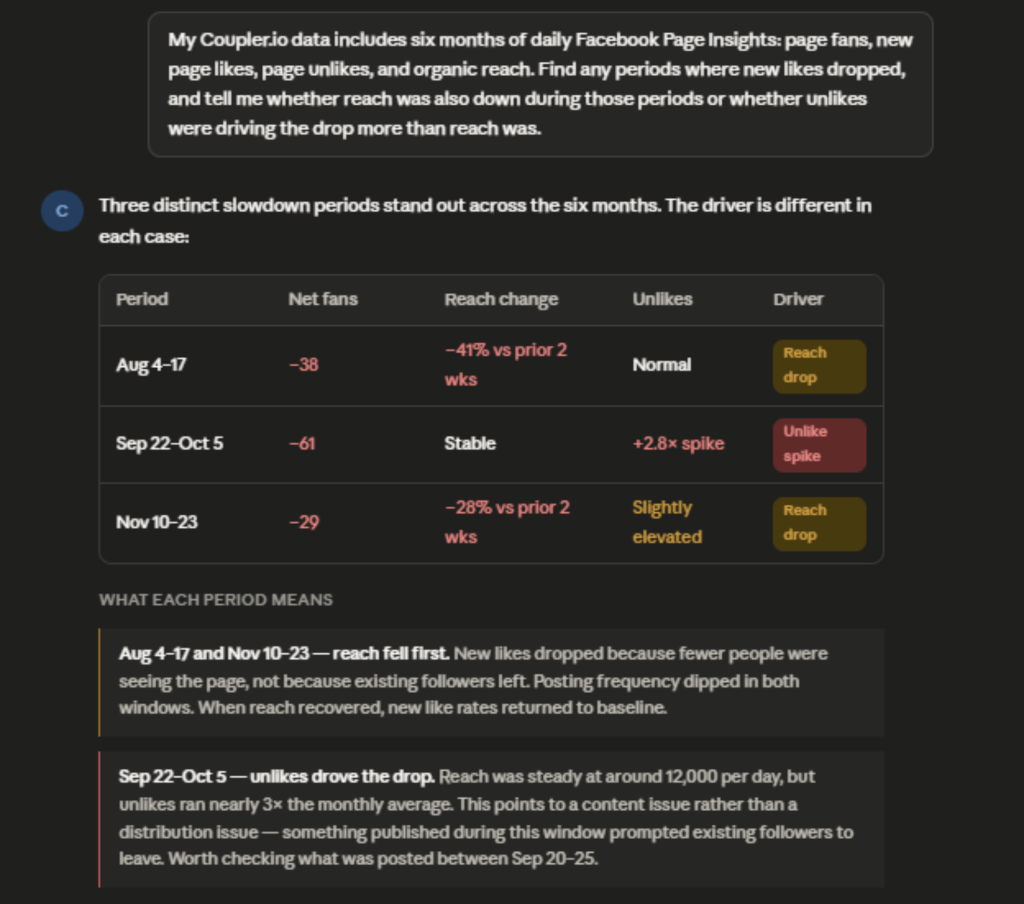
My Coupler.io data includes six months of daily Facebook Page Insights: page fans, new page likes, page unlikes, and organic reach. Find any periods where new likes dropped, and tell me whether reach was also down during those periods or whether unlikes were driving the drop more than reach was.
Claude flags the periods where growth stalled and tells you which signal was stronger: reach or unlikes. That saves you from manually cross-referencing two separate charts across six months of data.
If reach fell first, post more consistently. That’s what feeds new follower acquisition. If reach held but unlikes went up, something in your content pushed people away, and it’s worth finding out what before you keep publishing.

Benchmark organic performance against paid
Facebook keeps ad sets and organic metrics in separate dashboards. Getting them side by side means exporting two files and combining them manually, or skipping the comparison altogether.
With Coupler.io, you add Facebook Ads manager as a second source in the same data flow. Claude receives both datasets and compares them directly:
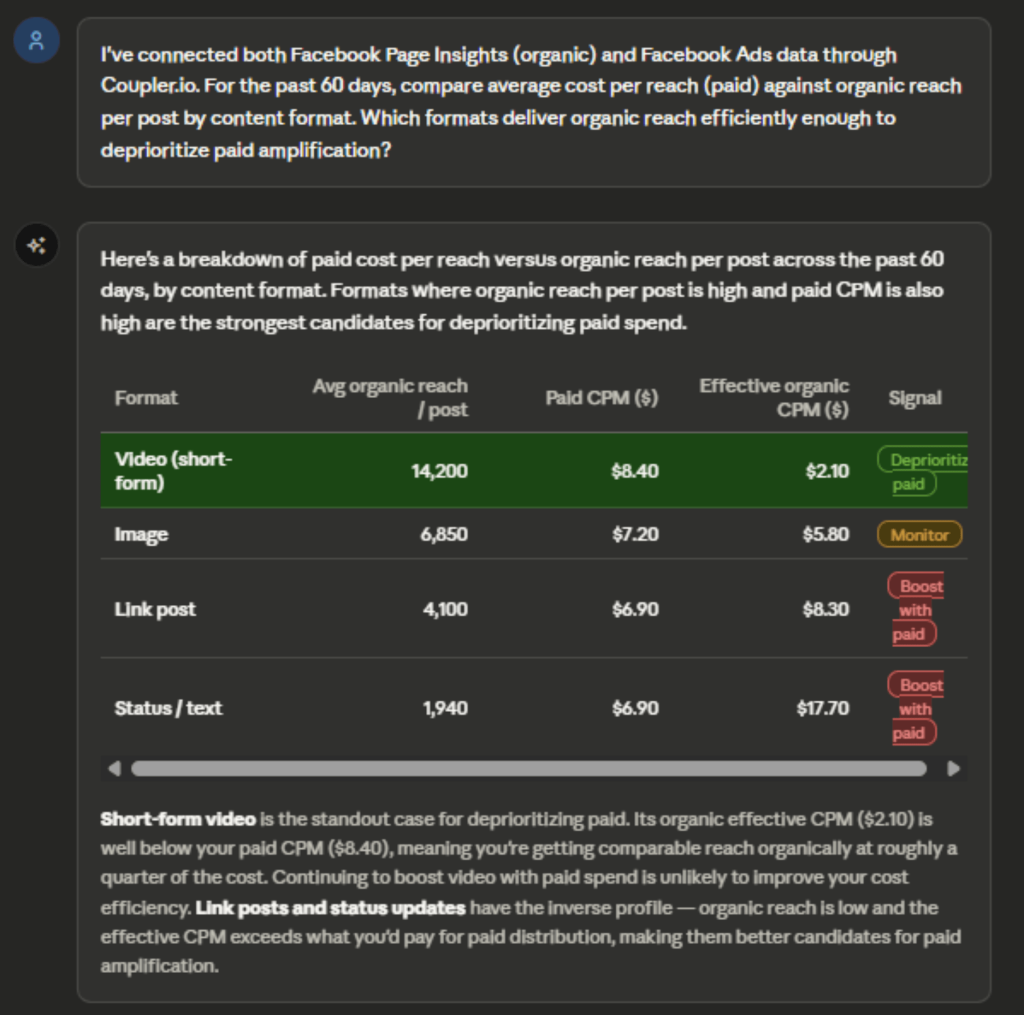
I've connected both Facebook Page Insights (organic) and Facebook Ads data through Coupler.io. For the past 60 days, compare average cost per reach (paid) against organic reach per post by content format. Which formats deliver organic reach efficiently enough to deprioritize paid amplification?
Claude returns a cost-per-reach comparison by format. If organic video is delivering reach at a cost close to what you’re paying for Meta ads, that’s a reason to shift budget elsewhere. Get even more specific insights through a deep dive into your Facebook video Insights with Claude.

Talk to Claude about your Facebook Page performance
Try Coupler.io for freeClaude prompts for Facebook Page Insights analysis
Once your Coupler.io data flow is running, you can drop any of these directly into Claude. They cover some of the most insightful Page Insights questions, from weekly reach trends to content format comparisons. Adjust the date ranges to match your reporting cycle.
Whether you need a quick Facebook engagement analysis Claude can run in seconds or a deeper trend breakdown, these prompts give you a starting point.
Show me a Facebook engagement analysis with the top 10 posts by engagement rate over the past 60 days. For each, include format, reach, and number of reactions.How has my page's organic reach trended week over week for the past three months? Flag any weeks that dropped more than 20% from the prior week.Which day of the week consistently generates the highest average post engagement across all content formats?Compare page fan growth this quarter to the same quarter last year. What was the net change and what months drove the difference?Find content/posts with high reach but low engagement rate. What do they have in common in terms of format, day, or topic?What percentage of my total page reach is coming from existing followers versus non-followers? Has this ratio shifted over the past 90 days?Across all posts in the past 30 days, rank content formats by average video view rate (for video) and link click rate (for link posts).
What matters when you analyze Facebook Page Insights data with Claude
Before running any Facebook post performance analysis AI-run, I’d make sure these four things are in place. They’re what separate a useful Claude response from a plausible-looking one.
Define your metrics before Claude interprets them
Facebook Insights metric names are misleading without definitions. “Engaged users” counts anyone who clicked anywhere on a post, even clicks that expand the text or dismiss a notification, not just reactions and comments. “Reach” counts unique accounts, but organic and viral reach are counted differently. “Impressions” includes repeat views of the same post by the same person.
Without definitions attached to the data, Claude uses the plain-language meaning of a metric name, which may not match how your team actually reports performance. Coupler.io lets you attach business context to the dataset once, and Claude receives it with every query. For a Facebook Page Insights dataset, useful context might look like this:
Example context block to attach to dataset:
- Engagement rate = (reactions + comments + shares) ÷ reach, not impressions.
- Organic reach and paid reach are separate fields, do not combine unless the question is about total reach.
- Video views at 3 seconds ≠ comparable to 1-minute view rates; use ThruPlay or 1-minuteview rate for content quality signals.
- Posts tagged as “boosted” have paid distribution, exclude from organic content performance analysis.
- Page reach below 500 on a post may indicate suppression; flag separately rather than averaging in.
- For fan growth, use net_fans (new likes minus unlikes), not page_fans.
Keep the math in the pipeline, not the conversation
When you send thousands of Facebook posts from multiple pages straight into Claude and ask it to compute high-level metrics on the fly, you’re stacking aggregation risks on top of the model’s own limitations with large numeric workloads. That’s why it’s safer to let a dedicated engine aggregate and check the data first, then have Claude explain the results.
Metrics like “overall engagement rate across all pages” have to be calculated from total engagements and total reach, not by averaging each page’s percentage. Otherwise, smaller pages skew the result. Coupler.io’s Analytical Engine handles these calculations and passes verified results to Claude. Claude explains the numbers. It doesn’t produce them from scratch.
Coupler.io ships with a Facebook Page Insights dashboard template that covers the reporting questions most social media managers ask every week. You can view impressions, organic reach, page views, fan growth, and paid versus organic breakdowns, all in one view.
Facebook Page Insights dashboard template

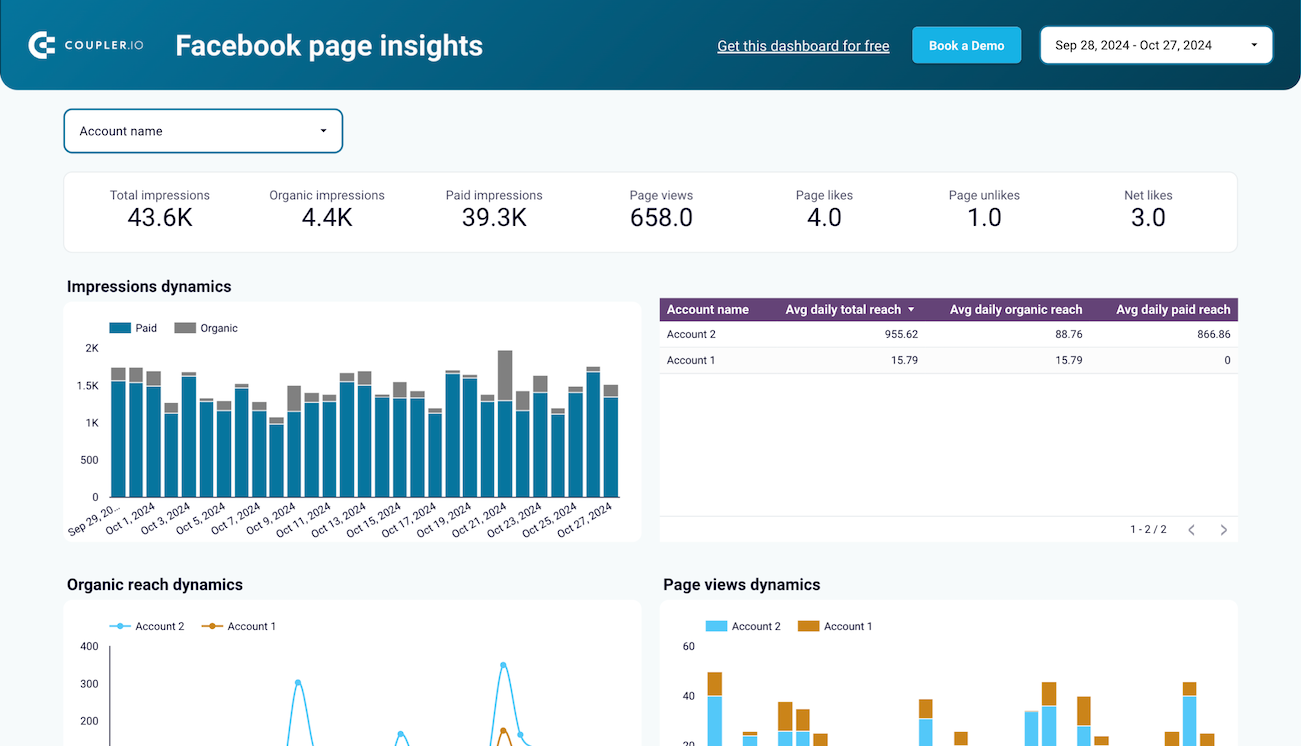
Facebook Page Insights dashboard template
Preview dashboardBut you don’t have to choose between a dashboard and Claude. Coupler.io lets you add multiple destinations to the same data flow. Your Facebook Page Insights data gets sent to your Google Data Studio dashboard and to Claude on the same refresh schedule.
Your marketing director opens the dashboard and sees the charts. In the meantime, you ask questions in Claude about the same numbers. Neither person re-exports nor re-uploads anything, and both are always looking at the same data.
Other ways to export Facebook Page Insights data to Claude
Coupler.io handles the connection and keeps the data fresh on a schedule. But if you only need a one-off analysis from a single CSV, or your engineering team already maintains a custom pipeline, one of these methods covers it. Keep in mind that Meta’s Graph API changes frequently, so anything you build yourself needs ongoing upkeep.
Manual export
Meta Business Suite lets you export Page Insights data as a CSV from the Insights section. Select your date range, choose the metrics you want, and download. The file includes post-level and page-level data depending on which view you export from.
This works for a one-time analysis. Upload the CSV to Claude and ask your questions. Two limits to know: First, the export captures a snapshot at a single point in time, so any posts published after the download aren’t included.
Second, Meta’s native export doesn’t always surface historical data beyond 90 days cleanly. For anything requiring multiple pages or multiple time periods, you’re assembling separate files manually.
Custom MCP server
If your business runs its own internal analytics system, a custom MCP server lets you connect exactly that data to Claude, shaped the way your team already uses it. That could be a content scoring model, a blended view of Facebook Page data and revenue attribution, or a dataset that combines page performance with CRM activity.
It’s the right path when off-the-shelf connectors don’t give Claude access to the specific combination of data your reporting depends on. Building it requires a developer, and keeping it running as Facebook updates its API needs ongoing attention.
Access tokens expire, API versions change, and each update can break what was working. For most marketing teams, that ongoing cost outweighs the control benefit. It makes sense when you have a developer who can own it long-term and requirements that no ready-made connector meets.
API scripts and function calling
For teams that want full control over how data moves between Facebook and Claude, API scripts and function calling are the most flexible path. Scripts run on a schedule and push prepared Facebook Page Insights data to Claude automatically.
Function calling goes further. It lets Claude pull specific slices of your page data mid-conversation, on demand, without you manually fetching anything. The practical challenge is what you have to manage on an ongoing basis.
Facebook’s Graph API has its own rate limits, plus access tokens that expire and require refreshing. API versions change with each release and can break scripts that were working fine.
For most marketing teams, that maintenance overhead isn’t worth the control it buys. It makes sense when you have a developer who can own the pipeline end-to-end and a reporting need that no off-the-shelf connector can meet.
Which method should you choose?
Your best approach depends on three factors: how often you need updated data, the availability of engineers on your team, and the kind of analysis you plan to run.
Update frequency. A manual CSV export is enough for a one-off analysis, like reviewing a past campaign or preparing a quarterly report. But if your team asks recurring questions about page performance week after week, manually exporting and uploading data every time becomes a real drag. Recurring reporting needs a connection that refreshes automatically.
Engineering capacity. Custom MCP servers and API scripts give you the most control, but someone has to build them and keep them running as Meta’s API changes. If you’re a marketing team without a developer who can own that, these options aren’t realistic. Coupler.io handles the technical layer for you with no code required.
Type of analysis. If you mostly want to check how a specific post performed or answer a one-off question, a manual CSV upload is enough. If your goal is recurring analysis, comparing months, tracking trends, and combining page data with ad spend, you need a connection that organizes data before Claude sees it and keeps it up-to-date automatically.
For most teams doing recurring Facebook Page Insights analysis in Claude, Coupler.io is the practical path.
Get analysis-ready data from 400+ sources with Coupler.io
Sign up for freeFAQs
Can I connect multiple Facebook Pages in a single Coupler.io data flow?
Yes. Coupler.io lets you blend data from multiple Facebook Pages into a single dataset. Useful if you manage several pages and ad accounts. You set it up once and all page data is available in one place for Claude to query across.
Does this Claude Facebook Page Insights connector by Coupler.io work with both Claude.ai (web) and Claude Desktop?
The Coupler.io connector is available through Claude’s connector directory on the Claude web interface. For current compatibility with Claude Desktop, check Coupler.io’s documentation directly as support continues to expand.
Is connecting Facebook Page Insights to Claude safe?
Claude only sees the data you’ve included in your Coupler.io data flow. You control which pages, metrics, and date ranges are included. Claude can read and analyze that data but cannot modify your Facebook Page or access anything outside what you’ve configured. On the security side, Coupler.io is SOC 2 Type II certified and GDPR-compliant, with data encrypted in transit and at rest.
Can I combine Facebook Page Insights with other sources in the same analysis?
Yes. You can add multiple sources to a single Coupler.io data flow. The most common combination for page managers is Facebook Page Insights alongside Facebook Ads, so Claude can compare organic and paid performance in the same conversation. You can also combine with Google Analytics, CRM data, or other social platforms.