The Google Search Console interface is built for viewing data, not analyzing it. You’ll see what Google sees: queries your pages rank for, pages that get clicks, and impression drop points.
To analyze, you need to pull the data out of GSC and send it to visualization or AI tools. But manual exports cap at 1,000 rows. So, you’ll be stuck in endless exporting, cleaning, and aligning files before you can see anything useful.
The fix is to use AI for GSC data analysis. You can ask questions about your GSC data and get answers from up-to-date data. This guide covers how to connect Google Search Console to Claude.ai with Coupler.io and start asking questions about your search performance in 5 minutes.
Choose the right method to load Google Search Console data to Claude
| Connection method | Setup effort | Who does the math | Best for | Watch out for |
|---|---|---|---|---|
| Coupler.io | Low: no code, ~5 minutes | Coupler.io’s Analytical Engine | Recurring GSC analysis, non-technical teams | • Automatic data refresh is only available on paid plans |
| Manual export | None | You. In a spreadsheet | One-off analysis on a small site | • 1,000-row cap • no scheduling • stale the moment you export |
| Open-source MCP server | Medium: Node.js, Google Cloud service account, JSON credentials | Claude. Directly on raw data | Developers who want full API control | • Setup and maintenance burden • No Analytical Engine |
| GSC API script | High: Python or JS, OAuth, scheduling infrastructure | Code calculates, Claude interprets | Engineering teams with existing data pipelines | Build cost plus ongoing maintenance |


Connect your Google Search Console data to Claude with Coupler.io
Get started for freeConnect Search Console data to Claude with Coupler.io
Coupler.io is a data integration platform and AI analytics that connects over 400 sources to AI tools, spreadsheets, dashboards, and data warehouses. Some can say that Coupler.io allows you to pull Search Console data into Claude. However, it’s somewhat different, as it collects data from GSC and stores it in structured data sets. Claude then queries those datasets upon your questions about page performance, device types, and other things.
Here is what it looks like to connect Search Console to Claude
Step 1: Create a data flow for Google Search Console data
Sign up for Coupler.io for free without a credit card. Once inside, create a new data flow and select Google Search Console as the source.
Or, you can also use the form below.

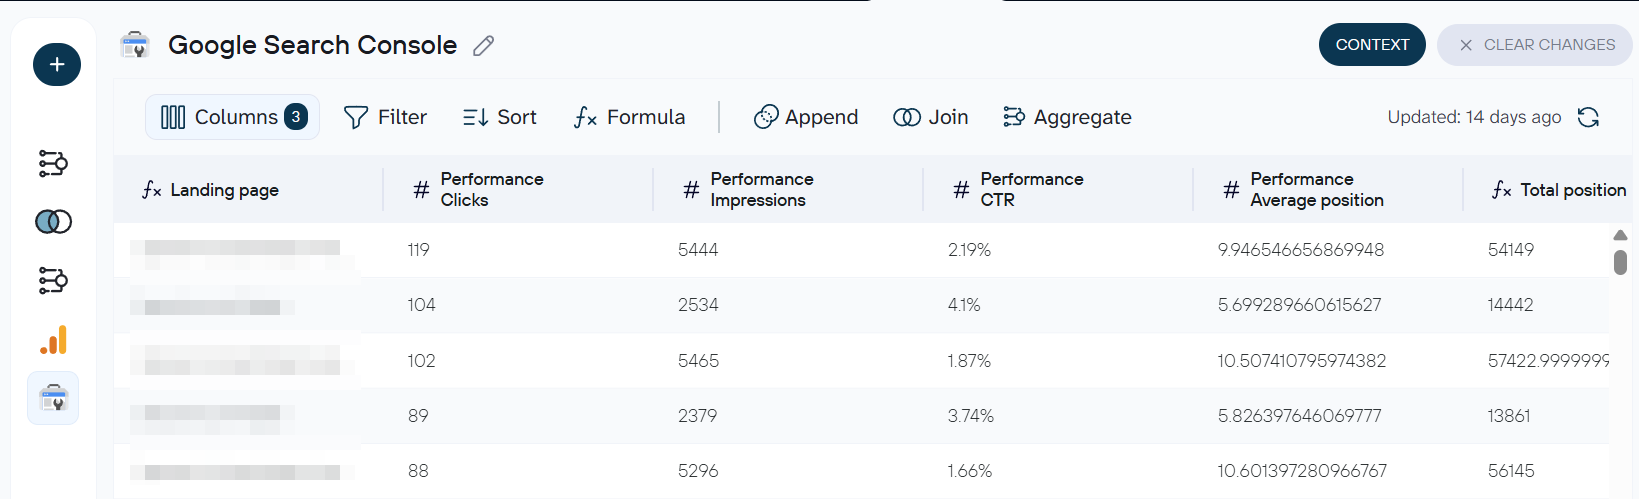
Connect your GSC account and select the data entity. This is where you connect Search Console data to Claude for the first time. For most SEO analysis, you want Search results performance. This covers queries, pages, clicks, impressions, CTR, and average position.

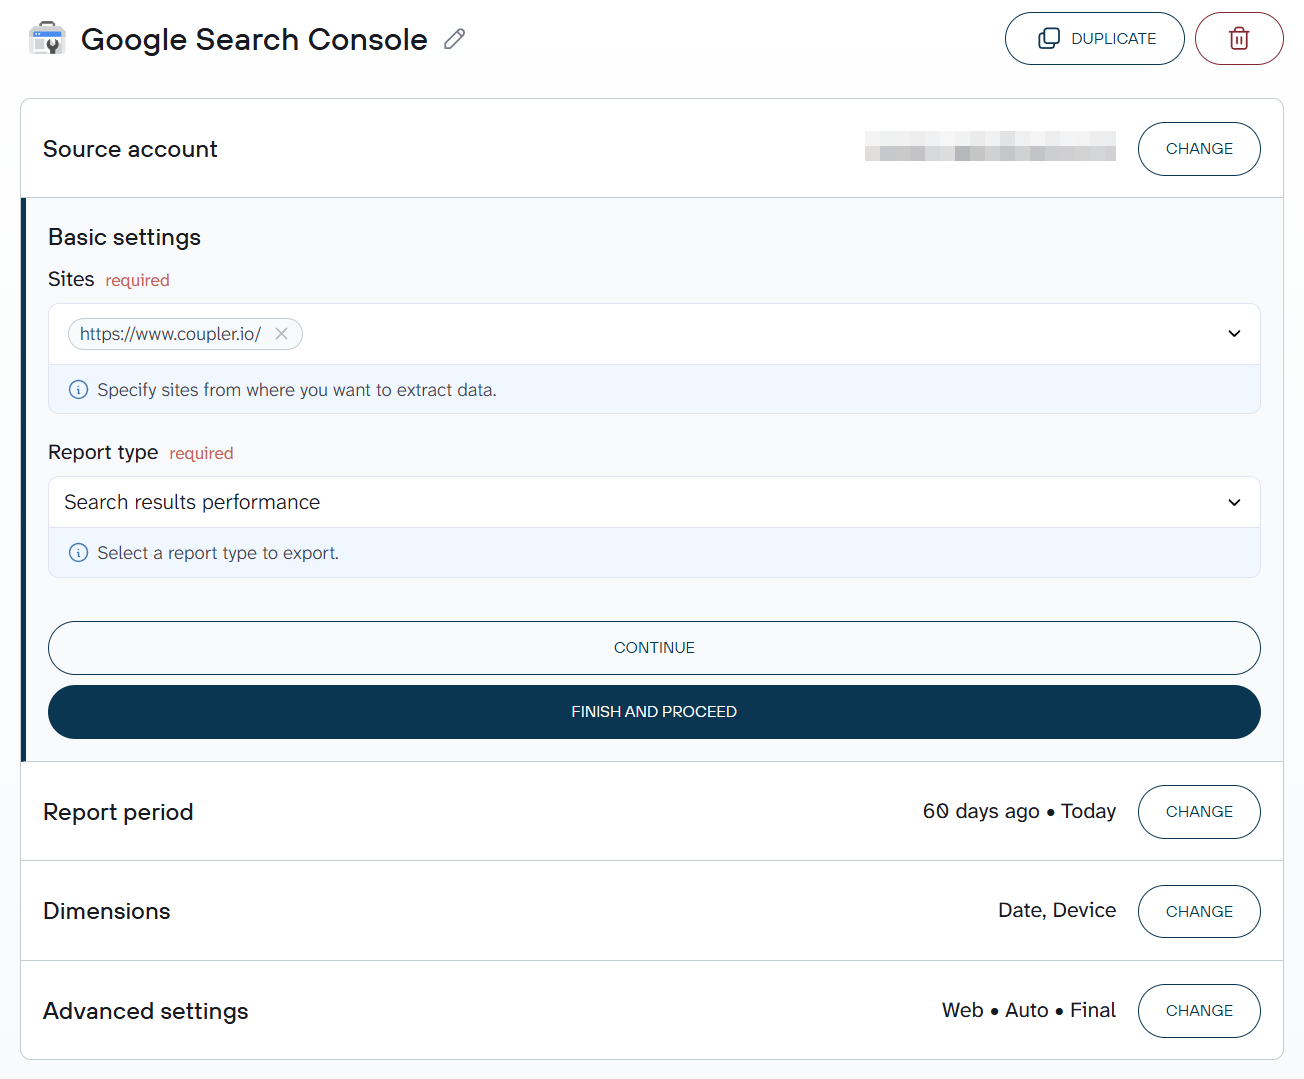
Sitemaps are available as a separate entity if you need them. Configure your date range and any filters: device, country, or search type can all be set here before the data reaches Claude.
Coupler.io previews the dataset before anything runs. Check that the columns and row count look right before moving on.

If you manage multiple GSC properties or want to blend GSC data with GA4 or Google Ads, you can add additional sources to the same data flow. The combined dataset goes to Claude as one structured input.
Coupler.io also allows you to attach business context to your data for more efficient data analysis.
Step 2: Connect & automate Search Console reports with Claude
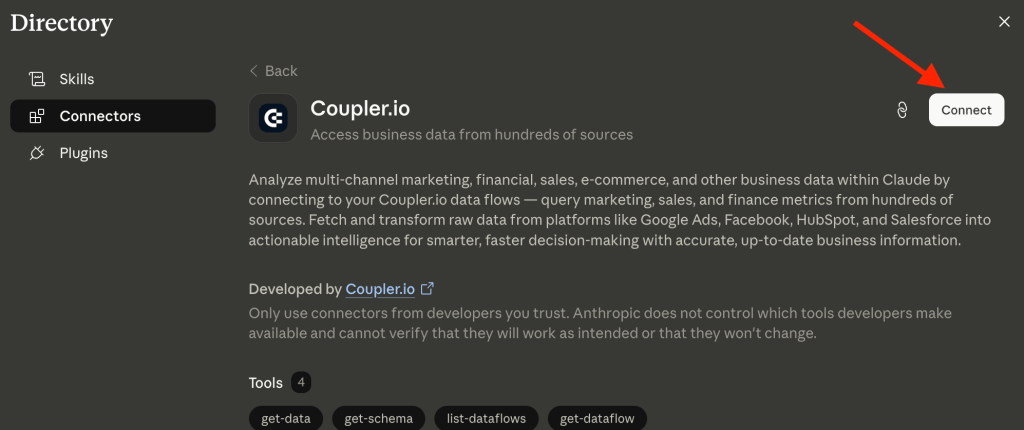
In the Destinations step, click Get connector. This opens the Coupler.io connector page inside the Claude app.

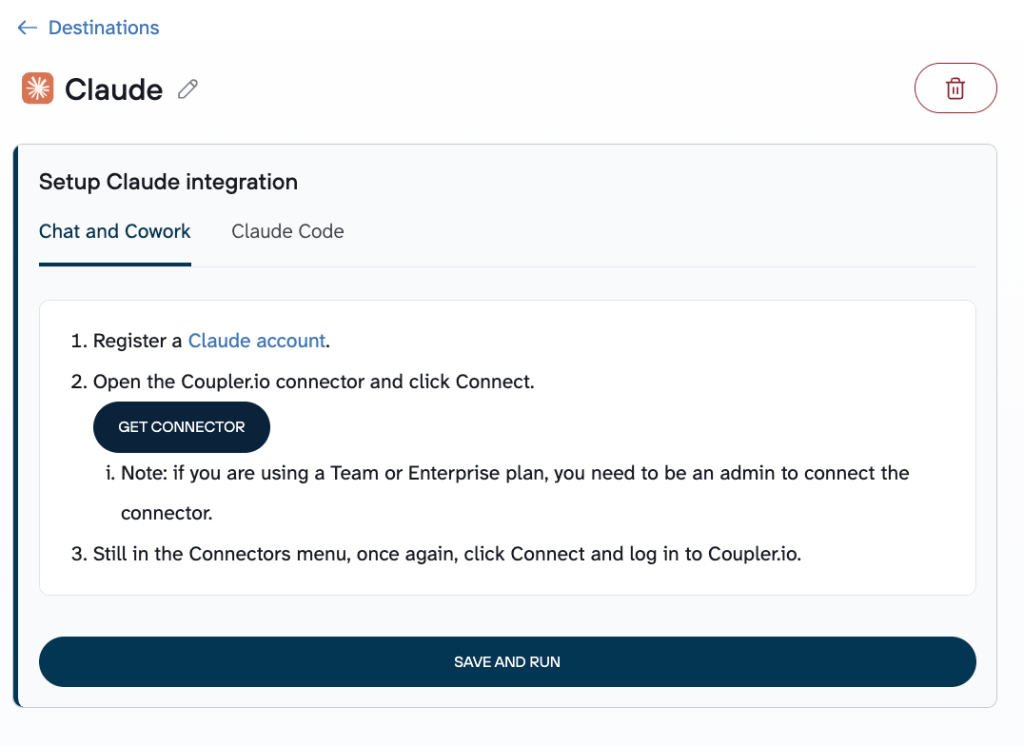
Click Connect and authorize the connection. The Coupler.io MCP connector will appear in Claude’s connector directory.

Now you need to save and run the data flow. Note that it does not mean that Coupler.io will pull your data to Claude. The data set will only be on the Coupler.io side, and Claude will query requests to the Coupler.io MCP and receive responses for interpretation.
It’s also recommended to set your refresh schedule. Daily works for most SEO workflows: ranking shifts and CTR changes don’t move hour to hour. If you’re tracking slower trends like month-over-month position movement, weekly is enough.

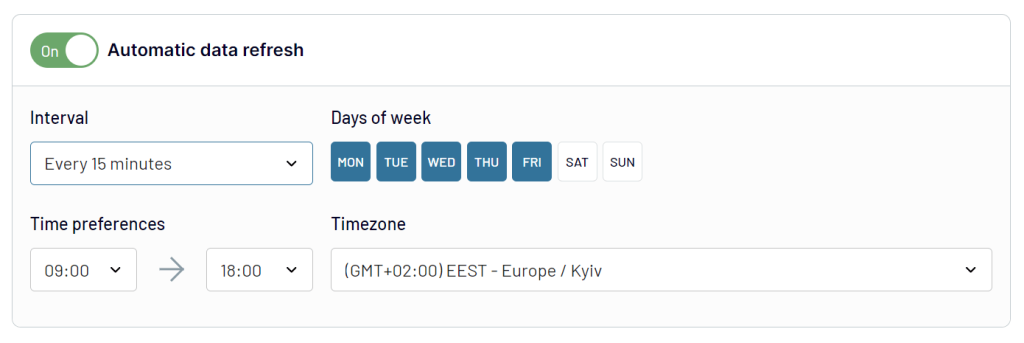
The data updates automatically. This makes it possible to connect Google Search Console to Claude AI on a schedule and automate Search Console weekly reports.
Step 3: Start a conversation with Claude about your GSC data
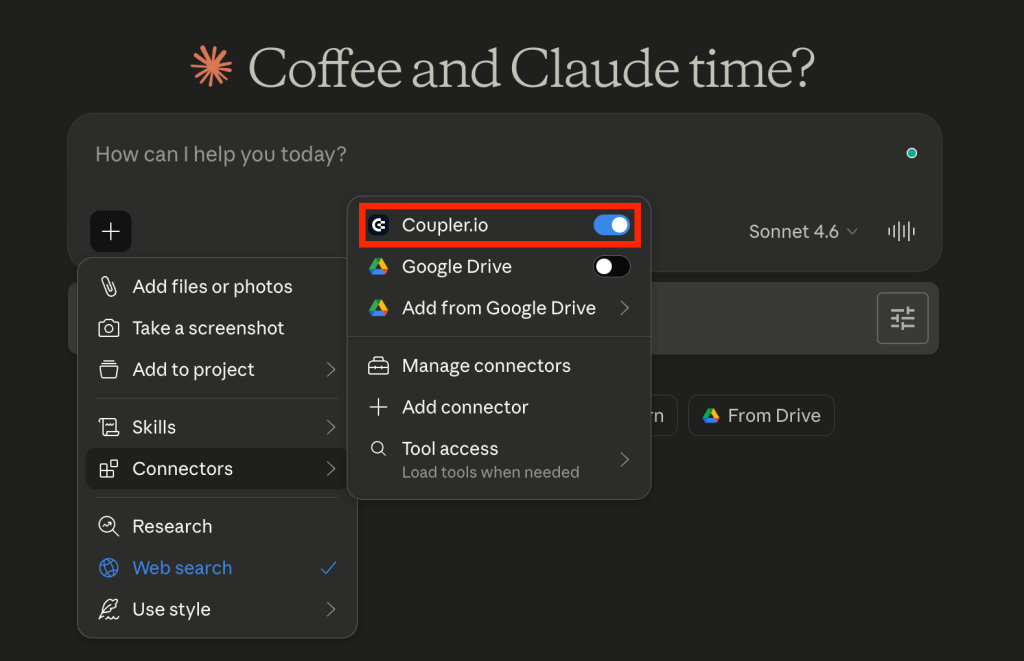
After the first successful run, open Claude. You’ll see Coupler.io in your Claude chat connectors. Toggle it on when you’re working with Coupler.io data.

From here, you send Search Console queries to Claude in plain language. A good starting point for most SEO teams:
“Which queries in the last 28 days have impressions above 500 but a CTR below 1.5%? Group by page and sort by impressions descending.”

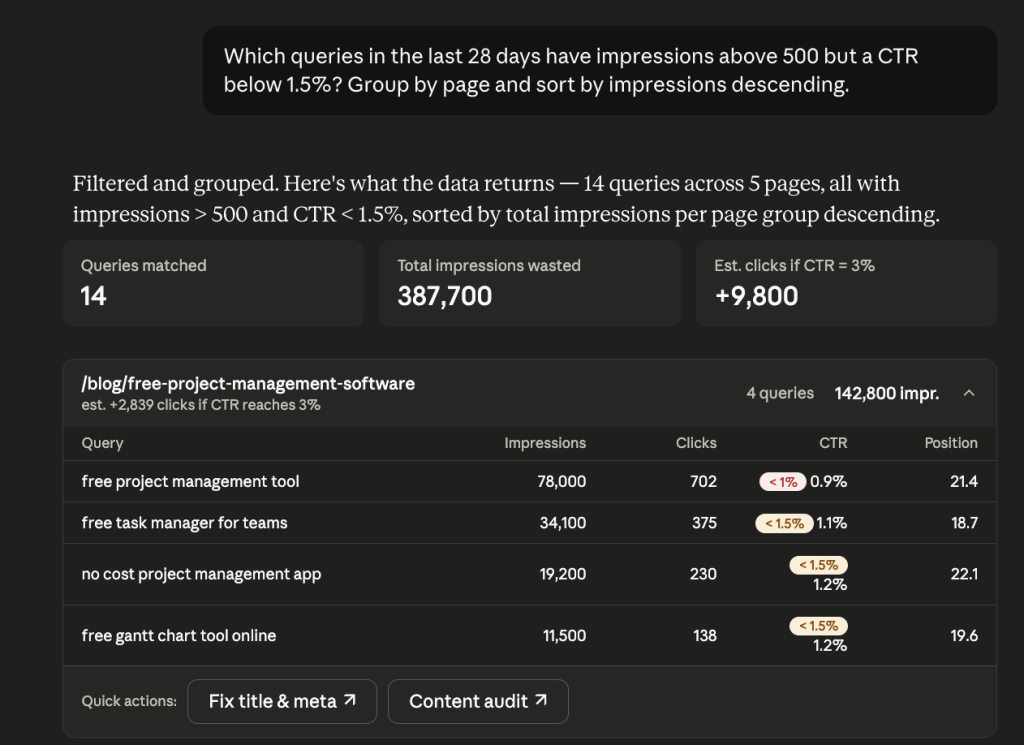
Here, it groups the queries by page, shows estimated click uplift if CTR improves, and flags which pages have the highest combined impression volume. In this example, a single page has 142,800 impressions across 4 queries with CTR below 1.5%. That is 2,800 additional clicks.
Analyze your search performance data in to Claude
Try Coupler.io for freeHow to use Claude with Google Search Console
By just viewing GSC data, you cannot know why traffic is dropping on a specific page or which queries are splitting rankings. But when you send Search Console pages to Claude, you can run the kind of SEO analysis that used to take hours in a spreadsheet and get answers from fresh numbers.
These three use cases cover the SEO analysis that used to take hours in a spreadsheet but is straightforward once you analyze Search Console data with Claude.
Finding pages losing rankings before they show up in the dashboard
GSC’s default view is a 28-day rolling window. A keyword analysis across two date ranges shows exactly which pages are losing ground before the traffic drop becomes obvious. The only way to discover declining pages before the traffic impact is visible is to compare periods directly.
With your GSC data in Claude, you can catch this before it becomes a problem:
Compare the average position for my top 50 pages by impressions between January 1–31 and April 1–30, 2026. Flag any page where the position dropped more than 3 places. |

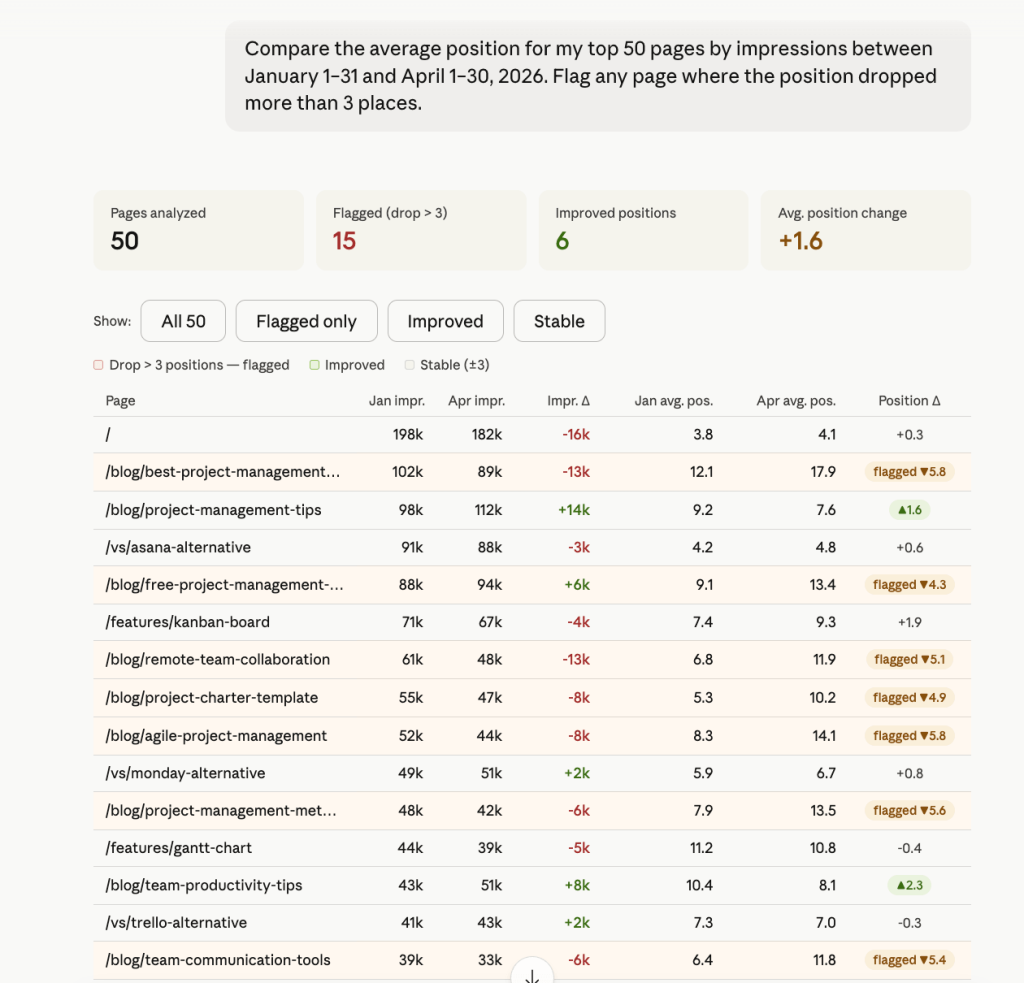
The output separates recoverable pages from critical ones. For example, pages that slipped from position 6–7 to 11–12 still have authority, they just need attention. Pages crossing position 18–19 need immediate content audits.
From here, ask Claude to diagnose specific pages, detect ranking drops early, or separate impression drops from CTR shifts.
Spotting cannibalization between pages
When two pages rank for the same query, Google has to choose which one to surface. It doesn’t always pick the right one, resulting in both pages underperforming.
To spot this inside GSC, you have to filter by query, checking which pages appear, and comparing positions manually. For a site with hundreds of queries, that’s not a realistic audit.
Which queries in the last 90 days have more than one page appearing in impressions data? List the query, both pages, their individual impressions, and their average positions. |

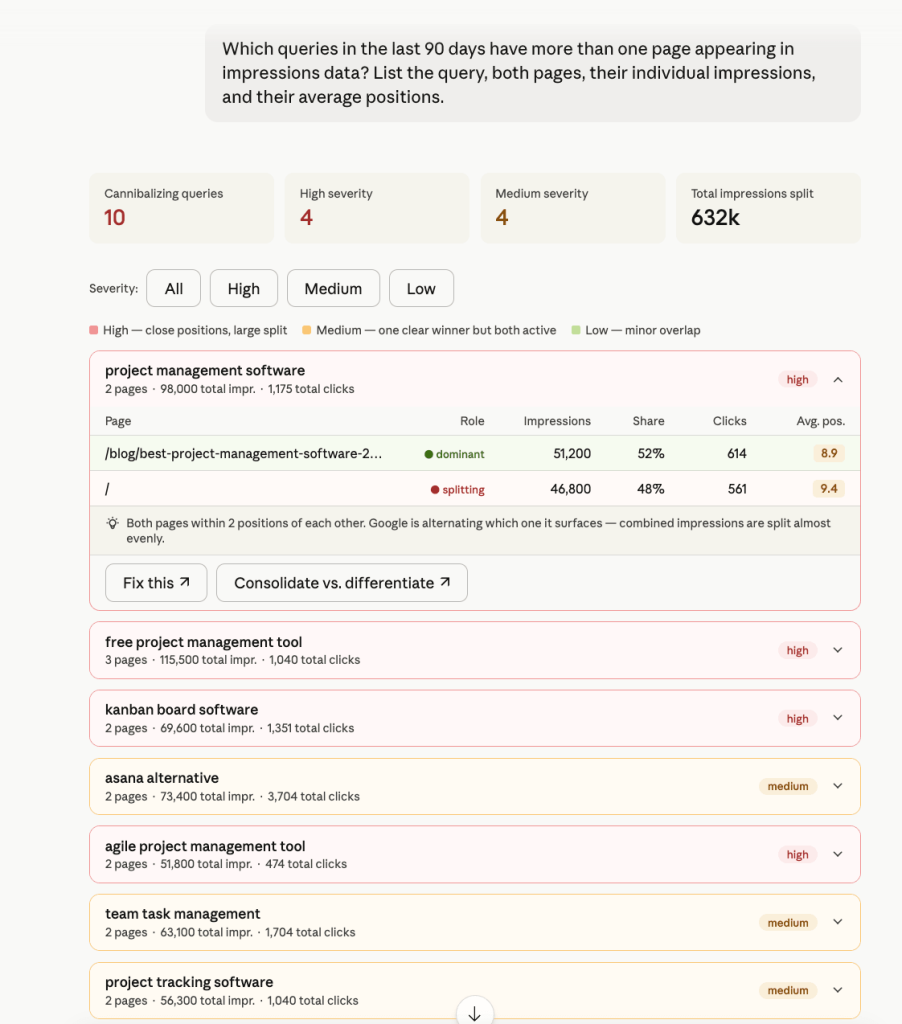
10 cannibalizing queries surface across the 90-day window, with 4 flagged high severity. It shows impression share per page so you can see exactly where the split is happening. Running this as a cannibalization analysis every quarter keeps the problem from compounding silently
Start with high-severity pairs. The fix depends on an intent analysis of the query. If both pages genuinely target the same intent, consolidate. If the intent is different enough, differentiate the content so Google stops treating them as competing for the same result.
Finding quick-win queries to optimize for clicks
Some queries already have solid impressions. Google is showing the page, but the CTR is low. The problem could be the title or meta description isn’t compelling enough to earn the click.
These are the easiest wins in SEO because you don’t need to build new content or acquire links. You just need to rewrite the snippet.
Show me queries from the last 28 days where impressions are above 300, and CTR is below 1.5%. Sort by impressions descending and include average position. |

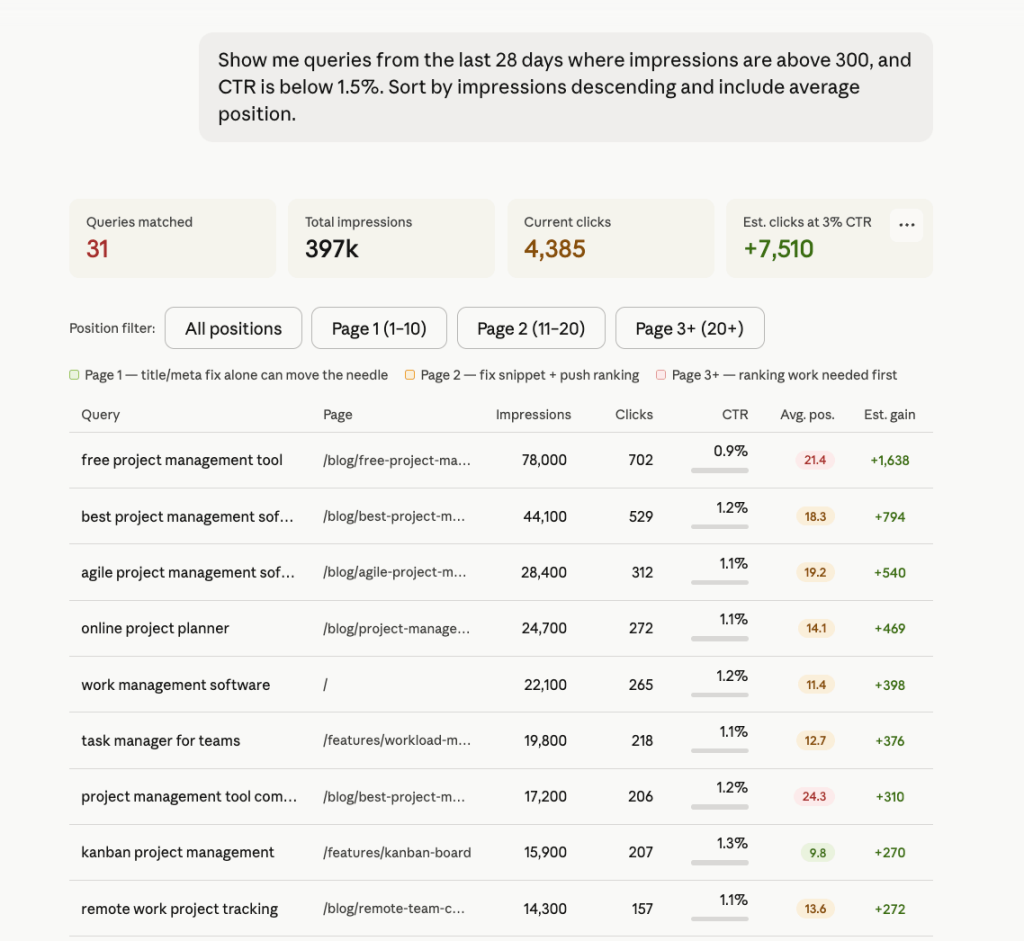
Claude returns a ranked list of queries with the exact metrics you need to prioritize rewrites.
Use the position filter to separate the work. The goal is to analyze CTR gaps by position so you fix the right pages first.
Talk to Claude about your search performance with Coupler.io
Get started for freeHow to analyze SEO data: Claude prompts for Search Console
These Claude prompts cover the most common SEO analysis tasks. Copy them directly and adjust date ranges or thresholds to fit your site.
Impression growth by page
“Which pages had the highest impression growth in the last 30 days compared to the previous 30 days? Sort by growth descending.”

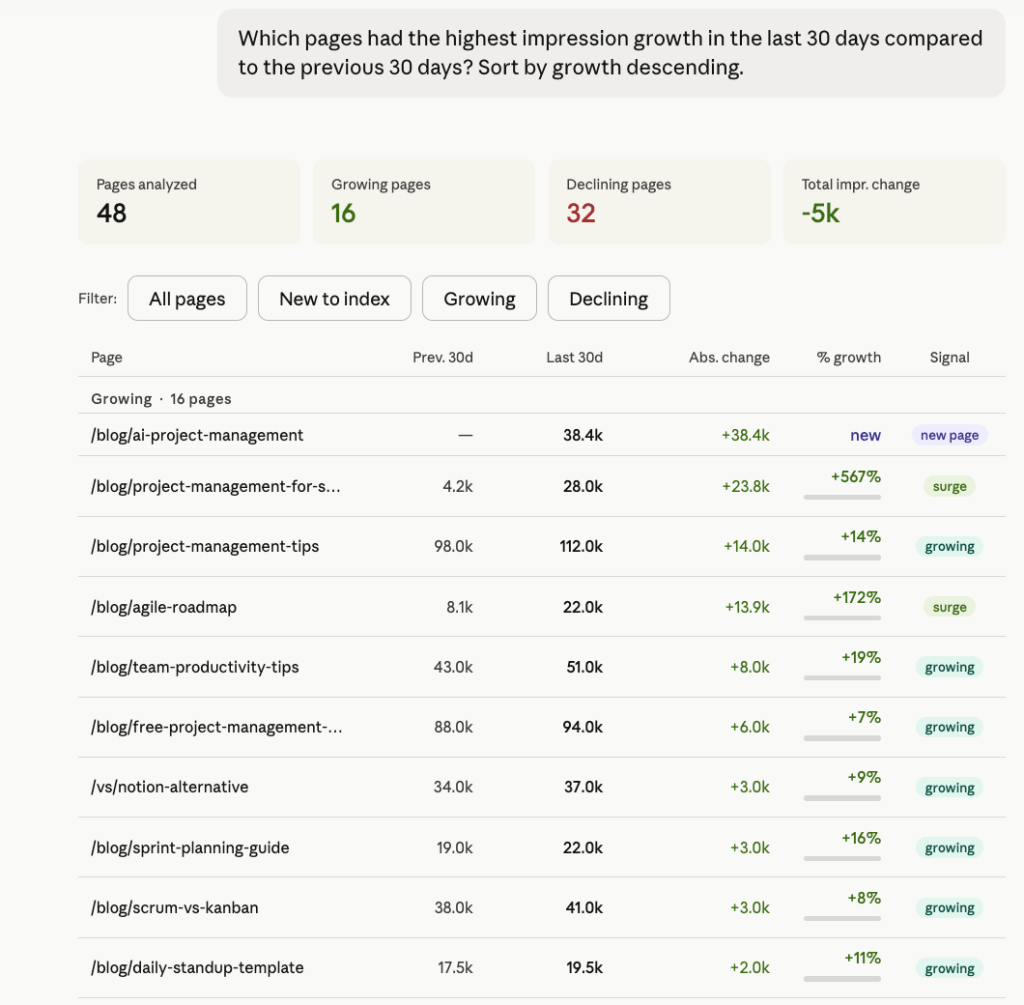
Impression growth is an early signal. It shows Google is starting to surface a page more often before clicks follow.
Use this prompt to catch pages gaining momentum early and double down: internal links, updated content, or a stronger CTA. The declining filter is equally useful and it tells you which pages are losing visibility before the traffic drop becomes obvious.
Mobile vs. desktop query performance
“What are my top 10 queries by clicks for mobile vs. desktop? Show the average position for each and flag where the gap between devices is larger than 3 places.”

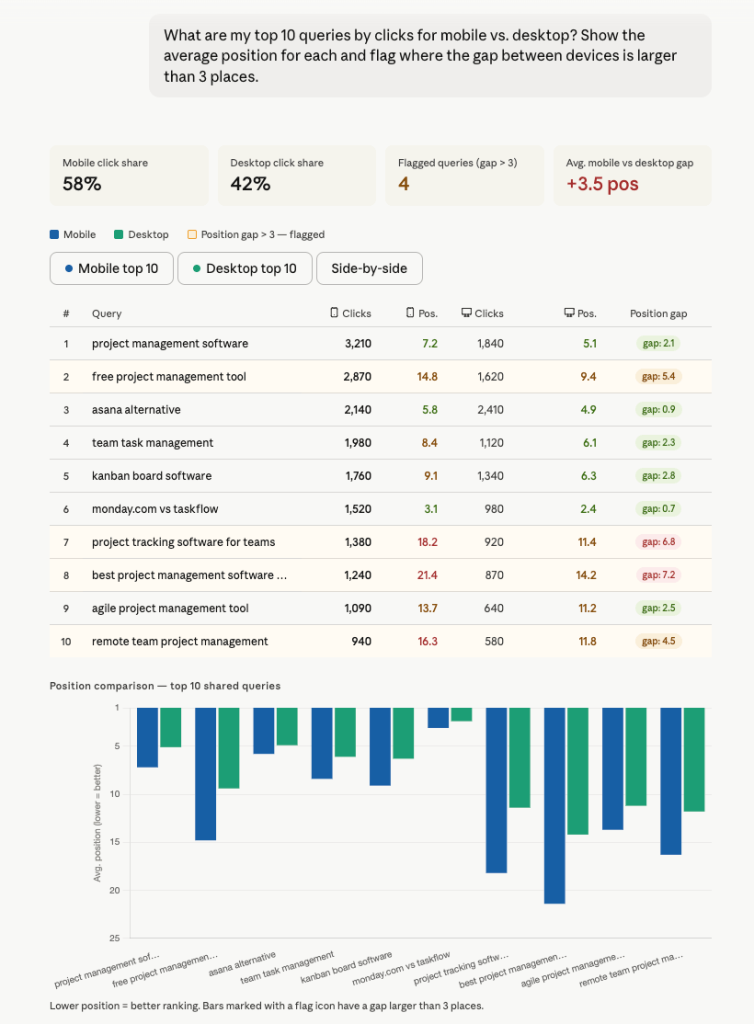
Most sites get more mobile traffic than desktop but optimize pages for desktop. This prompt surfaces where that gap is costing you rankings.
High impressions, low clicks
“Show me pages with more than 1,000 impressions but fewer than 10 clicks in the last 28 days. Include CTR and average position.”

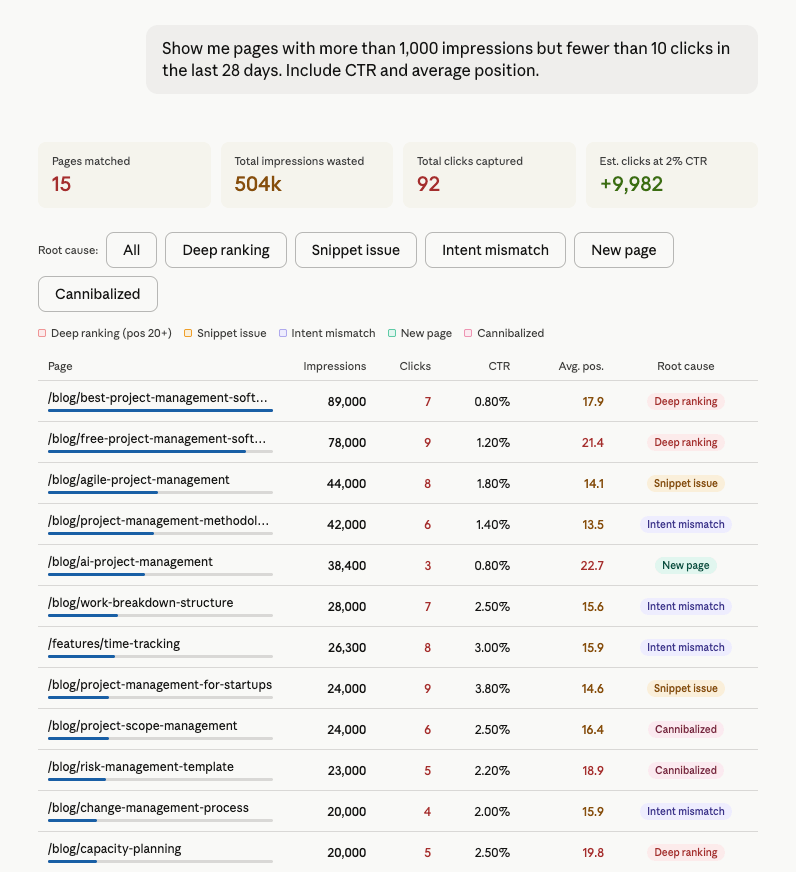
This prompt is useful because not all low-CTR pages have the same problem. And the solution depends entirely on the root cause. A page ranked position 21 needs ranking work before a snippet rewrite makes any difference. A page ranked position 14 with an uncompelling title just needs better copy. If you treat them the same way and you’ll waste time on the wrong things.
Ranking opportunity queries
“Which queries am I ranking position 6–15 for, with impressions above 200 in the last 30 days? Sort by impressions descending.”

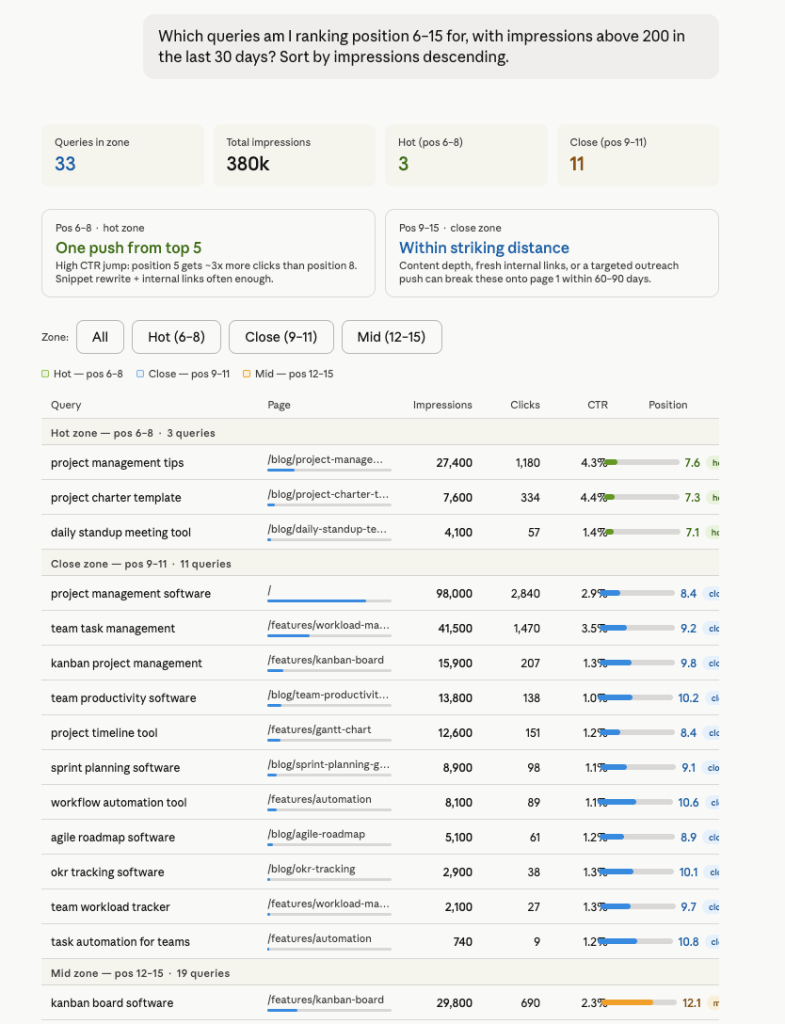
Position 6–15 is where SEO effort has the highest return. Your page is relevant, you just need a nudge to climb higher. This prompt surfaces exactly which queries are in that window and how close they are to page one. Use it to surface internal linking opportunities on pages closest to page one, and prioritize content updates or outreach. You can also pair it with a SERP feature analysis to check if featured snippets or PAA boxes are suppressing CTR on high-impression queries.
Branded vs. non-branded split
“What percentage of my total clicks in the last 30 days came from branded queries vs. non-branded? List the top 10 queries in each category.”

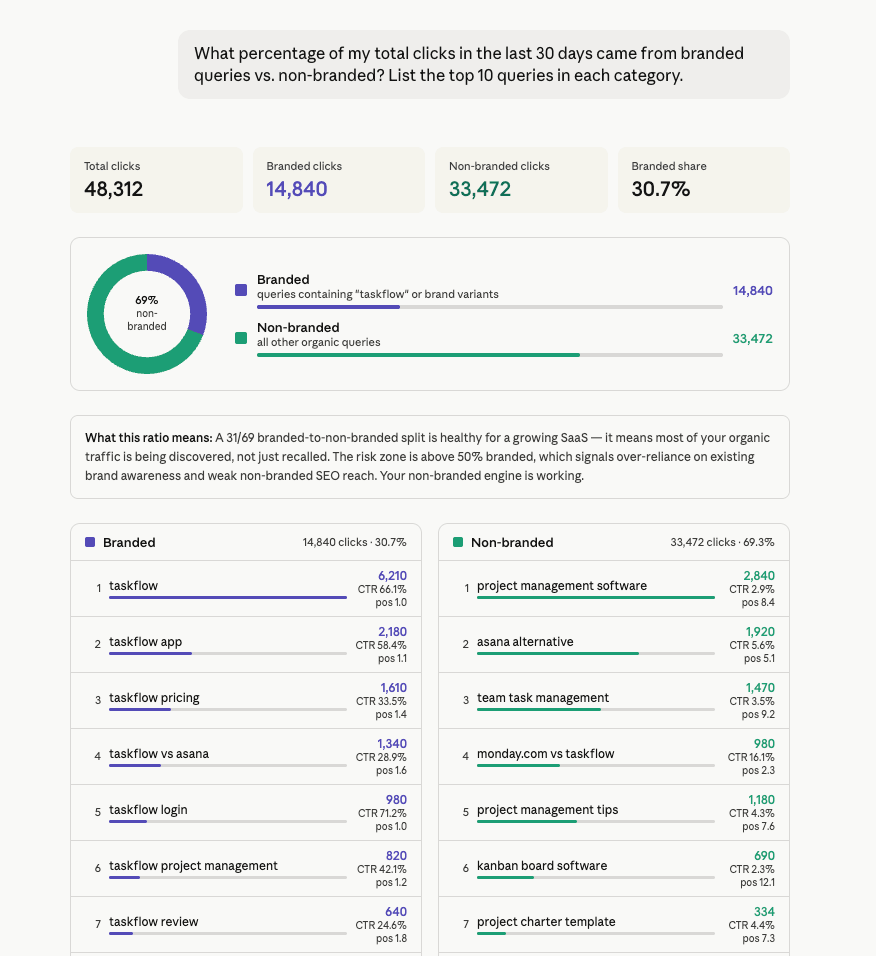
Most teams track total clicks but never separate branded from non-branded or do query clustering. They can’t tell whether growth is coming from new audiences finding them or existing users coming back. This prompt gives you the split clearly, so you know which queries to push harder on and which are already doing the work.
Note: GSC doesn’t tag queries as branded or non-branded natively. For this prompt to work accurately, tell Claude which terms count as branded: your company name, product names, and common misspellings, before running the analysis.
Zero-click pages
“Which pages have had zero clicks in the last 14 days despite having impressions? Sort by impressions descending.”

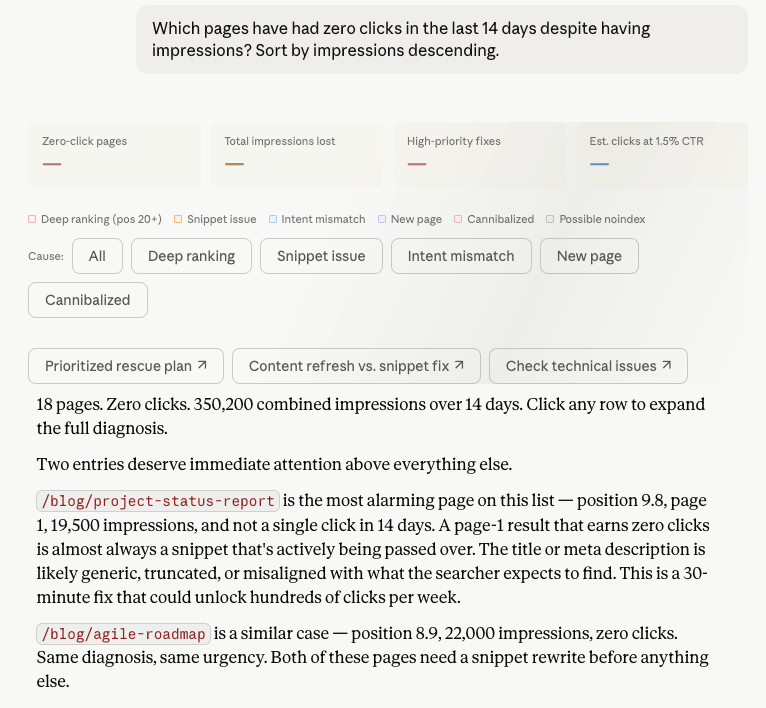
Zero clicks with impressions are pages but nobody is clicking. Some pages rank too deep to earn clicks regardless of the snippet. Others are ranking on page one but the title or meta description is generic. Some rank for queries the content doesn’t actually answer. This prompt separates all three so you fix the right problem on each page.
Top pages by clicks with query breakdown
“Show me my top 5 pages by clicks in the last 28 days and break down which queries drive traffic to each one. Include clicks, impressions, and average position per query.”

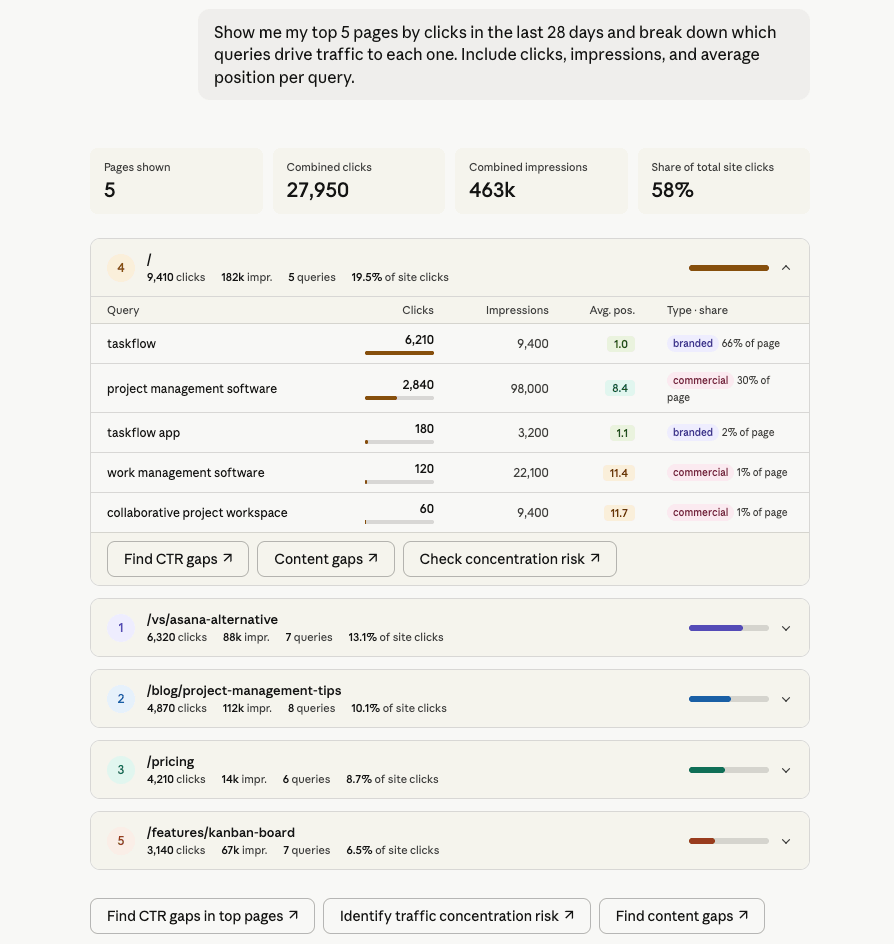
Most sites have a small number of pages driving the majority of clicks. This prompt shows you which queries each top page depends on and how evenly that traffic is spread. A page where one query drives 60%+ of clicks is a risk. A page where traffic is spread across 7–8 queries is resilient. Use it to spot concentration risk soon and identify which top pages have room to grow.
What matters when you automate Search Console reports with Claude
Connecting GSC to Claude is the easy part. Getting reliable, repeatable analysis out of it takes a bit more setup. These four things make the difference.
Business context
Raw GSC data uses URL paths and query strings. For example, Claude doesn’t know that /blog/seo-guide is your highest-traffic content cluster, that “coupler gsc” is a branded query, or that you group pages by content type for reporting. Without the context, Claude makes reasonable guesses, which lead to inaccurate analysis.
Coupler.io lets you attach metric definitions, content categories, and naming conventions to your dataset once. Claude understands that context with every conversation, so you’re not re-explaining your site structure every time. For GSC specifically, this matters most when running SEO audits across a large site, segmenting branded vs. non-branded queries, or grouping pages by topic cluster.
Accurate calculations
Claude interprets patterns and surfaces insights well. It gets unreliable when computing aggregates across large datasets directly.
GSC data has a specific trap: weighted average position. A simple mean across positions is mathematically wrong. Position needs to be weighted by impressions to reflect actual ranking performance. If Claude calculates this directly from a raw dataset, the numbers will be off.
Coupler.io’s Analytical Engine acts as a data preparation layer here. It handles the calculations and returns verified results to Claude. Claude explains the numbers rather than computing them.
Ready-to-use skills
Coupler.io includes pre-built analysis skills that cover common GSC analysis patterns. For search performance data, these help Claude run keyword cannibalization checks, identify quick-win queries by CTR gap and position, and detect ranking drops across date ranges.
Multi-destination
The same Coupler.io data flow that feeds Claude can simultaneously push your GSC data to Google Sheets, Looker Studio, BigQuery, or Power BI. For SEO teams, this means your Claude analysis and your weekly stakeholder Google Search Console dashboard come from the same source and the same refresh cycle.
Other ways to get Google Search Console data into Claude
Coupler.io is not the only path. Claude for SEO professionals, developers, and engineering teams all have different options depending on how much setup they want to own. Here’s what else is available and where each method makes sense.
Manual export
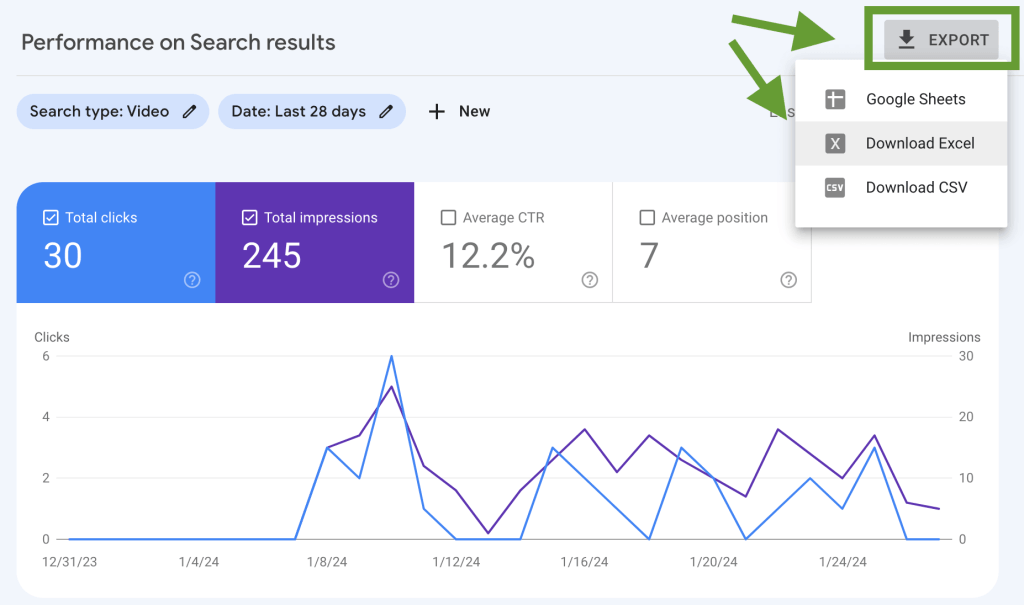
Inside GSC, go to the Performance report, apply whatever filters and date range you need, and click the Export button in the top right. You can download as CSV, Google Sheets, or Excel. Then upload the file directly into a Claude conversation.

It works well for a one-time investigation on a small site. For example, you can check a specific page’s query mix or pull data for a client presentation you’ll never need to repeat.
The limit is 1,000 rows, which covers most small sites but cuts off larger ones. And there’s no scheduling. Every time you need fresh data, you repeat the process manually.
Claude Google Search Console connector (MCP)
There is no native Google Search Console data connector in Anthropic’s Claude connector directory. Instead, you get open-source MCP servers (community-built implementations) that connect the GSC API directly to Claude.
The most active ones on GitHub are ahonn/mcp-server-gsc and AminForou/mcp-gsc. Both get you search performance data to Claude through the Model Context Protocol and support dimensions like query, page, device, and country.
The setup requires Node.js or Python, a Google Cloud project, a service account with Search Console access, and JSON credentials.
The ongoing cost is what to weigh carefully. Credential rotation, version updates, and API quota management add up for every use. If your team has engineering support and wants direct API access without a third-party platform, this is a legitimate option. If you don’t, the maintenance burden will outweigh the benefit.
One thing worth knowing: Coupler.io’s connector is also MCP-based, but available as a ready-to-use Claude connector with no server to build or maintain.
GSC API scripts
The Search Console API gives programmatic access to up to 50,000 rows per query. A Python or JavaScript script using OAuth can pull data on a schedule and feed it to Claude through function calling.
This is useful if you’re already running a data pipeline and want GSC as one input among others. Or, you need full control over how data is shaped before Claude sees it.
In this method, you’re building and maintaining two integrations: one with the GSC API and one with Claude. Both APIs update, both require credential management, and both will break at some point and need fixing.
Which method should you choose?
The right method comes down to three questions.
How often do you need fresh GSC data in Claude?
If it’s a one-time investigation, the manual export is enough. If you need fresh data weekly or more, that manual step compounds fast and you need something that refreshes automatically.
Does your team have engineering support?
An open-source MCP server works if someone on your team is comfortable with Node.js or Python, Google Cloud service accounts, and API credential management. If not, the maintenance cost will land on whoever set it up every time something breaks. Coupler.io removes that layer entirely.
Do you need conversational analysis or a custom pipeline?
For most SEO and marketing teams, asking Claude questions through an MCP connection is the right fit.
Between Coupler.io and an open-source MCP server, the difference is maintenance. Both use MCP, but Coupler.io manages the connection, handles credential rotation, and keeps the data refreshed. An open-source server gives you more direct API access and no third-party in the middle. But everything that breaks is yours to fix. If you’re integrating GSC into a larger data warehouse or building something programmatic, the API route gives you the most control.
Use Coupler.io to get analysis-ready GSC data into Claude
Get started for freeFAQs
1. Does Claude work with GSC API limits?
Connecting through Coupler.io keeps you well within the GSC API’s 200 queries per day limit. It fetches data on your schedule and stores it. Claude reads from Coupler.io’s structured output, not the GSC API directly. Every question you ask Claude doesn’t trigger a new API call. Open-source MCP servers work differently. Claude queries the GSC API more directly, and high-frequency use can push against those limits.
2. Can I connect multiple GSC properties in one data flow?
Yes. Coupler.io supports multiple GSC accounts in a single data flow. Useful for agencies managing several client sites or teams tracking more than one domain. Claude can compare performance across properties in the same conversation.
3. Does Coupler.io work with both Claude Desktop and Claude Web?
Yes. The Coupler.io MCP connector works through Claude’s connector directory, available on both the desktop and web versions.
4. Does Claude get access to all my GSC data?
Claude sees only the data included in your Coupler.io data flow. Set a date range, country, or device filter in the source configuration, and Claude works within that scope. It reads what you share and cannot modify anything in your GSC account.