Instagram deletes Stories data from its API within 24 hours. Most other Insights metrics disappear after 90 days. If you’re exporting data manually, every file you pull is already a snapshot of a shrinking window. By the time you’ve cleaned and merged four separate exports into something Claude can read, the numbers are older still.
Coupler.io solves both problems. It syncs your Instagram data on a schedule and pre-processes the metrics. So Claude gets clean numbers instead of fragmented raw files, and nothing expires. I’ll walk through how to connect Instagram Insights to Claude with Coupler.io to analyze content performance via conversations, not merging spreadsheets.
Choose the right method to analyze Instagram Insights data with Claude
Comparison table:
| Connection method | Setup effort | Who does the math | Best for | Watch out for |
|---|---|---|---|---|
| Coupler.io | Low (no-code) | Analytical Engine | Recurring analysis with fresh, pre-processed data | – Refresh starts on paid plans; free plan runs manually only |
| Third-party MCP connectors | Low to medium | Claude | Conversational lookups, quick setup, on-demand queries | – Raw data passed directly to Claude – Metrics may not be normalized across media types; Claude handles calculations – Stories data expires from the Instagram API 24 hours after a Story disappears; if the connector doesn’t sync daily, historical Story metrics are lost permanently |
| Manual export (Meta Business Suite) | None | You | One-off analysis | – 90-day cap – Separate files per content type – Metrics may not be fully stabilized at time of export; no recurring use |
| Custom MCP server | High (dev required) | Claude | Full control, proprietary systems | Build and maintenance cost; Graph API evolves |
| API scripts / function calling | High (dev required) | Claude or script | Scheduled pipelines or conversational queries via Graph API | Requires proficiency with both APIs; build and maintain cost |
If you need to ask Claude about your Instagram performance regularly, Coupler.io is the shortest path: no-code setup, scheduled refresh, and pre-processed metrics. For a one-off question, manual export works. For full control over the data pipeline, a custom MCP server or API script gives you that at the cost of engineering time.


Analyze your Instagram Insights data in Claude with Coupler.io
Get started for freeUse the Claude Instagram Insights connector by Coupler.io
Coupler.io is a data integration platform and AI analytics. It connects data from Instagram Insights to Claude for conversational data analysis. Once connected, you ask Claude questions about your Instagram performance in plain language and get answers based on structured, pre-processed data.
Instagram splits metrics across four views (posts, reels, stories, audience), and the fields overlap in ways that confuse Claude when passed raw. Coupler.io’s Analytical Engine computes engagement rates, saves per impression, and completion rates, keeping formats separate. Claude interprets verified results instead of guessing which numbers belong together. The data refreshes on your schedule, which matters here more than most sources: Stories data disappears from the API within 24 hours.
It only takes a couple of minutes to connect Instagram Insights to Claude.
Step 1: Create a data flow for Instagram Insights data
Sign up for Coupler.io and create a new data flow with Instagram Insights as the source and Claude as the destination. Use the preset form below to get started right away for free with no credit card required.

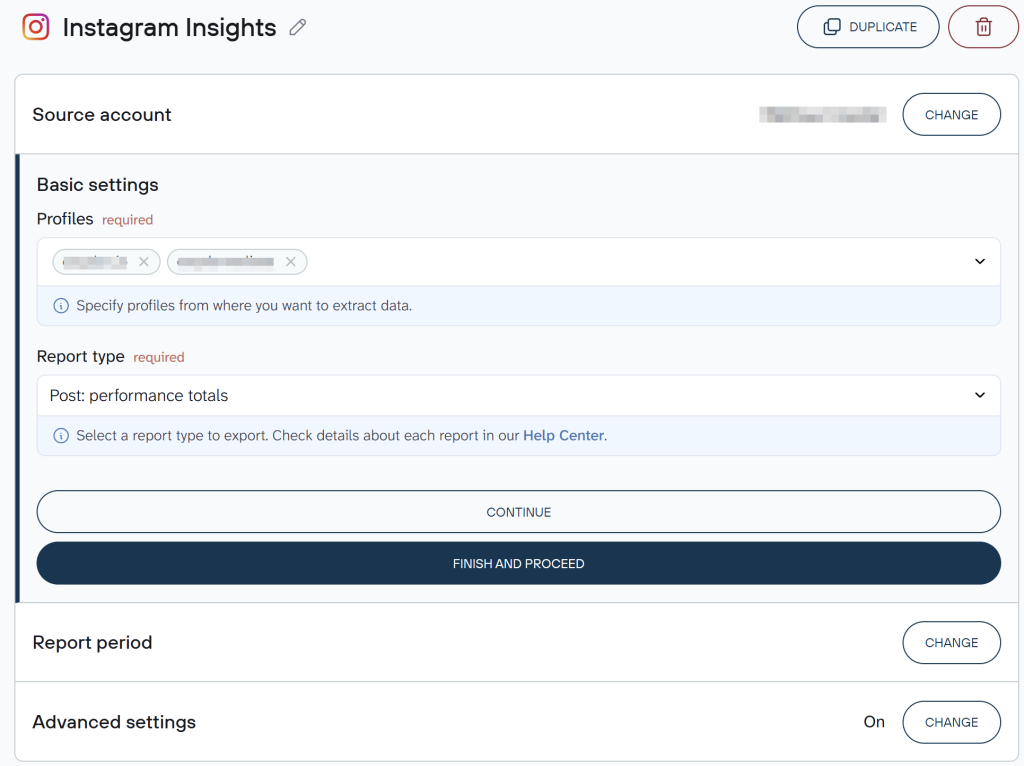
Connect your Instagram business or creator account through Meta’s OAuth authentication. Personal accounts don’t have access to Insights. Then configure the source settings:
- Instagram account — select profiles you want to pull data from.
- Report type — choose a report related to profile, post, or story insights, such as Profile: account overview, Story: navigation by action type (last 24 hours), etc.
For certain types of reports, you’ll also need to set the period you want to analyze.

Coupler.io also allows you to add multiple Instagram accounts or blend Instagram Insights data with information from Meta Ads and other sources for cross-platform analysis.
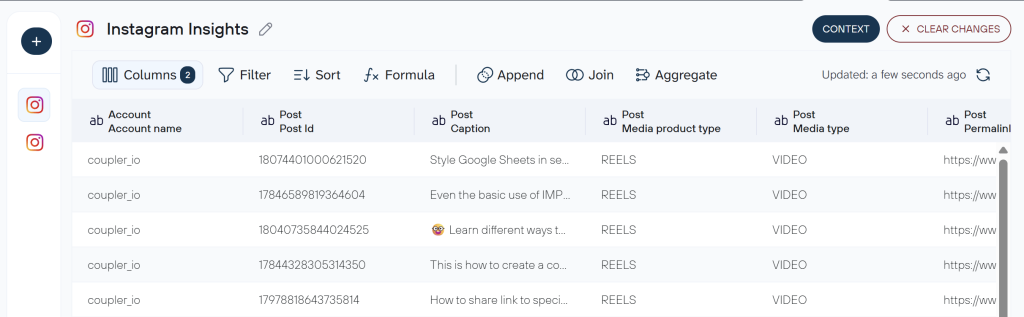
Step 2: Organize your data and add context
Before Claude sees your data, Coupler.io lets you shape it. This is where reliable recurring analysis starts.
You can filter and aggregate data by date range, account, or content type. Hide columns that aren’t relevant or if they contain personally identifiable information (PII). Create formula columns (for example, a saves-per-impression metric calculated directly in the flow). If you’ve connected multiple Instagram accounts or want to combine Instagram data with Google Ads or a CRM, use the Join or Append options to consolidate sources into one table.

During this step, Coupler.io allows you to attach business context. In the context editor, you define your team’s rules once: which engagement rate formula to use, whether story interactions count, how to handle audience demographic breakdowns, and others. Claude applies those definitions to every query automatically, so your numbers stay consistent across sessions and match what’s in your existing reports.
Step 3: Connect Claude and set your refresh schedule
Once the data flow is ready, click Get connector to open the Coupler.io connector page inside the Claude app. Follow the authorization flow to connect.
Go back to Coupler.io to run the data flow and set your refresh schedule. For Instagram Insights, daily is the minimum worth setting. Instagram deletes Stories data from its API within 24 hours of a Story expiring, so if Coupler.io doesn’t sync in time, that data is gone permanently.
Connect Instagram Insights data to Claude with Coupler.io
Get started for freeThe first time Claude needs your Instagram data, it will ask you to confirm the Coupler.io connection. Once you confirm, it queries your Instagram data flow directly and returns results that the Analytical Engine has already calculated.
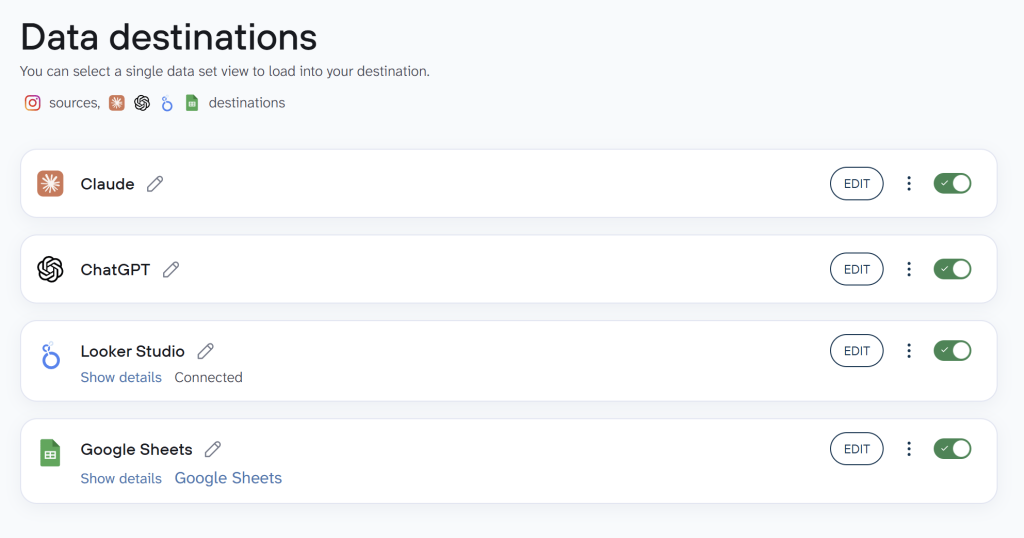
Note: In Coupler.io, you can setup up multiple destinations for a single data flow. For example, the same Instagram Insights data set can be connected to Claude, ChatGPT, Data Studio, Google Sheets, etc.

Examples of how to use Claude with Instagram Insights
Preparing data for analysis is not straightforward. From exporting separate files to merging them to running the calculations to drawing conclusions, the whole process can possibly take an afternoon.
With Instagram data connected to Claude, each of the following takes a single prompt. Here are the three I’d prioritize.
Content format performance: Where to put next month’s production time
Reels take longer to make than carousels or single images. If you don’t know which format is actually driving reach and saves for your audience, you’re making that call on gut feeling instead of a content strategy backed by data.
Instagram Insights shows you how individual posts performed. But comparing averages across formats, including Reels performance and more, means pulling data from separate views and doing the math yourself. Let Claude do it instead:
Prompt:
I have 90 days of Instagram Insights data across feed posts, Reels, and carousels. Compare average reach, saves, and shares by content format. Which format is generating the most saves per impression, and is there a consistent pattern by day of week or content topic?

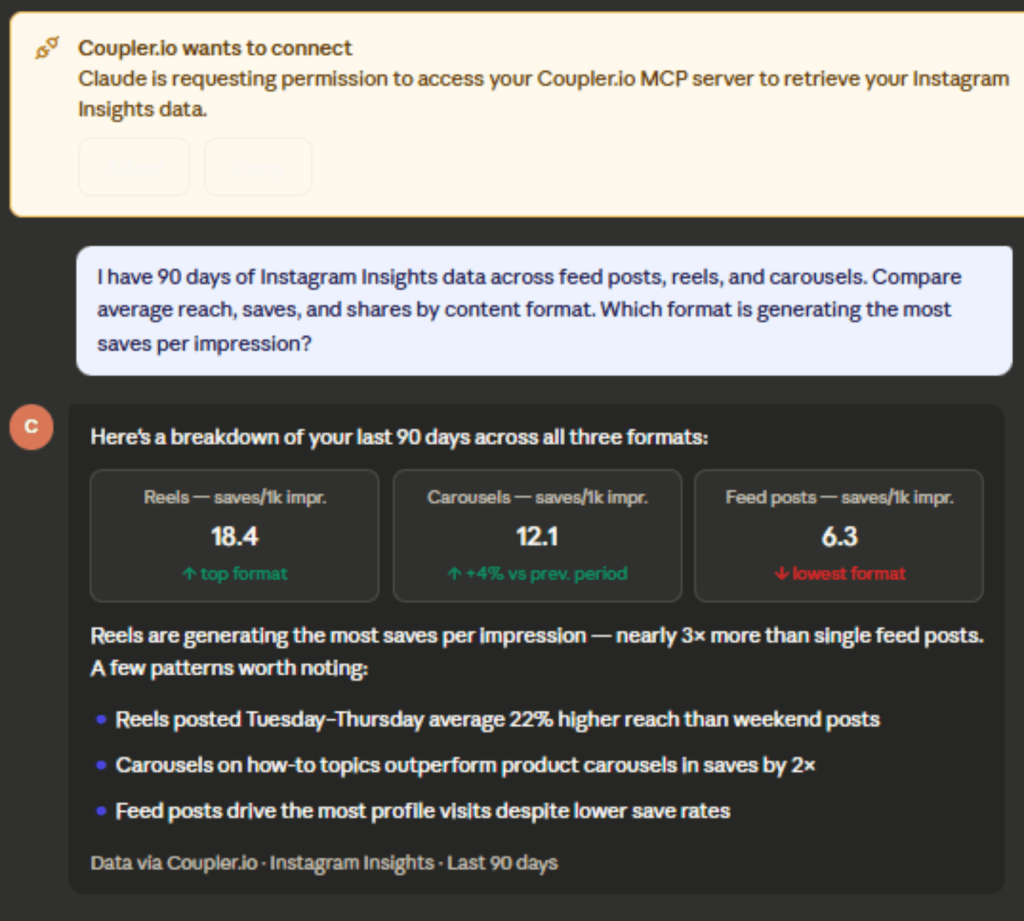
When you connect Instagram Insights to Claude, you can have Claude break down performance by format with calculated rates and tell you where to focus your production time. Watch for which format drives the most saves, whether the reach gap between formats is big enough to justify the extra production time for Reels, and whether certain content topics perform well across all formats.
Replicate a follower spike your client is asking about
A client noticed their follower count jumped a few weeks ago, so now they want to know what caused it and how to make it happen again. Instagram Insights shows you follower gains and losses by day, but it doesn’t tell you which posts drove the movement. Finding the answer manually means going through your publishing calendar day by day and matching it against the follower graph. Retrieve the info faster and summarize Instagram Insights with Claude instead.
Prompt:
Here is my Instagram follower growth by day for the last 60 days, alongside my post schedule and content type. Identify the days where follower growth was highest and tell me what I published in the 48 hours before each spike.
Are there patterns in content type, topic, caption length, or posting time?

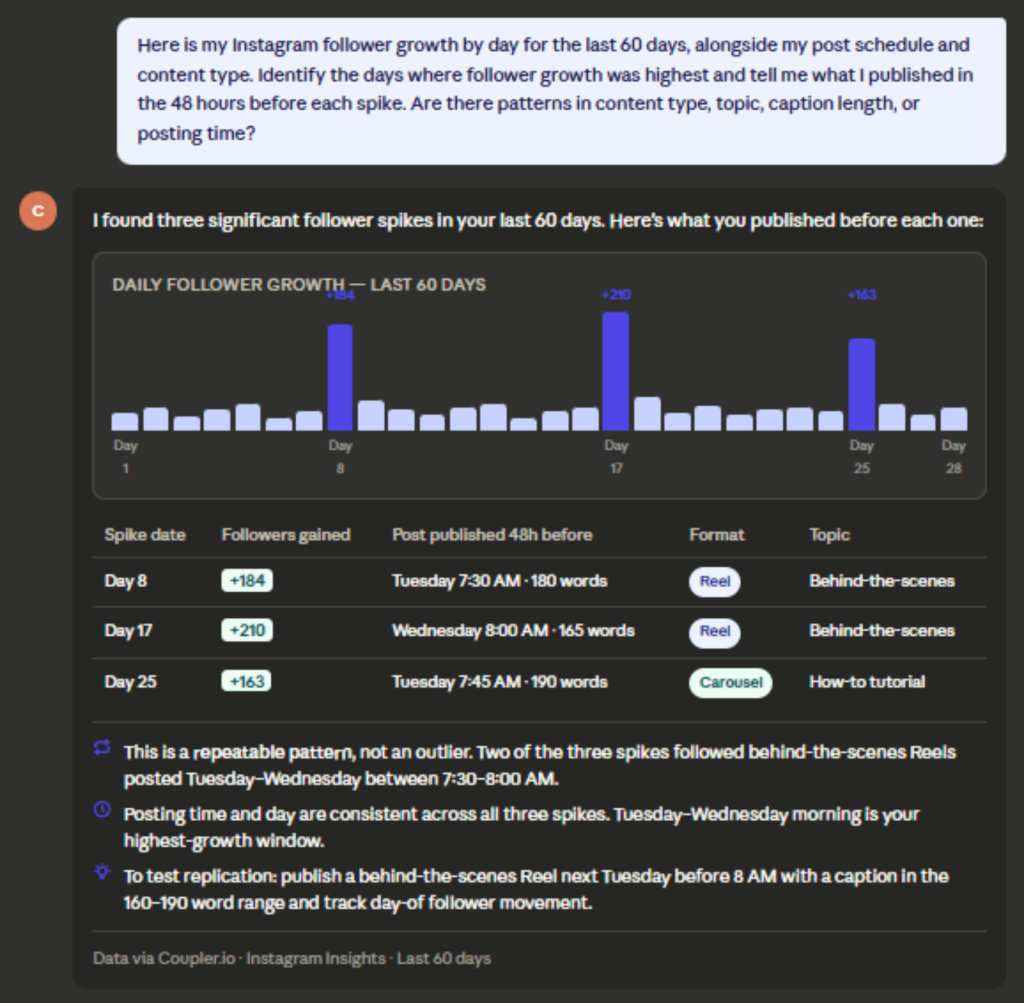
Your publishing activity will be mapped against the growth timeline, and patterns across formats will be highlighted. Demographic data can also add context to who drove the spike. Note: follower growth metrics are only available for accounts with 100+ followers. This Instagram performance analysis with Claude won’t work for smaller accounts. Look for these:
- Which post characteristics showed up before the biggest spikes
- Whether the growth was tied to one outlier post or a repeatable pattern
- What to test next to try to replicate it
This type of Instagram follower analysis with Claude AI takes one prompt instead of a manual calendar audit.
Decide whether your stories are long enough or too long
Most Instagram managers post stories based on feel. More frames can mean more visibility, or so the thinking goes. But if your audience is dropping off at frame three of eight, posting more stories is making things worse, not better.
Story completion rate tells you exactly where you’re losing people, but it’s buried in per-story data, and most teams have never added it up across a full month. Get the full picture instead.
Prompt:
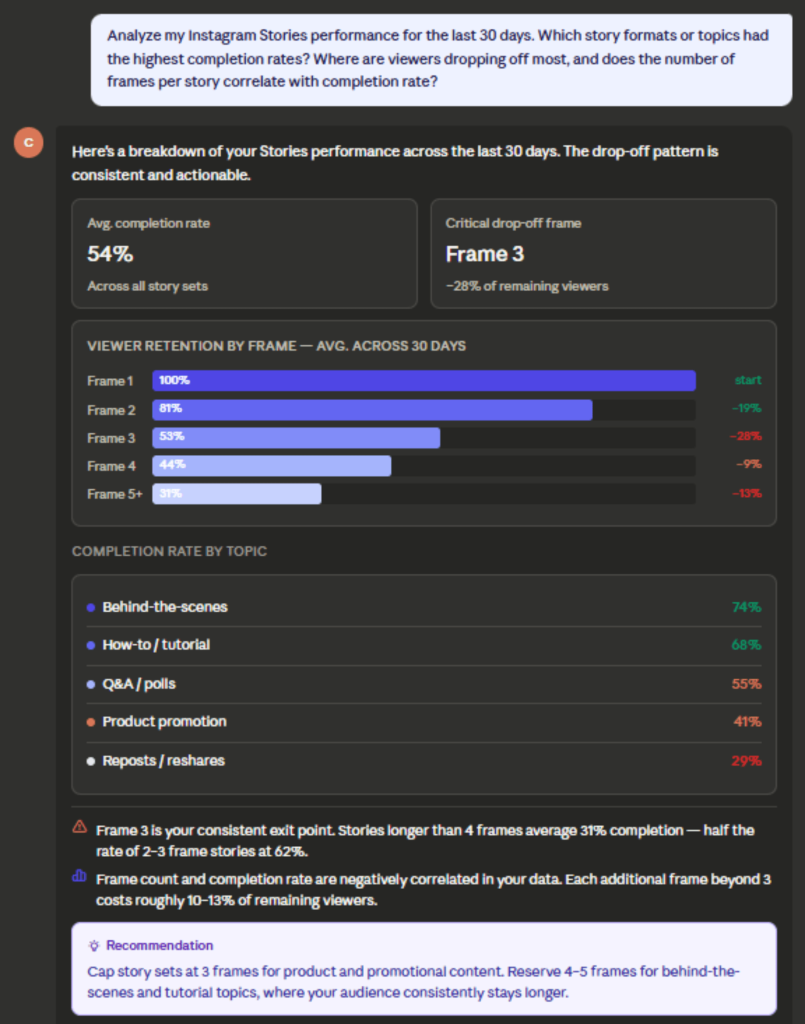
Analyze my Instagram Stories performance for the last 30 days. Which story formats or topics had the highest completion rates? Where are viewers dropping off most, and does the number of frames per story correlate with completion rate?

One thing to know before you connect Instagram Insights to Claude and run this: Instagram only keeps Stories data for 24 hours after a Story expires. If Coupler.io didn’t sync during that window, the data is gone and can’t be recovered. The daily refresh setting in Step 2 is what makes this analysis possible.
Claude breaks down completion rates by story length, topic, and format, and shows you where viewers are dropping off. Pay attention to the frame count where your audience typically stops watching, which content types hold attention the longest, and provide a clear recommendation on how to structure stories going forward.
Talk to Claude about your Instagram performance
Try Coupler.io for freeClaude prompts for Instagram Insights analysis
These prompts work directly with your Instagram data once it’s connected. Adjust the time ranges to fit your needs.
- “
Which content format (Reels, carousels, or single images) drove the most saves over the last 60 days? Show the breakdown by format and identify any patterns.“ - “
Compare my story completion rate this month vs. last month. Which story topics or formats had the biggest change?“ - “
Show me which posts generated the most profile visits last month. What did the top-performing posts have in common?“ - “
Break down my follower growth by week for the last 90 days. In weeks where growth was highest, what did I publish?“ - “
Which days and times had the highest reach for feed posts in the last 90 days? Is there a consistent pattern?“ - “
Calculate my engagement rate (interactions divided by reach) by content type for the last 30 days. Which format has the best ratio?“ - “
Identify any posts from the last 90 days that had high reach but low saves. What might explain the gap?“ - “
Compare Reel play counts, video views, and total watch time across my last 20 Reels. Calculate average watch time per play for each Reel. Is average watch time correlated with reach?“
What matters when you connect Instagram Insights data to Claude
Most teams connect their data, ask Claude a question, and get an answer that doesn’t match their dashboard. The connection isn’t the problem. It’s what wasn’t set up before the first query. Here’s what actually determines whether the analysis holds up.
Business context
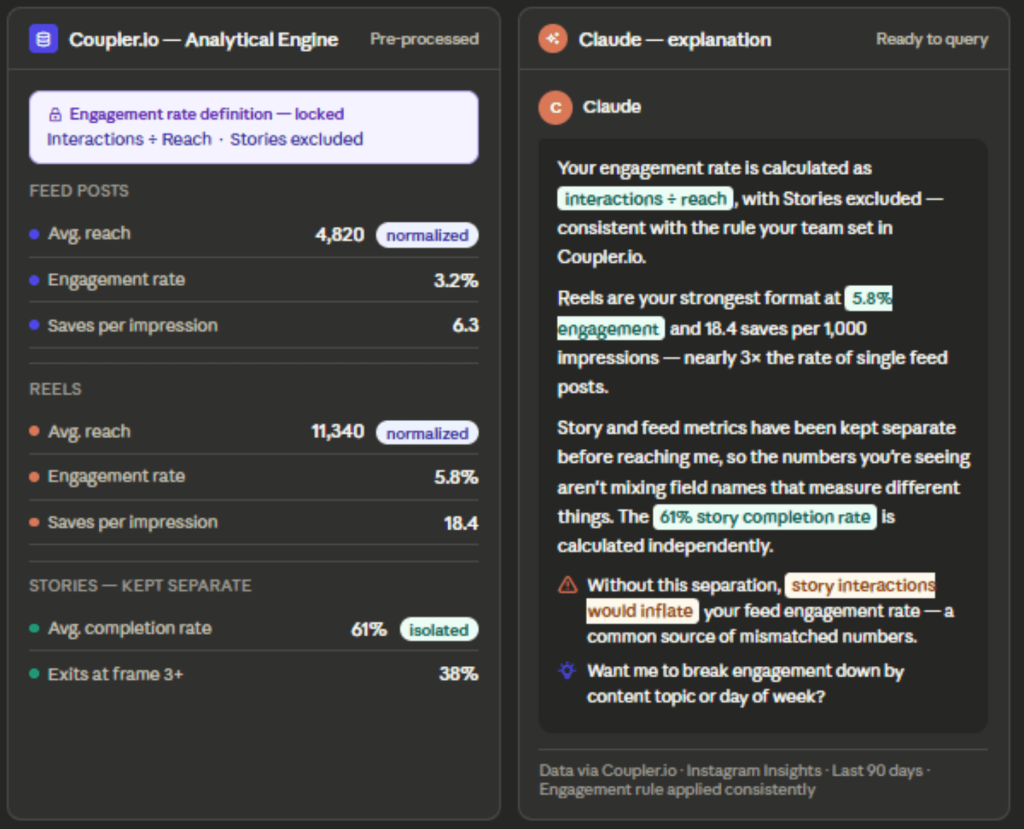
Consistent Instagram engagement analysis Claude delivers starts with one decision: how your team defines engagement rate. Some divide interactions by reach, others by follower count, others exclude story interactions entirely.
Lock that in before you query data in Claude, and Claude applies the same formula every time. Your numbers stay consistent across sessions and match what’s in your reports.
Coupler.io’s context feature is where you set that rule. Write it once in the context editor, and it travels with every query automatically. You never have to re-explain it in a new conversation.
Accurate calculations
You want the numbers Claude returns to match what’s in your reports. Not approximately. Exactly.
Consistent numbers are what make week-over-week comparisons meaningful. Coupler.io’s Analytical Engine separates the inputs by format, processes each independently, and runs verified calculations before anything reaches Claude. What’s left to Claude is to explain the result.

Ready-to-use skills
Coupler.io’s analytics skills provide a working framework for social media analysis. Instead of having to explain how Claude should handle fragmented feed posts or how to calculate saves-per-impression without conflating media types, the skill carries that analytical structure. Be it Instagram reels analytics with Claude, story completion breakdowns, follower trends, or anything else, the skill handles the format separation so you don’t have to.
You can ask simple questions and get straight answers: which format delivered the most saves last month, how follower growth matched your posting cadence, where story completion dropped off. The conversation starts with your question, not a setup ritual.
Multiple destinations
On a typical Monday morning, a social media manager handles three tasks in quick succession. First, answer a client’s question about last week’s Instagram performance in Slack. Next, update your Instagram Insights dashboard in Data Studio before the 10 a.m. call. Finally, dig into why reach dropped with Claude to shape next week’s content plan.
A single Coupler.io data flow handles all three steps. The same data reaches Claude via the MCP connector and Looker Studio as the flow’s second destination. There’s no exporting, no reformatting, and no manual updating between tasks. The team stays aligned, decisions come faster, and nothing slips through the cracks.
Other ways to load Instagram Insights data to Claude
There are several ways to get Instagram Insights data into Claude. The method that works best depends on your team’s technical capacity, how often you need fresh data, and what you’re actually trying to analyze.
Manual export
Manual export is done through Meta Business Suite, the same platform you use to manage your Facebook Page, not the Instagram app itself. Navigate to Insights → Content → Export Data, then pick the account, timeframe, and asset type. Exports for posts and stories come as separate files, and the date range tops out at 90 days.
The lack of a shared key means you’ll need to merge the files by hand for any blended analysis. It’s fine for a quick one-off question, but it isn’t practical for recurring dashboards. To stay organized, use a consistent naming scheme and a shared folder for exports. For ongoing needs, consider automated options to move data into Claude.
Third-party MCP connectors
There are several no-code MCP connectors available from Claude’s connector directory. You can install them in a few clicks.
They work well for conversational lookups and quick ad hoc questions. The tradeoff is that most pass raw or lightly processed data directly to Claude, leaving the calculations to the AI. Before choosing, check whether the Instagram Insights data connector normalizes data across media types before passing it on.
- For most data sources, this is a minor technical detail.
- For Instagram, it matters more because Feed posts, Reels, and Stories use overlapping field names that measure different things. A connector that passes raw data without separating them will leave the sorting out between different formats, such as Instagram Stories analytics with Claude.
- For simple single-format queries, that’s usually fine. For cross-format comparisons (for example, average saves per impression across Reels vs carousels), reliability hinges on whether that normalization has already happened.
Coupler.io’s connector is also MCP-based but adds pre-processing via the Analytical Engine before data reaches Claude. That makes all the difference.
Custom MCP server
Building a custom MCP server against the Instagram Graph API gives you granular control over data exposure, formatting, and integration with other data streams. You can tailor data pipelines, caching strategies, and error handling to your environment.
This setup supports nuanced analytics and dashboards that rely on stable data shapes. It also centralizes governance and access control. It’s best for engineering-focused teams that want to blend Instagram data with proprietary sources at scale.
The costs are real: development time, hosting, and ongoing maintenance as the Graph API evolves. Be ready for updates, security patches, and performance tuning. If you value flexibility and deeper integration over time, it’s worth it.
API scripts and function calling
Scheduled API scripts pull data from the Instagram Graph API and put it in a Claude-accessible place. This creates a fixed, repeatable pipeline. Easy to track. But it needs someone who knows both the Graph API and the destination, plus the ability to handle errors and monitor for breakage as the API changes.
Function calling lets Claude fetch data at query time, which is good for unpredictable queries but raises design, latency, and security questions. Both options require engineering effort to keep running.
Warehouse / ETL pipelines (advanced)
If your organization already has a data warehouse, you can pull Instagram data into it and run SQL MCP queries for combined analytics. It’s best suited for cross-channel insights rather than pure Instagram work.
Expect data engineering, ETL pipelines, ongoing maintenance, governance, schema management, and careful handling of data freshness. This approach makes sense when you already have a warehouse layer and need cross-channel analytics to justify the overhead.
Which method should you choose?
A one-off question doesn’t need a pipeline. Download the files from Meta Business Suite, upload them to Claude, and ask. The 90-day cap and fragmented files are a hassle, but not a dealbreaker for a single analysis.
Weekly or monthly analysis is a different story. Stories expire from the API in 24 hours, and audience metrics lag by up to 48 hours. Manual exports go stale fast. A connector that syncs daily keeps Claude current without you touching it.
Teams with engineering capacity who need full control over data access should look at a custom MCP server or API pipeline. You own the infrastructure, the caching, and the error handling. You also own the maintenance.
For most teams doing recurring analysis, Coupler.io is the practical path. The Analytical Engine pre-processes the numbers, the context editor locks in your definitions, and the same data flow feeds Claude, Looker Studio, and Google Sheets without separate exports.
Get analysis-ready data to build insightful reports
SIGN UP FOR FREEFAQs
Is connecting Instagram Insights to Claude safe?
Yes. Connectors using Instagram’s Graph API (Coupler.io, Windsor.ai, Porter Metrics, Adzviser) authenticate via Meta’s OAuth authentication, so you sign in on Instagram and never share credentials. Access is read-only: reach, impressions, follower metrics, and content performance. You can’t DM, post, or manage the account, and you can revoke access anytime from Settings > Security > Apps and Websites.
With Coupler.io, data sits in its own pipeline between Instagram and Claude. Claude doesn’t persist Instagram data between chats, and Anthropic deletes conversation data within 30 days (or you can delete conversations manually).
Can I connect multiple Instagram accounts?
Yes. Coupler.io supports multiple Instagram accounts in a single data flow, which is particularly useful for agencies managing several clients. Other third-party MCP connectors also highlight multi-account support as a core feature.
Does this work with personal Instagram accounts?
No. Instagram Insights is only available for business and creator accounts. Personal accounts don’t have access to performance data, so any connector, Coupler.io or otherwise, requires a professional account to function.
How far back does Instagram Insights data go?
Instagram retains most Insights metrics for approximately 90 days. Stories data is even shorter. It expires from the API within 24 hours of a Story disappearing, so daily syncing is the only way to build a historical record of completion rates and other Stories metrics. For all other content types, syncing regularly is the only way to preserve data beyond the 90-day window.
Can I combine Instagram Insights with Meta Ads or other data sources in the same analysis?
Yes. Coupler.io has dedicated connectors for Instagram Insights, Instagram Ads, and Instagram Public Data, so you can blend organic performance with paid data in a single flow. You can also pull in Google Analytics, a CRM, or other sources. If you want to analyze accounts you don’t own, such as a competitor’s public profile, Instagram Public Data is the connector for that. Insights is limited to accounts you have professional access to.