YouTube Studio shows you the numbers but won’t answer questions. CTR dropped. Studio won’t tell you why. One video got 3x the impressions of everything else. Studio won’t tell you what was different. I keep seeing the same workaround: export CSVs, clean them manually, build a comparison in a spreadsheet, and hope the answer is somewhere in there.
What you actually want is to ask a question about your channel data and get an answer. Claude can give you that, but it needs access to your structured channel data. Learn how you can connect YouTube to Claude using Coupler.io and what kinds of YouTube data analysis you can run once the connection is live.

TL;DR: Which methods let you analyze YouTube data with Claude
| Connection method | What data it reaches | Setup effort | Best for | Watch out for |
|---|---|---|---|---|
| Coupler.io | Channel analytics: views, watch time, CTR, retention, subscribers, traffic sources, playlist data | Low, no code, no API keys | Recurring analysis of your own channel on a schedule | Automated data refresh is only available on paid plans |
| Manual export (YouTube Studio CSV) | Channel analytics for a selected period | Medium, one export per session | One-time review of a specific video or period | No automation; data is stale the moment you download it |
| Community MCP servers (e.g., mcp-youtube) | Public video transcripts and basic metadata | High, local install and CLI setup required | YouTube transcript analysis and video summarization | No channel analytics; no CTR, retention, watch time, or subscriber data |
| YouTube Data API + Python | Public metadata and your own channel analytics via OAuth | High, requires building and maintaining a pipeline | Custom workflows, competitor research | API key management, quota limits, JSON parsing, ongoing engineering work |
Claude YouTube connector by Coupler.io for accurate analytics
Coupler.io is a no-code data integration platform and AI analytics solution. It connects data from YouTube Analytics and over 400 business sources to Claude, ChatGPT, Gemini, and other AI tools through its MCP server. You ask Claude a question in plain language and get answers based on your up-to-date numbers, not a file you exported last Tuesday. This allows you to generate insights across your full video library without touching a spreadsheet.
Learn how to connect business data to Claude.
Coupler.io pulls impressions, CTR, watch time, retention curves, and other data from YouTube and structures it as a data set. Claude sends queries based on your quesiton to Coupler.io, which uses the Analytical Engine to handle calculations. So what Claude returns is interpreted output, not raw arithmetic on summarized data. Here is what the flow to connect YouTube to Claude looks like.
Step 1: Create a data flow for your YouTube data
To get started, create a new data flow in Coupler.io with YouTube as the source and Claude as the destination. Use the form below, then click Proceed to sign up for Coupler.io for free.
URL/ widget
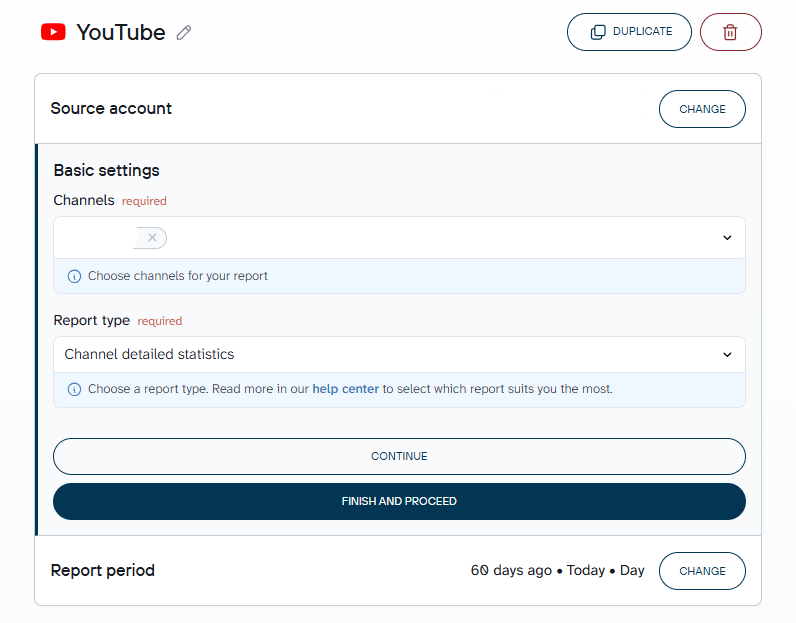
Connect your YouTube account and select one or more channels from the dropdown. From there, choose the report type you want included: Channel detailed statistics, Channel statistics by content and subscriber type, and others.

Coupler.io will preview your YouTube data before it reaches Claude, so you can make any necessary transformations. Rename fields, hide columns you don’t need, add calculated metrics, or aggregate data across multiple channels and date ranges. It’s also worth attaching business context directly to the dataset at this stage: metric definitions, naming conventions, or any logic specific to your channel. Claude receives that context with every query, not just the first one.

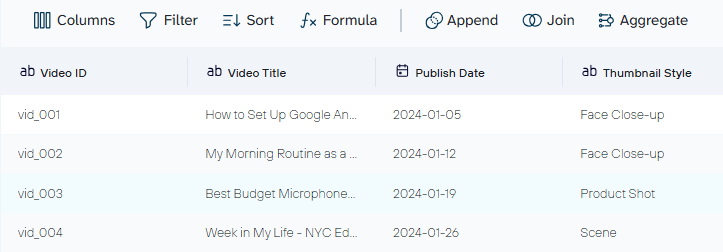
It’s also possible to add more sources like other YouTube channels, Google Sheets, GA4, or other connected apps for cross-platform analysis in a single Claude conversation.
Step 2: Connect data to Claude
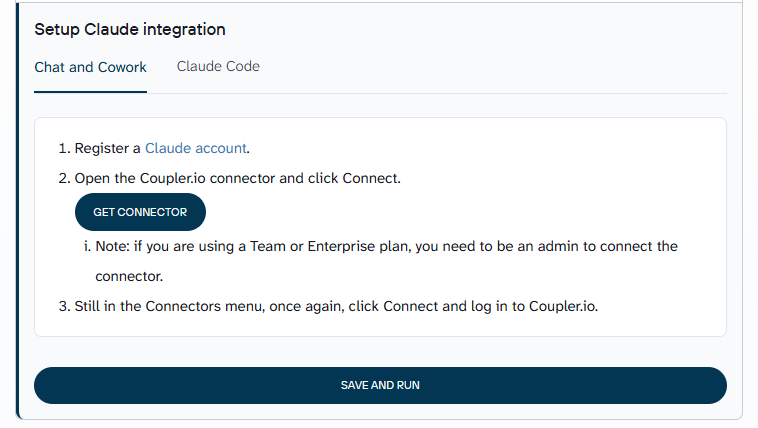
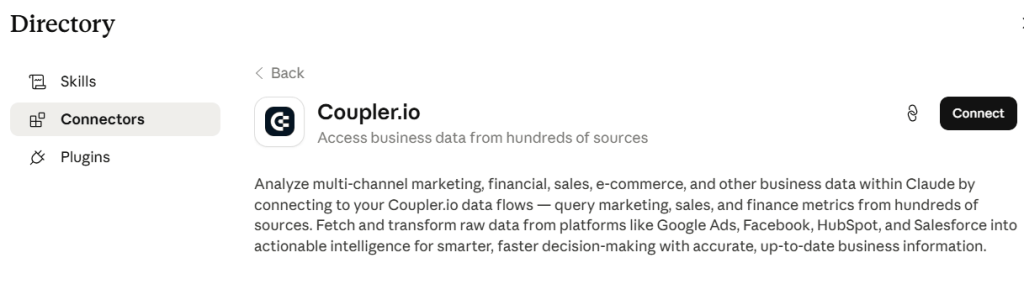
Once your dataset is ready, set Claude as the destination. Click Get connector to open the Claude connector directory. Connect it and authorize Claude to access your Coupler.io workspace.

AI integrations by Coupler.io include ChatGPT, Gemini, Cursor, and others.
After authorization, the Coupler.io connector appears in your Claude session and is ready to pull your YouTube channel data on demand.

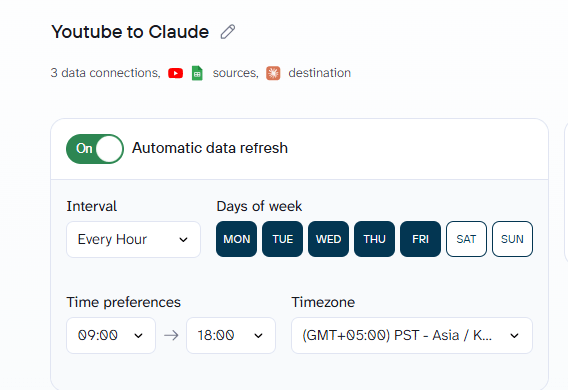
Back in Coupler.io, click Save and Run to push the first data load. From there, enable automatic data refresh on a schedule. This is what automates your YouTube data tasks, so Claude is always working from up-to-date analytics, not a snapshot from the last time you manually triggered a run.

Step 3: Start a conversation with Claude about your YouTube channel
After the first run, open Claude at claude.ai or in Claude Desktop. To chat with your data, Claude will ask permission to connect to the Coupler.io MCP server. Approve it, and your YouTube channel data is ready for analysis.
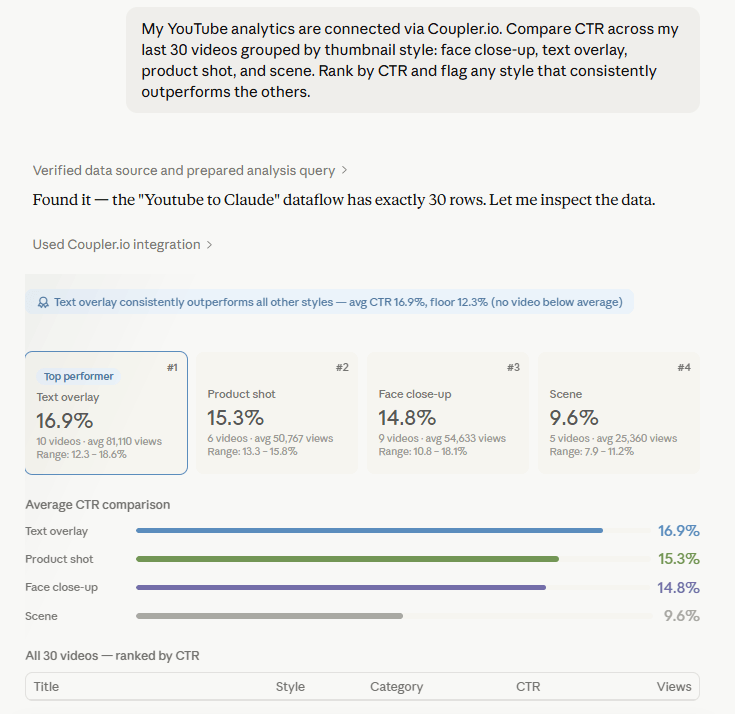
Here is a prompt to start with:
My YouTube analytics are connected via Coupler.io. Compare CTR across my last 30 videos grouped by thumbnail style: face close-up, text overlay, product shot, and scene. Rank by CTR and flag any style that consistently outperforms the others. |

What YouTube data you can connect to Claude
Coupler.io pulls from various YouTube Analytics report types. Each one maps to a different category of analysis you can run in Claude:
- Channel detailed statistics: overall channel performance, including views, watch time, impressions, and CTR over time. This is the foundation for trend analysis Claude.ai runs for you, tracking which metrics are improving or declining across your channel.
- Channel statistics by content and subscriber type: how subscriber and non-subscriber audiences engage with your content differently. This is what enables YouTube audience analysis Claude can break down by content category and viewer type.
- Channel subscribers: net subscriber change over time, including gains and losses per period
- Video detailed statistics: per-video CTR, watch time, retention, and impressions
- Video statistics by content and subscriber type: how different audience segments respond to each individual video
- Traffic sources: where viewers find your content, broken down by YouTube search, suggested videos, browse features, external sources, and direct
Each report type connects separately, so you can pull only what you need or combine several in one data flow for broader analysis.


Easy YouTube analytics in Claude with Coupler.io
Get started for freeExamples of how to use Claude with YouTube channel data
Check out a few examples of how you can analyze data in Claude with the help of the YouTube connector by Coupler.io. Each one starts with a prompt you can copy directly.
Finding which videos earn their impressions
The most direct way to analyze YouTube CTR with Claude is to compare it against impressions across thumbnail styles. YouTube shows them in separate views inside Studio. Comparing them across video topics, thumbnail styles, or publishing periods requires pulling multiple exports and building a manual cross-reference. Most creators skip it and make packaging decisions based on intuition.
With your YouTube channel data connected through Coupler.io, you can ask Claude to run that comparison directly:
Using my Coupler.io YouTube data, analyze my last 90 days of video performance. Group videos by thumbnail style: face close-up, text-heavy, product shot, and scene. Calculate average CTR and average impressions per group. Which thumbnail style generates the most clicks per impression? Flag any outliers. |

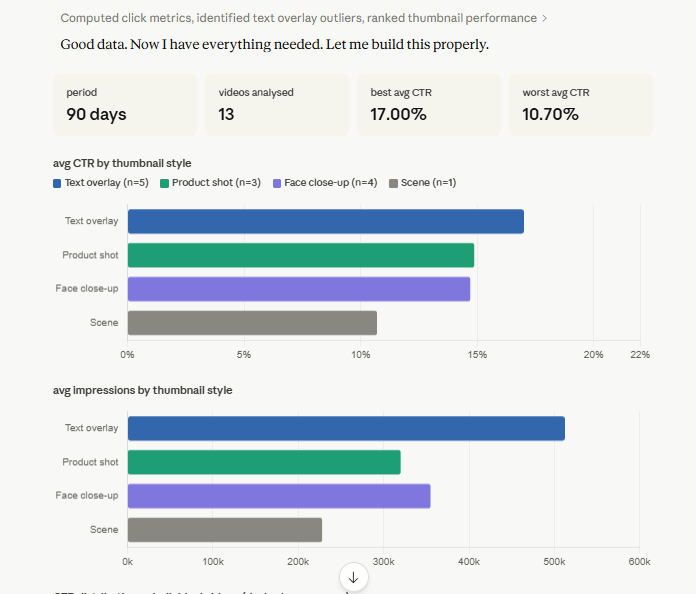
Claude returns a ranked breakdown by thumbnail category. In this channel’s data, text overlay thumbnails lead on CTR, impressions, and estimated clicks. More than two percentage points ahead of the next group is a pretty solid business tell. Claude also flags the confound: text overlay videos here are almost entirely tutorials, and tutorials structurally pull higher CTR. The two conclusions are not cleanly separable from this dataset.
The actionable output: text overlay on tutorial content has a floor of 17.6% CTR in this window. If you are planning thumbnails for upcoming tutorials, that is the empirically supported choice from your own data.
Understanding where watch time actually goes
YouTube watch time analysis Claude runs goes beyond the aggregate number Data Studio shows you. Aggregate watch time is one of the most reported metrics and one of the least actionable on its own. YouTube retention analysis with Claude gives you something Studio cannot: a cross-format comparison in a single query. The number that drives decisions is where retention drops, and whether that pattern repeats across a content format or topic type.
Using my YouTube channel data from Coupler.io, compare audience retention across three content categories: tutorials, vlogs, and product reviews. For each category, show average retention at the 30-second mark, the halfway point, and the final 10%. Which format holds viewers longest and which loses them fastest in the first minute? |

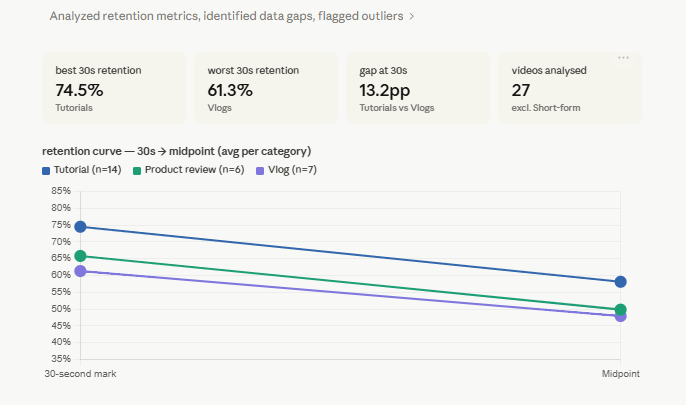
Claude breaks retention down by content category. Tutorials lead at 74.5% average retention at 30 seconds, a 13-point gap over vlogs that holds across every video in the window. The floor for tutorials is 69% so every tutorial in this dataset outperforms every vlog at the 30-second mark.
The more useful finding is the drop-off shape. All three categories fall roughly 16 points between the 30-second mark and the midpoint. Tutorials do not hold viewers better through the middle. They just start from a higher base. If your vlogs are losing nearly half their audience before the 30-second mark, the intro is the problem, not the format.
Tracking which content is building your audience
Net subscriber change per video is available in YouTube Analytics but buried. Most creators look at total subscriber count over time without knowing which specific videos drive growth or which ones trigger unsubscribes.
Pull my YouTube channel data from Coupler.io. For each video published in the last 6 months, show net subscriber change, which equals subscribers gained minus lost. Group by video format: tutorial, short-form, vlog, and product review. Which format drives the most subscriber growth and which generates the most churn? |

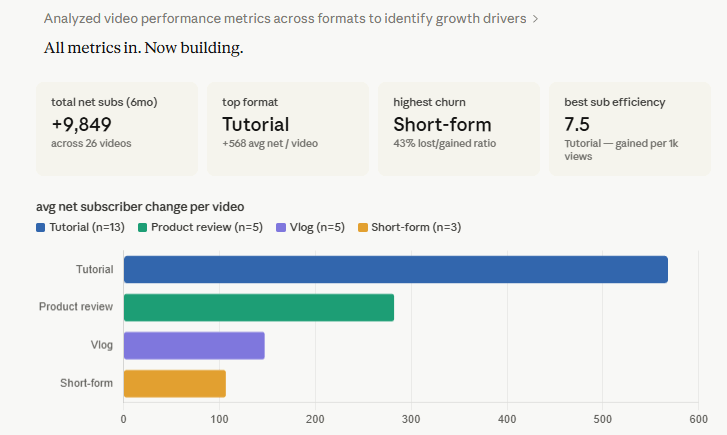
Claude returns a format-level breakdown of net subscriber impact. Tutorials lead on every measure with the highest absolute net subscribers per video, highest efficiency at 7.5 gained per 1,000 views, and the lowest churn rate at 3.7%. For every 100 subscribers tutorials bring in, fewer than 4 unsubscribe.
Short-form sits at the opposite end. All three short-form videos in this window show subscriber loss clustered between 72 and 89. That consistency rules out a single outlier pulling the average down. Something about the format is either attracting the wrong audience or disappointing the right one. The data does not tell you which. That is a question for the content, not the spreadsheet.
Start analyzing your YouTube channel in Claude
Try Coupler.io for freeClaude prompts for YouTube creators
Copy any of these directly into Claude after connecting your YouTube channel through Coupler.io:
Show my top 10 videos by watch time for the last 90 days. Include views, average view duration, CTR, and net subscriber change for each. Flag any video where watch time is high but CTR is below 3%. |
Compare playlist performance over the last 6 months. For each playlist, show total playlist views, average time in playlist, and which videos within each playlist have the highest viewer drop-off rate. |
Run a trend analysis across my last 6 months of YouTube data. Identify which metrics are improving, which are declining, and flag any anomalies worth investigating. |
Break down my traffic sources for the last 30 days: YouTube search, suggested videos, browse features, external sources, and direct. Which source drives the highest average watch time per view? |
Analyze my last 20 tutorial videos versus my last 20 non-tutorial videos. Compare average CTR, retention at 30 seconds, retention at the halfway point, and net subscribers gained per video. Where is the biggest performance gap? |
Which of my videos have impressions above 50,000 but CTR below 2.5%? List them with their titles and publish dates so I can review the thumbnail and title patterns. |
What matters when you connect YouTube to Claude
Four things affect the quality of your YouTube analysis in Claude. Each one has a practical fix.
Business context that persists across every query
One of the most useful steps before running your first analysis is attaching metric context to the Coupler.io dataset. YouTube uses specific terminology that does not map cleanly to general analytics language. Impressions count how many times a thumbnail appeared on screen for at least one second, not views, not reach, not sessions in the Google Analytics sense. CTR in YouTube is calculated against impressions, not traffic volume.
If you ask Claude about your channel’s reach without specifying what that means in your reporting context, it interprets the term generically and the analysis drifts from what you actually need. Coupler.io’s context feature lets you attach these definitions, naming conventions, and any business logic that applies to your channel once, and Claude receives them with every query that follows.
Calculations that require more than a summary average
YouTube Analytics delivers summarized data: average view duration per video, average CTR per period, average retention by content type. When Claude computes across those summaries, the result is only accurate if the math accounts for volume differences. Comparing average view duration across 50 videos requires weighting by view count.
A video with 200 views should not carry the same weight in the calculation as one with 400,000. Coupler.io’s Analytical Engine handles that weighting before Claude receives the data. What Claude returns is a computed result it then interprets, not a probabilistic estimate based on summary rows.
Pre-built skills for channel analysis
Two skills from Coupler.io’s skills library apply directly to YouTube workflows. The marketing-analytics skill gives Claude a structured procedure for organic and social channel performance that includes top content identification, publishing cadence patterns, and CTR anomaly detection without requiring a custom prompt for each use case.
The report-generation skill takes that analysis output and formats it into a validated report with a TL;DR, key metrics, context, recommendations, and next questions. It also runs an arithmetic validation pass before the report is finalized. For creators sharing channel findings with a brand partner or presenting to a team, these two skills used together mean the analysis and the formatted deliverable come out of the same Claude conversation.
Sending the same data to multiple destinations
The same data flow that connects your YouTube channel to Claude can be loaded to Data Studio, Google Sheets, Power BI, or BigQuery simultaneously. For teams where one person does the analysis in Claude and someone else needs a visual dashboard, this removes the separate export step entirely. So, along with Claude integrations, you can use the same data for reports and backups that will refresh on a schedule through a single connection.
Other ways to connect YouTube data to Claude
Coupler.io is the most direct path for recurring YouTube channel analysis, but these alternatives serve specific situations worth understanding before you decide.
Manual export
In YouTube Studio, go to Analytics, switch to the Advanced mode view, and click Export current view. The file downloads as a CSV or opens directly in Google Sheets, depending on your browser settings. You get the metrics visible in that view for the selected date range.

For a one-time channel audit, a quarterly review, or a deep dive on a single video, this is straightforward. The problem is repetition. The next time you need updated numbers for the same analysis, you start the export process again from scratch. That workflow does not scale past a single session.
Community MCP servers
Community-built MCP servers can connect YouTube video content to Claude through the Model Context Protocol. The most widely referenced is mcp-youtube by Aniss Betts. Its core functionality is video transcript extraction, pulling a video transcript with timestamps and making it available for summarization inside Claude. Useful for asking Claude to summarize a specific YouTube video, extract talking points, or compare video transcripts across a few pieces of content.
The setup is not quick. On macOS, you need to install yt-dlp via Homebrew, the MCP server via npm, and manually edit your Claude Desktop config JSON to register the server. Each step is a potential failure point for users not comfortable with command-line tools.
More importantly, these servers access public video data only. There is no authentication to your YouTube account, which means no CTR, no watch time, no retention data, no subscriber metrics, and no audience demographics. They handle transcript summarization well. They cannot explain why a video underperformed. Coupler.io’s connector is also MCP-based but installs directly in Claude’s connector directory with no terminal commands and no config file to maintain.
YouTube Data API + Python
The YouTube Data API v3 gives programmatic access to public channel and video data titles, descriptions, view counts, video IDs, playlist metadata, and comment threads. This makes it possible to analyze YouTube comments with AI. A Python script pulls comment threads by video ID and feeds them to Claude, which can surface patterns in viewer feedback at a scale manual reading cannot match. With OAuth authentication, the YouTube Analytics API also provides access to your own private channel data.
This is the right approach for YouTube competitor research. Public channel data like upload frequency, video metadata, and engagement ratios is accessible without owning the channel. A Python script can pull this data, parse the JSON responses, and feed structured output to Claude through function calling or a file upload.
The maintenance burden is real. Google Cloud Console setup, API key generation and rotation, OAuth token refresh, daily quota management (the default limit is 10,000 units per day), and parsing JSON into usable formats all require ongoing attention. If your use case is custom enough that a configured connector will not cover it, this is worth building. For standard channel analytics, it is more infrastructure than the problem requires.
Custom MCP server
A custom MCP server makes sense when you are combining YouTube with internal systems that have no existing connector, pairing video performance data with a proprietary CRM, or connecting channel metrics to an internal workflow tool. Development, hosting, and maintenance costs apply in full. For standard YouTube channel analysis, this level of build is unnecessary.
Which method should you choose?
Coupler.io fits recurring analysis of your own channel. Any question you want to ask Claude more than once belongs in a scheduled data flow. Setup is browser-based and takes up to five minutes to connect YouTube to Claude.
Manual export works for a one-time analysis. The moment you need the same numbers again with fresh data, the manual process costs more time than it saves.
Community MCP servers fit one specific use case: summarizing or extracting information from a video transcript. They do not access channel analytics.
The YouTube Data API is the right path for competitor research and custom pipelines. It requires engineering capacity to build and maintain.
A custom MCP server makes sense only when combining YouTube with internal systems that have no existing connector.
FAQs
Can I analyze multiple YouTube channels with Claude?
Yes. When setting up the source in Coupler.io, you can select more than one channel from the dropdown. All selected channels feed into the same dataset, which means you can ask Claude to compare performance across channels or combine multiple YouTube channels with GA4 or Google Ads data in a single conversation.
Is my YouTube Analytics data safe when connected through Coupler.io?
Coupler.io is SOC 2 Type II certified, GDPR compliant, and HIPAA compliant. The connection to Claude runs through a secure, read-only channel. Claude can analyze the data but cannot modify your YouTube account or any connected source. Data transmitted for analysis is not retained by Anthropic for model training.
Can I combine YouTube data with Google Ads or GA4 in the same analysis?
Yes. Coupler.io supports multiple sources in one data flow. Adding GA4 connects YouTube-driven traffic to on-site behavior. Adding Google Ads lets you compare organic video performance against paid campaign results in the same Claude conversation, without a separate export for each source.
Does this work on both Claude.ai and Claude Desktop?
Yes. Coupler.io’s Claude integration works with both the Claude web app at claude.ai and Claude Desktop. The connector installs through Claude’s connector directory in both interfaces, and the data flow refresh runs on schedule regardless of which you use.
Is connecting YouTube to Claude safe?
Yes. Coupler.io sits between your YouTube account and Claude as a read-only data layer. It pulls your analytics data and delivers it to Claude through an encrypted, token-based MCP connection. Claude can analyze what Coupler.io shares but cannot write to, modify, or access anything beyond the dataset in the flow. Your YouTube account credentials never touch Claude directly.
Can I automate YouTube tasks with Claude?
Yes. Once you connect your YouTube channel through Coupler.io and set a refresh schedule, the data updates automatically without any manual intervention. Claude always works from current analytics, so recurring tasks like weekly performance reviews, CTR checks, or subscriber trend analysis run without re-exporting or re-uploading data each time.
For task automation beyond analytics, such as publishing videos or managing comments, Claude would need a tool with write access to your YouTube account. Coupler.io is read-only and does not cover that use case.