
Most of the time trackers provide exportable reports. In Clockify, you can download your data as a PDF, CSV, or XLSX file, and use it for customized reporting and calculations, such as resource planning, payroll, invoicing, and so on. Entrepreneurs and small-to-medium businesses mostly use spreadsheets for these purposes. And Google Sheets is the best you can have because it’s free, cloud-based, and provides collaboration capabilities. Today we’ll explain how you can connect Clockify to Google Sheets to import summary, weekly, and detailed reports automatically using a specialized add-on: Coupler.io.
How to integrate Clockify with Google Sheets without coding
Install Coupler.io
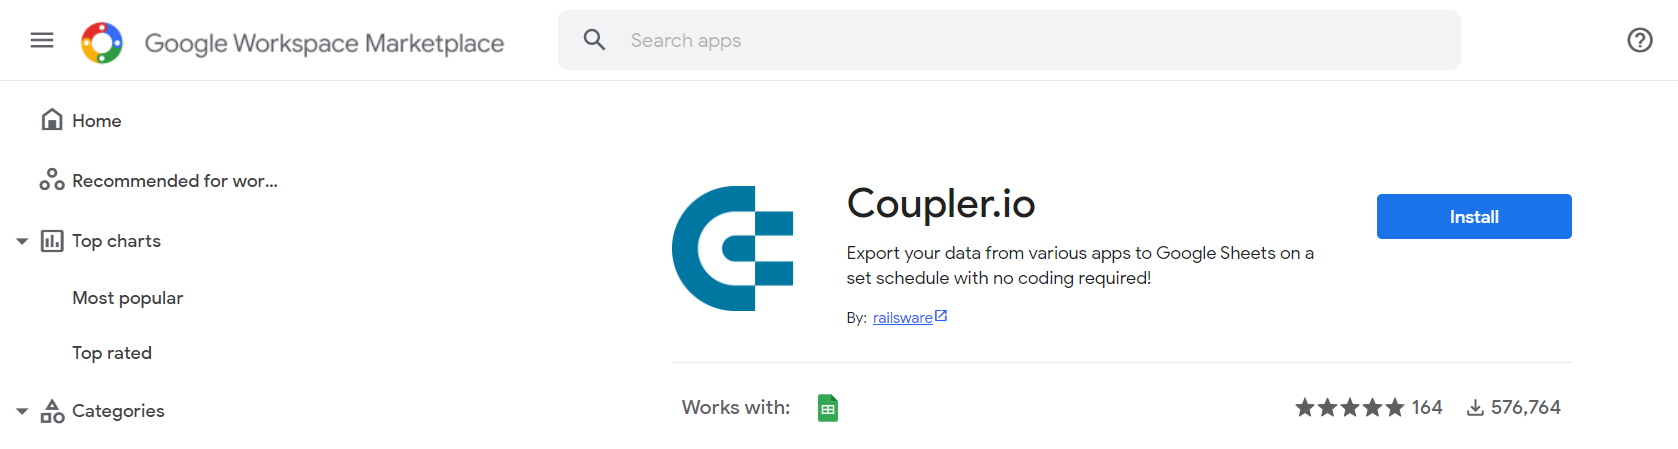
Coupler.io is a Google Sheets add-on that lets you import data from different sources, including Clockify, Pipedrive, and many others. Install it via this link or find it on the Google Workspace Marketplace:
Set up a Clockify importer
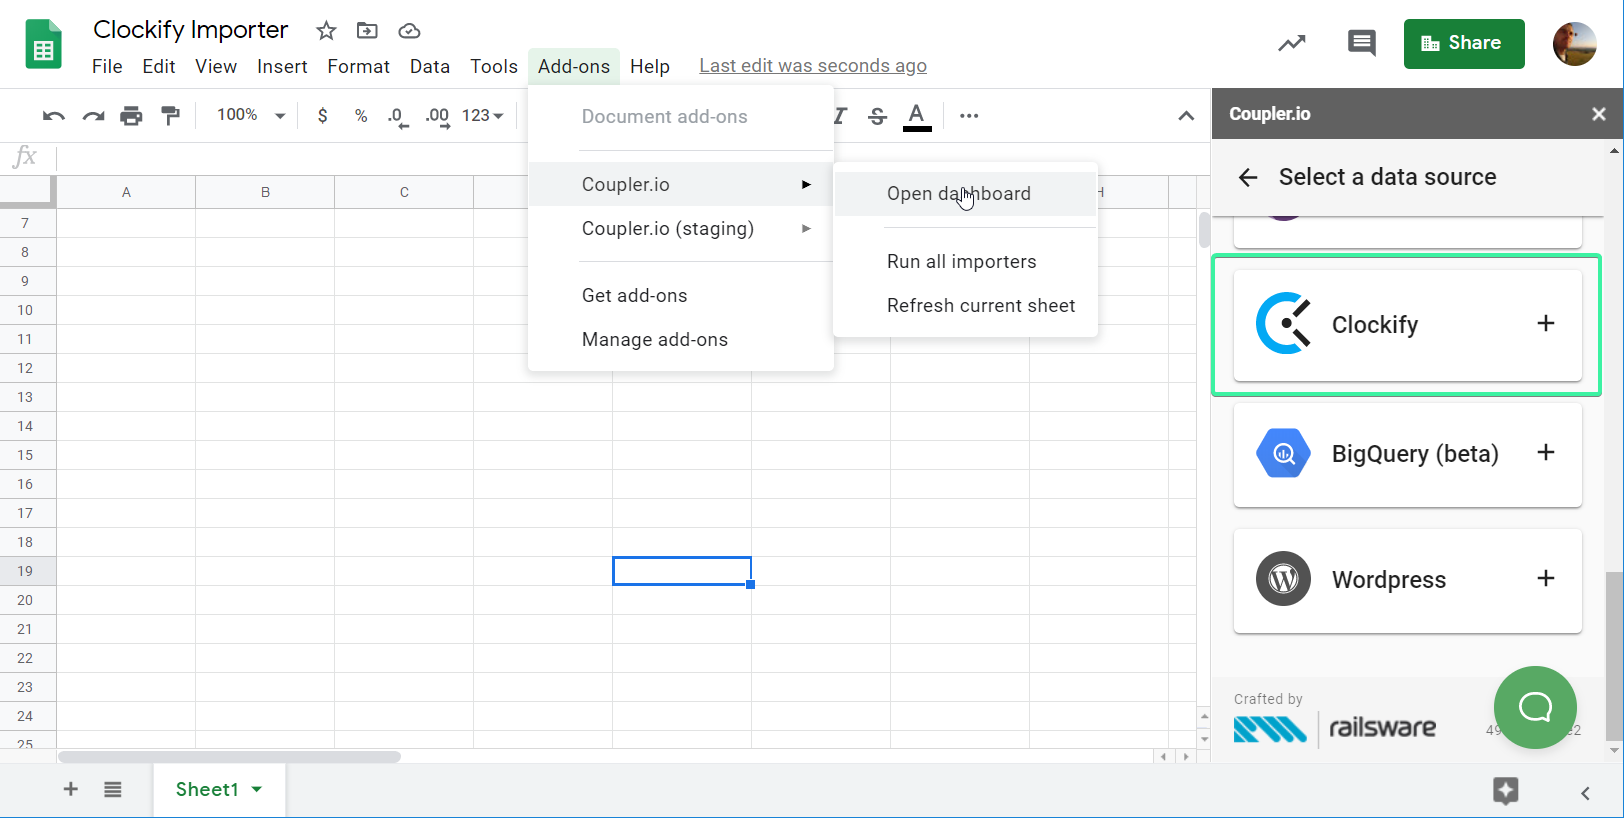
An importer is an integration that connects Google Sheets to a specific app or data source. We need to set up a Clockify importer. Open Coupler.io in the Add-ons tab of a spreadsheet, click on the +Add Importer button and choose Clockify.
Make the following steps to complete the setup:
1. Set up your Data Source
- Select a report type to import: Summary, Weekly, or Detailed.
- Enter the ID of your active workspace.
- Enter your personal API key.
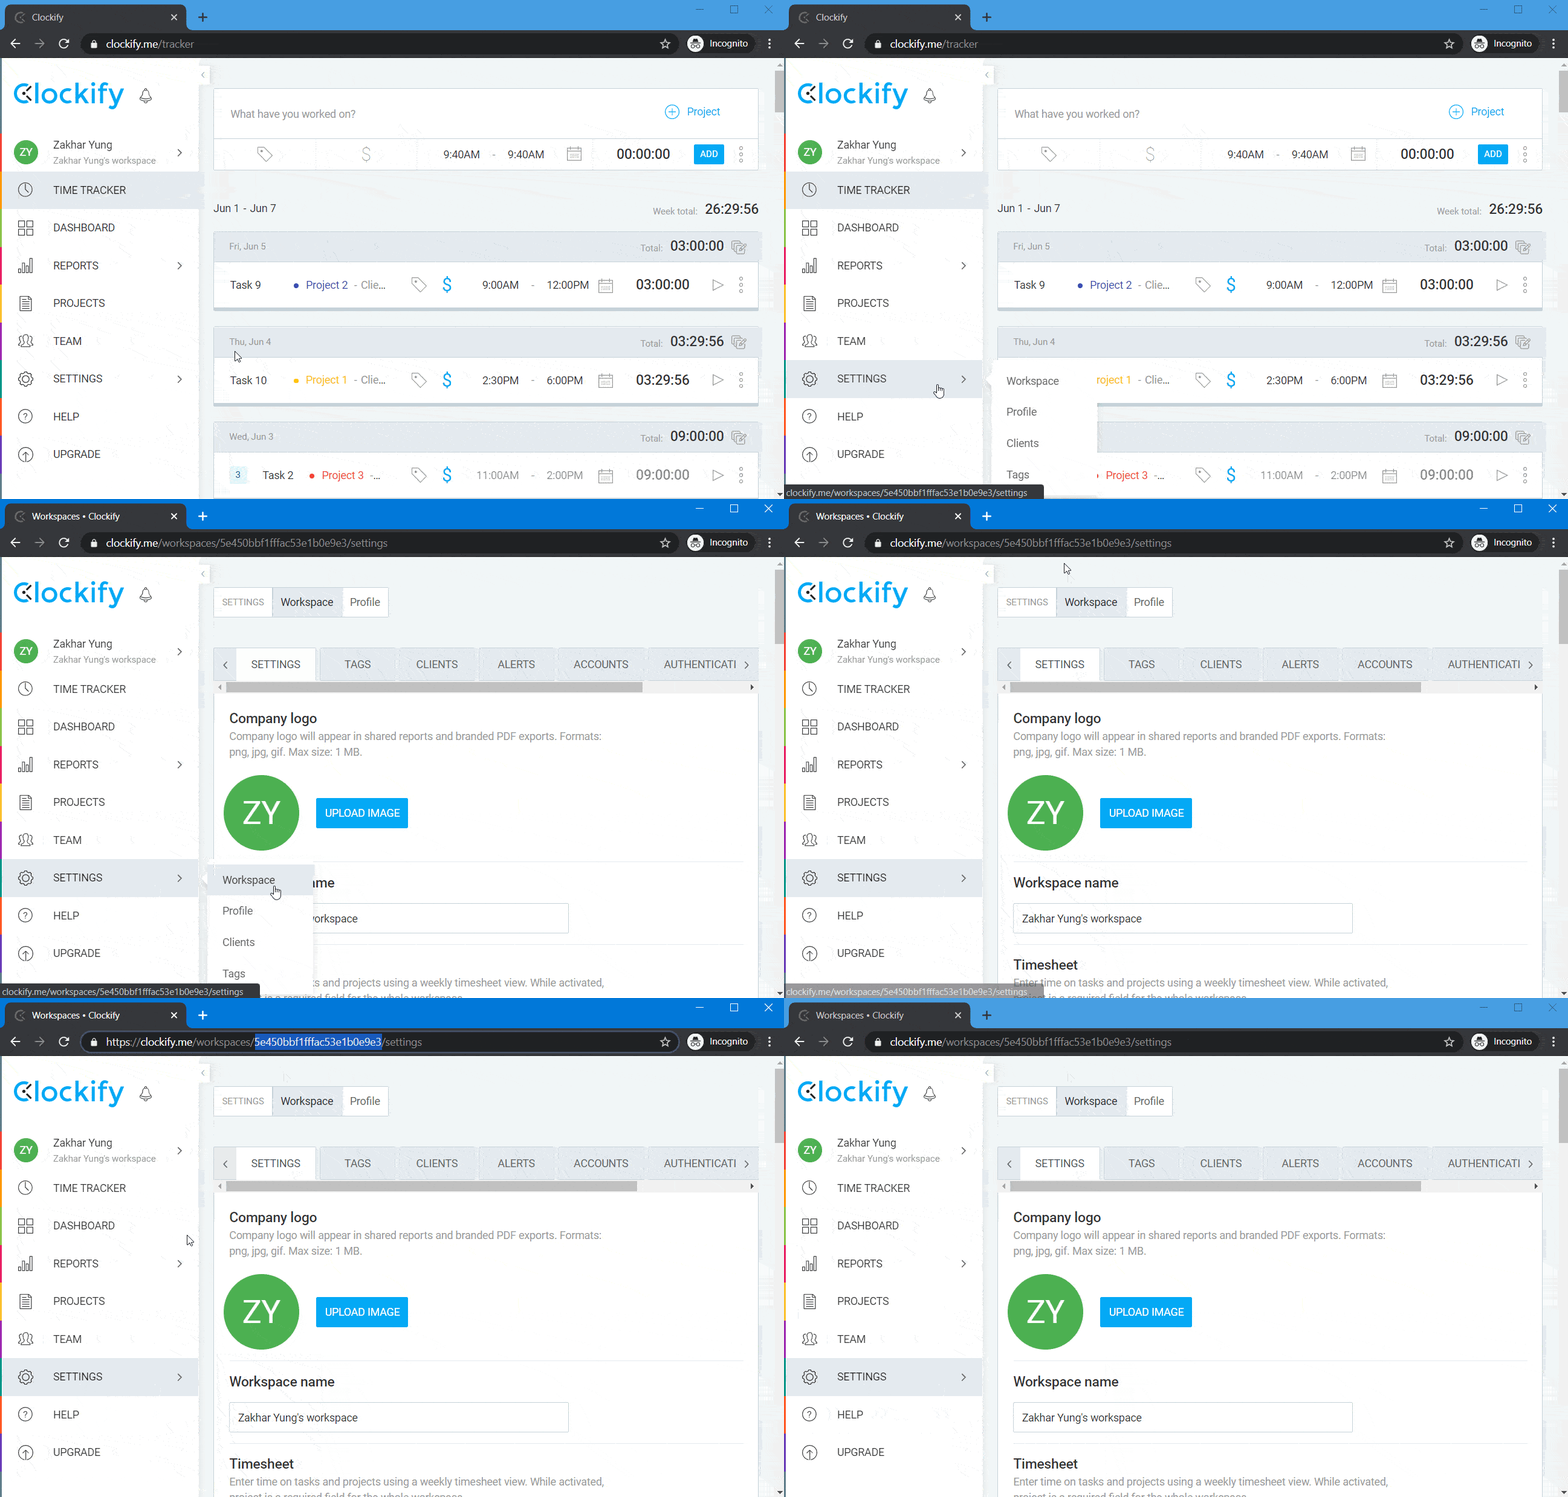
Where to get your Workspace ID
Go to Clockify tracker => Settings => Workspace. You’ll find the ID of your active workspace in the page URL. For example: https://clockify.me/workspaces/5e450bcf1fffab54e1b0e8e5/settings

How to get an API key
Go to Clockify tracker => Settings => Profile. Find the API section in the bottom of the page and click Generate.

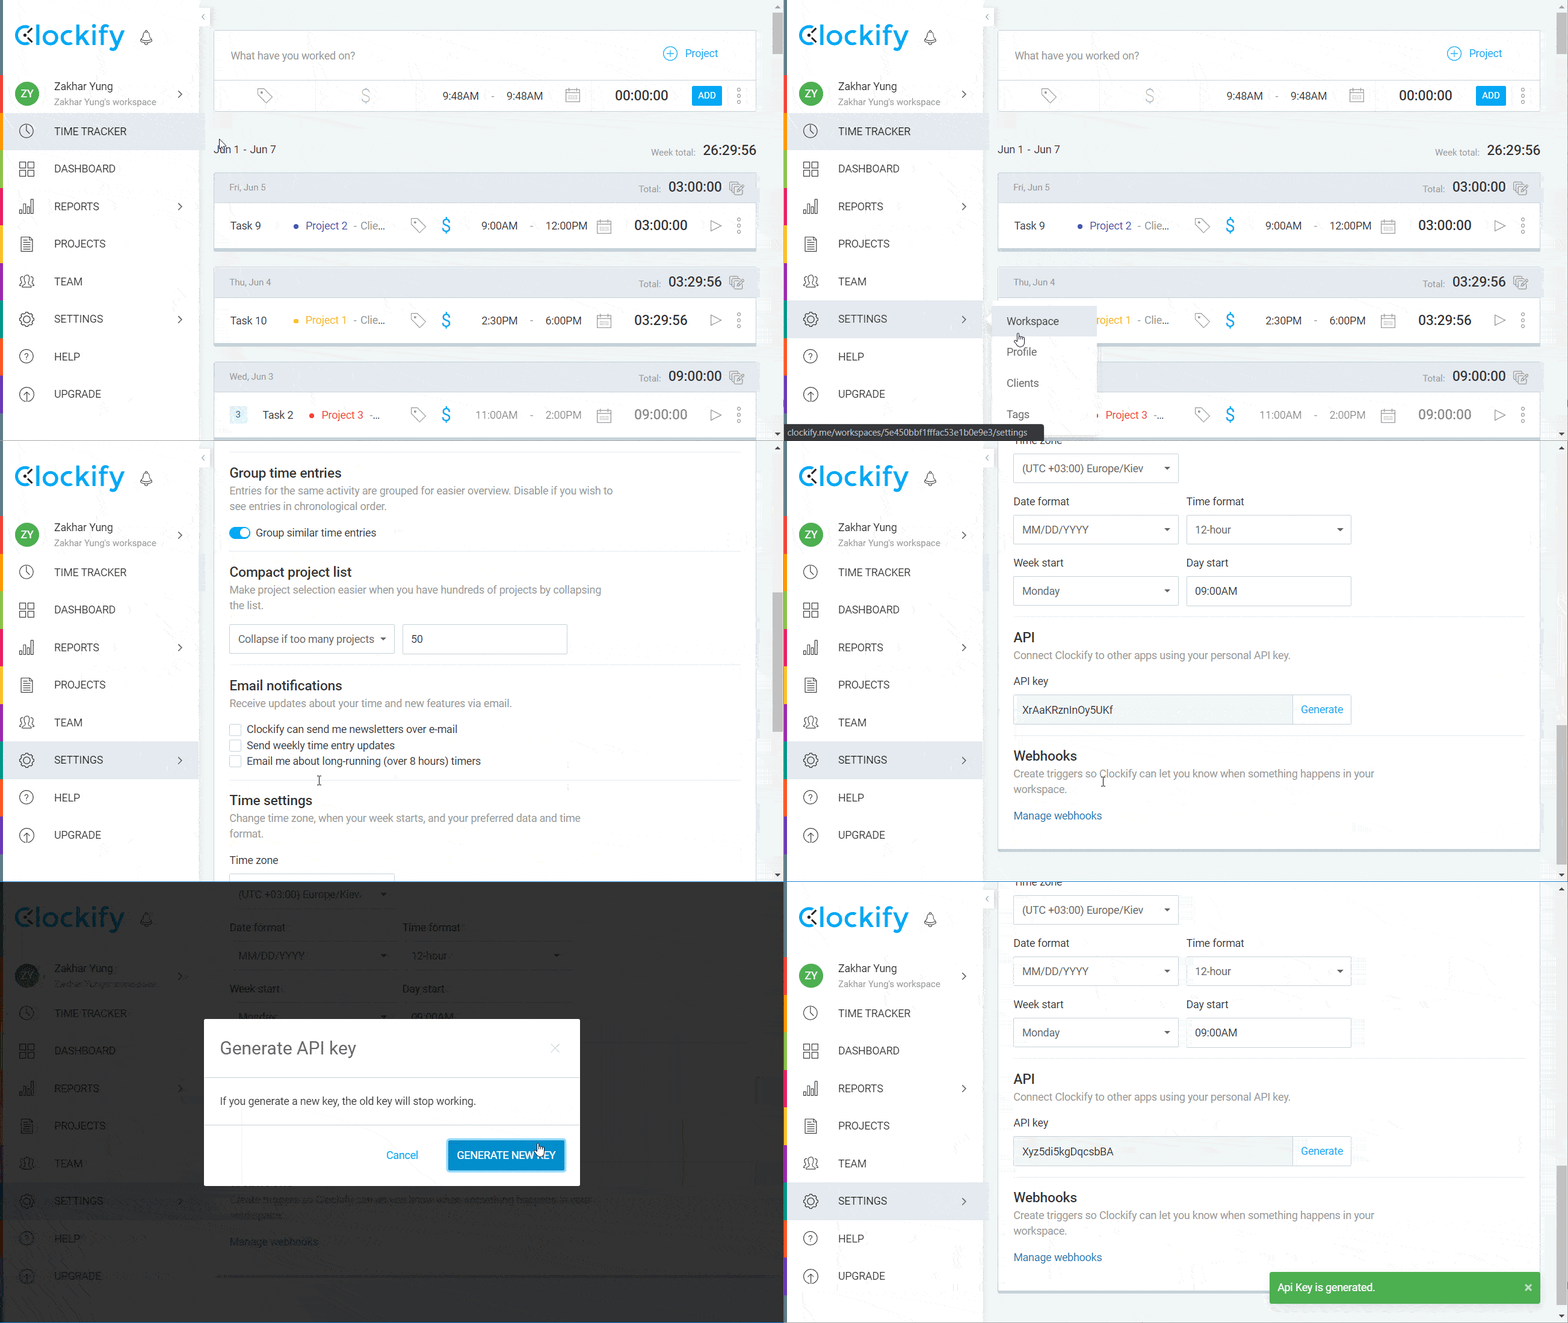
Additionally, you can specify the Start and End Dates for your report. For this, click Show Advanced and enter the date in format yyyy-mm-dd in the respective fields. For example:
Start Date: 2020-01-01
End Date: 2020-12-31
2. Set up your Data Destination
Add the name of the sheet, which will be receiving data.
Additionally, you can specify which cell to use to import your data range. For this, click Show advanced and enter the address of the first cell to the Cell address field. The default value is A1.
3. Configure importer’s schedule
Enable the automatic data refresh and customize the schedule.
Additionally, you can pick the import mode (replace or append), as well as add a column specifying the date of the last data refresh. For this, click Show advanced and fill out the respective fields.
That’s it. Click Save & Run to save the integration and run the initial import right away.

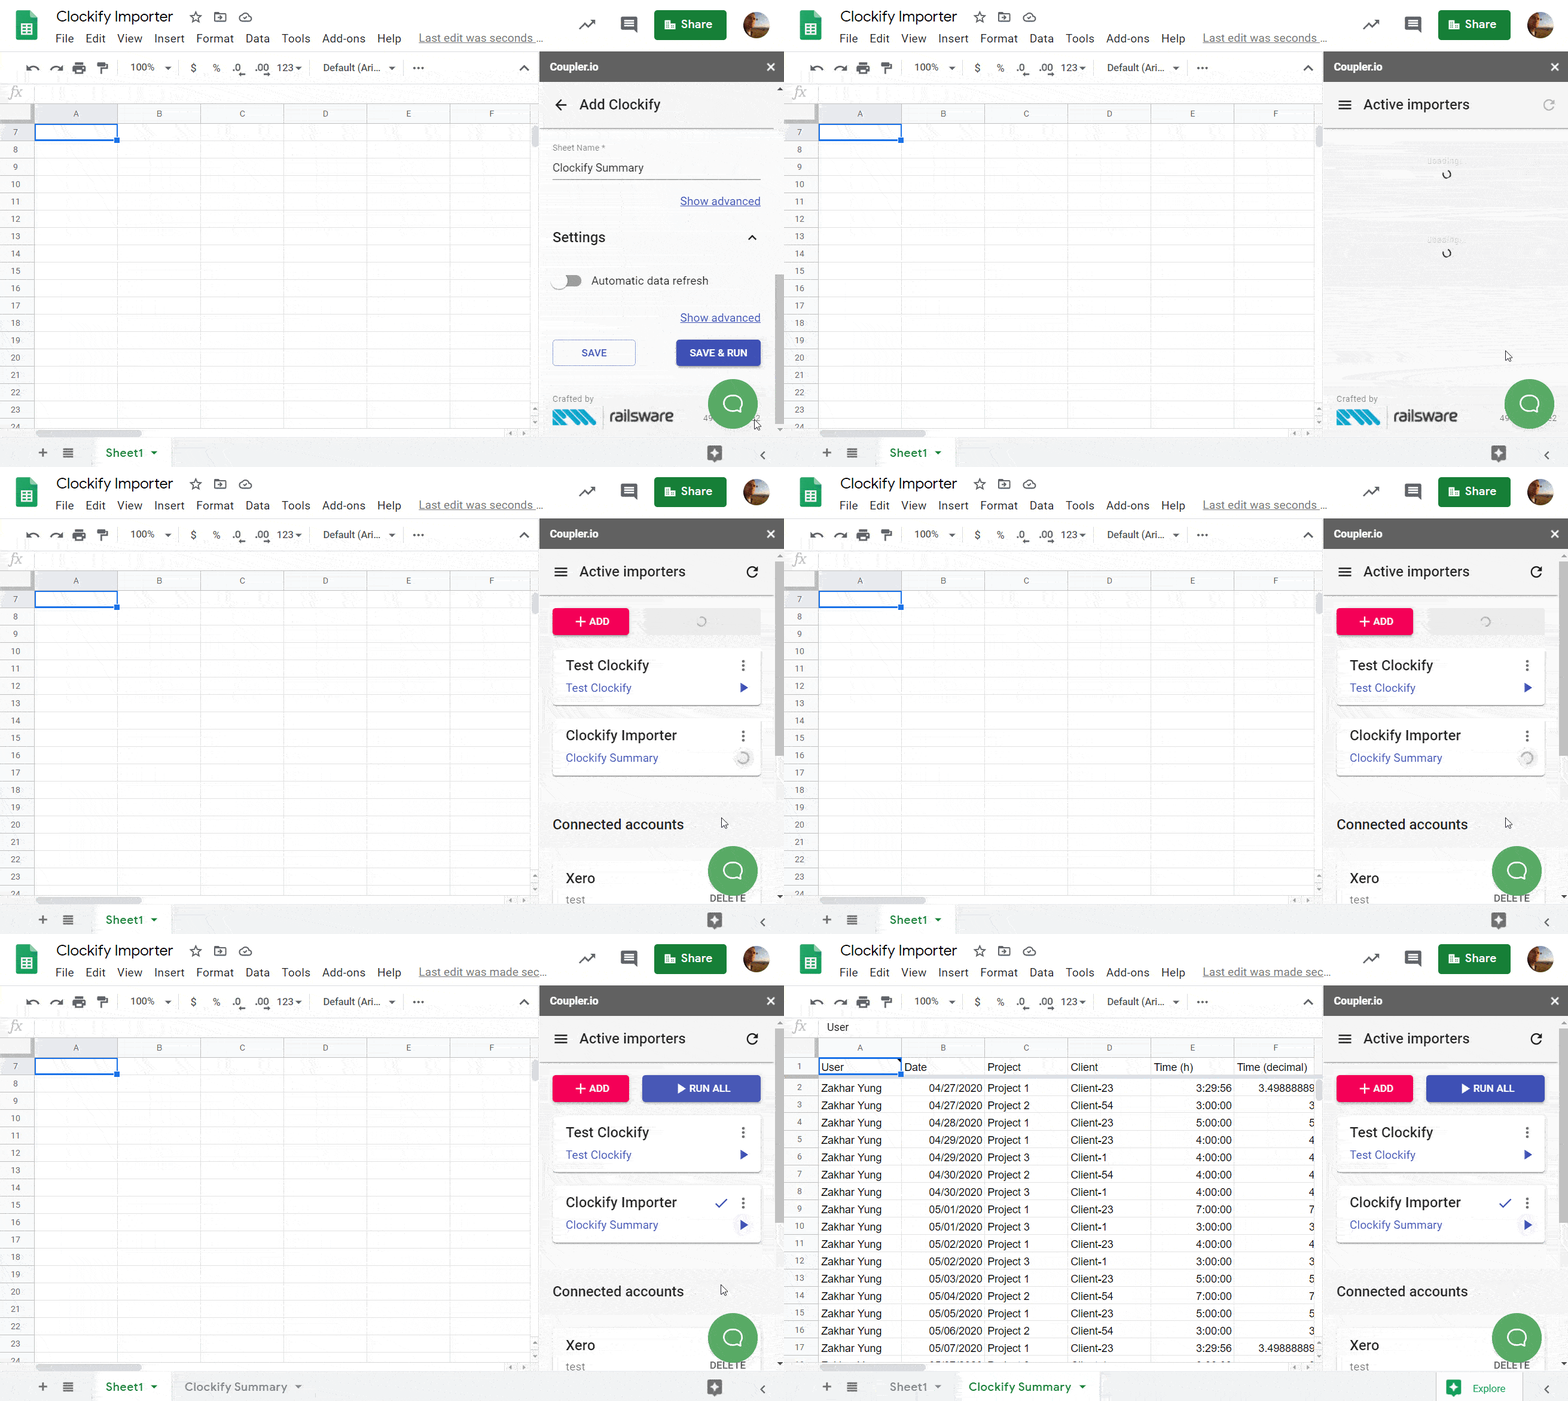
If you need to connect another data source to Google Sheets, tell us about this by filling out this form.
It was pretty simple since our team has developed a dedicated Clockify importer based on users’ requests. Previously, users had to configure the integration using the CSV importer. If interested, here is how it looked.
How to integrate Clockify with Google Sheets using the CSV importer
Set up a CSV importer
Open Coupler.io in the Add-ons tab of a spreadsheet, click on the +Add Importer button and choose CSV.
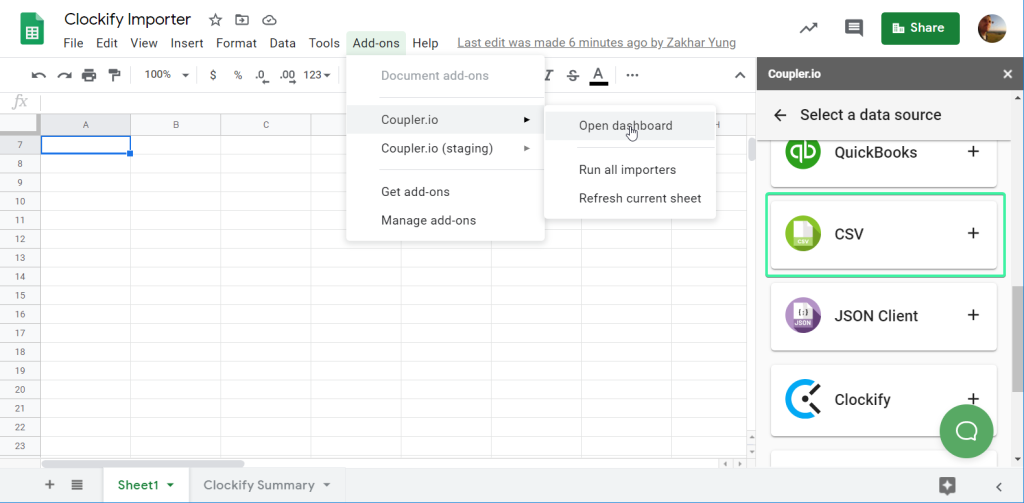
In our blog post, “Import CSV into Google Sheets”, we explained how to set up the CSV importer for regular data imports from online published CSVs. To pull data from Clockify, you’ll need to do the following:
1. Set up your Data Source
1.1. Fill out the CSV URL field
Insert the endpoint depending on the type of report you need. For more on this, refer to the Clockify API documentation.
CSV URL for Clockify SUMMARY Report
https://reports.api.clockify.me/v1/workspaces/{your-workspace-id}/reports/summaryCSV URL for Clockify WEEKLY Report
https://reports.api.clockify.me/v1/workspaces/{your-workspace-id}/reports/weeklyCSV URL for Clockify DETAILED Report
https://reports.api.clockify.me/v1/workspaces/{your-workspace-id}/reports/detailedRead Where to get {your-workspace-id} if needed.
Click Show advanced and fill out the following fields as well:
1.2. Pick an HTTP method
Select the POST request method.
1.3. Fill out the “Request headers” field
Insert two request headers:
content-type: application/json
x-api-key: {replace-with-your-API-key}
Read How to get an API key if needed.
1.4. Fill out the “Request body” field
Use one of the following strings depending on the type of report you need.
Request body for Clockify Summary Report
dateRangeStart: '2020-01-01T00:00:00.000Z'
dateRangeEnd: '2020-12-31T23:59:59.999Z'
sortOrder: ASCENDING
description: ''
rounding: false
withoutDescription: false
userLocale: en_US
customFields:
summaryFilter:
  sortColumn: GROUP
  groups:
  - PROJECT
  - TIMEENTRY
exportType: CSV
specify the start date
specify the end date
(ASCENDING or DESCENDING)


(PROJECT, CLIENT, TASK, TAG, DATE, USER, USER_GROUP, TIMEENTRY)
Request body for Clockify Weekly Report
Note: The date range specified in the request body (dateRangeStart and dateRangeEnd) should not be greater than one week (7 days). Otherwise, the CSV importer returns an error.
dateRangeStart: '2020-01-01T00:00:00.000Z'
dateRangeEnd: '2020-01-07T23:59:59.999Z'
sortOrder: ASCENDING
description: ''
rounding: false
withoutDescription: false
userLocale: en_US
customFields:
weeklyFilter:
  group: PROJECT
  subgroup: TIME
exportType: CSV
specify when week starts
specify when week ends
(ASCENDING or DESCENDING)


(PROJECT, CLIENT, TASK, TAG, DATE, USER, USER_GROUP, TIMEENTRY)
Request body for Clockify Detailed Report
dateRangeStart: '2020-01-01T00:00:00.000Z'
dateRangeEnd: '2020-12-31T23:59:59.000Z'
users: null
userGroups: null
clients: null
projects: null
tasks: null
tags: null
description: ''
withoutDescription: false
detailedFilter:
  sortColumn: DATE
  page: 1
  pageSize: 50
exportType: CSV
rounding: false
customFields: []
specify the start date
specify the end date
If you need to filter billable/non-billable hours, add billable: true (for billable), or billable: false (for non-billable) in the request body.
The steps 3 (Set up Data Destination) and 4 (Configure importer’s settings) are the same as with the Clockify importer setup.
Use case: a daily updated dashboard of time-tracked projects
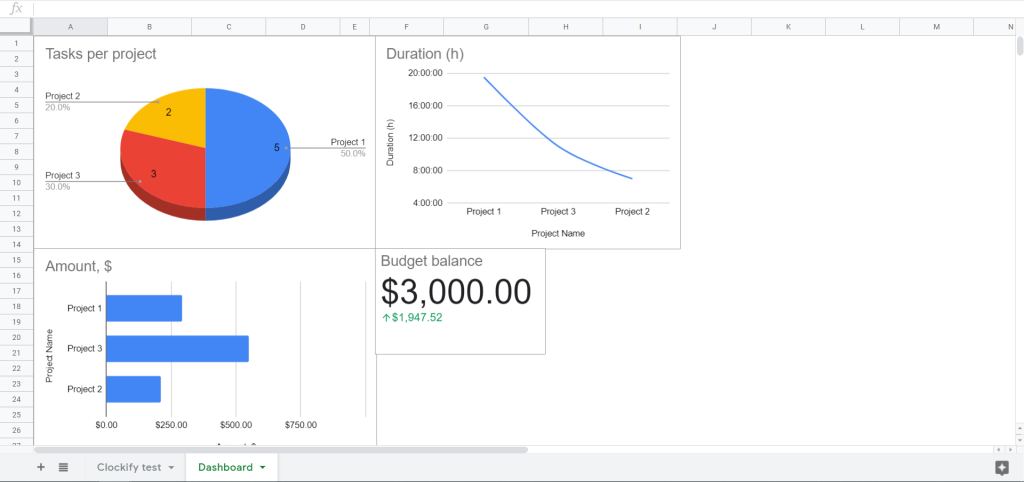
Let’s check out a simple example of how you can visualize your data imported to Google Sheets from Clockify. We’ll build a dashboard with a few charts that will regularly update. This is possible thanks to the automatic data refresh feature provided by Coupler.io.
Once the data is in the spreadsheet, we’ll use specific functions to extract the required data and apply charts to it. The data will update daily, so the dashboard will look like this:

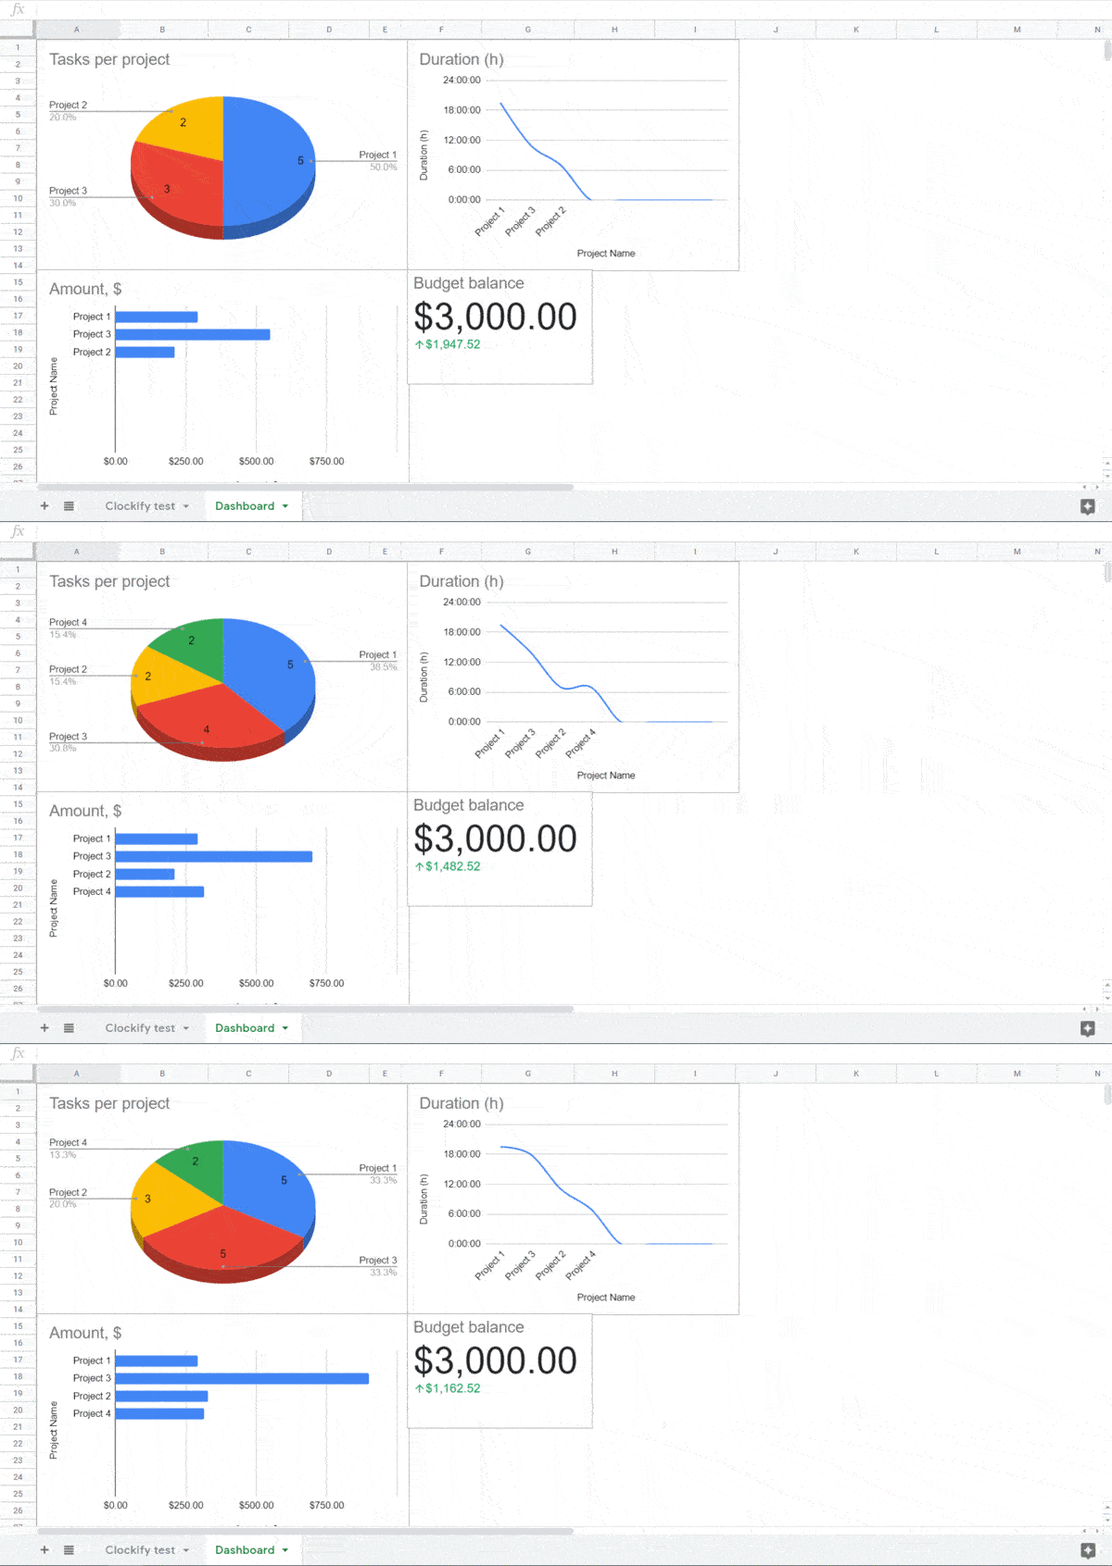
For your convenience, you can download the template with the dashboard to inspect the details.
To wrap up: manual or automatic export?
Once the importer is set up, your data will go to the Google Sheets automatically (if the automatic data refresh option has been activated), or when you click on the Run importer button. This is a time-efficient solution that will definitely increase your productivity. We encourage you to check out other Google Sheets integrations. Also, please feel free to share your feedback in the comments. Good luck!