What you need to analyze API data with Claude
Your most useful business data is behind an API. For example, subscription metrics in a SaaS API, orders in an internal endpoint, product usage in a REST API. Claude can analyze all of it, but there’s a catch: Claude can’t call your API endpoint on its own. And even when you export the data, raw JSON responses are difficult to interpret.
To close this gap, you’ll learn the simplest and most reliable way to feed API data to Claude using Coupler.io. It is a data integration & AI analytics platform that collects data from your API, organizes it into a structured dataset, and delivers it to Claude, with automatic updates on a schedule.
To follow along, you need:
- Access to your API endpoint
- Credentials for it (an API key or OAuth)
- A Coupler.io account
- Claude (Claude.ai or Claude Desktop)
With these in place, it takes only two steps to load API data into Claude.
How to load API data into Claude with Coupler.io
With Coupler.io, you don’t write ETL scripts or copy JSON manually. You set up the connection once, and it keeps the dataset fresh from then on.
The platform supports over 400 AI integrations with ready-made connectors, so your app may already be covered. If not, you can connect JSON to Claude using the custom connector that handles any endpoint you can reach with a URL and credentials. Either way, you can blend several sources into one dataset and send it wherever the analysis happens: AI tools, spreadsheet apps, BI tools, or data warehouses.
Here’s how to import API data into Claude in two steps.
Step 1: Set up the API source + prepare the data set
Create a new dataflow in Coupler.io and select JSON as the source. Or click Proceed in the form below to get started right away for free with no credit card required

Then point it at your API:
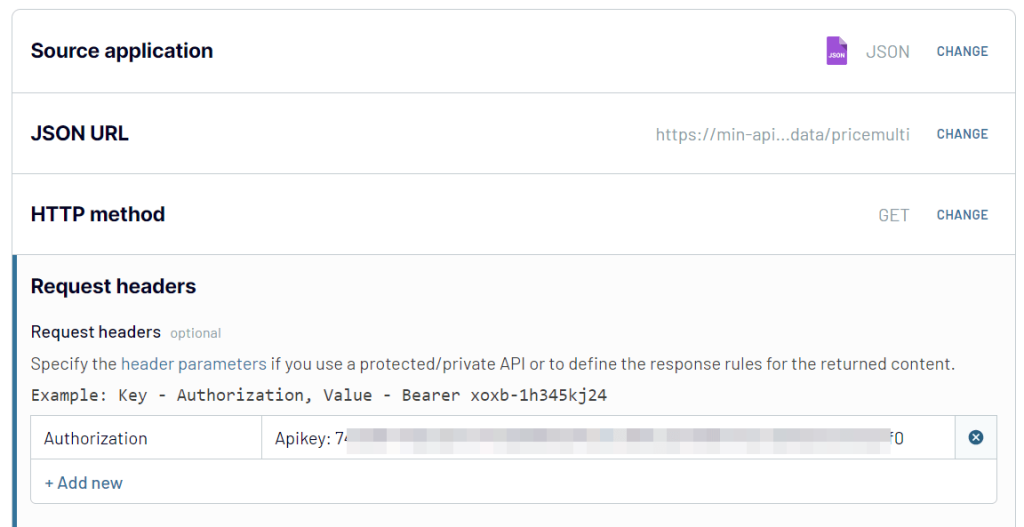
- JSON URL: paste your API endpoint
- HTTP method: GET works for most data-fetching endpoints
- Request headers: apply HTTP headers for your request. For example, the Authorization header lets you specify the credentials required to make the request, such as your API key

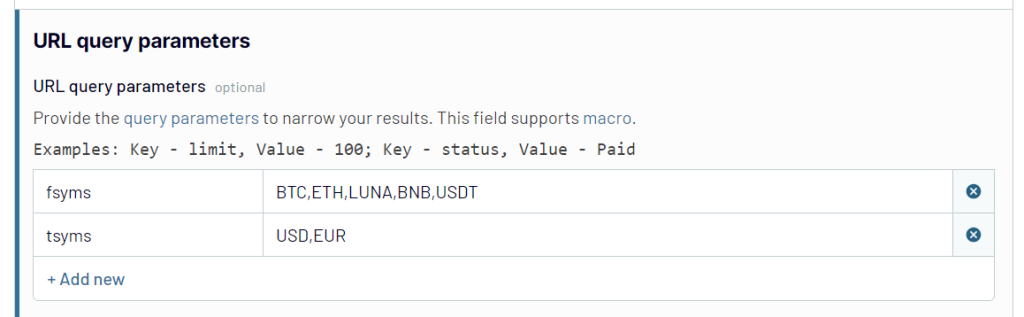
- URL query parameters: add query parameters to filter the requested JSON, so you only pull the records you need instead of the full response

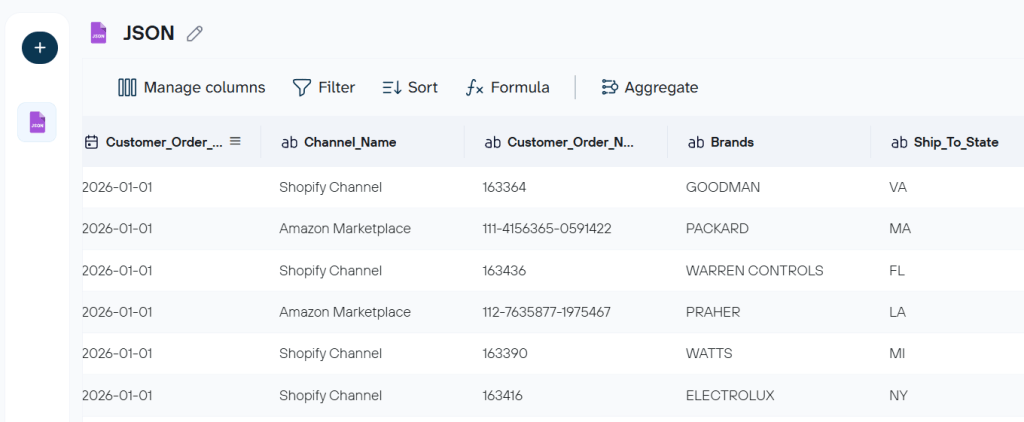
Coupler.io organizes the nested JSON into rows and columns.
Before moving on, prepare the dataset.
- Rename columns: An API returns names like cust_seg_4 or fsyms. Rename them to what they actually mean, and add column descriptions for better context
- Filter out what you don’t need: APIs return everything by default: test records, technical IDs, fields irrelevant to your question. Removing them keeps the dataset focused and light
- Aggregate where raw records are too granular: If the API returns individual transactions but you analyze monthly totals, aggregate them here rather than asking Claude to do it in every session
- Add calculated columns: If you need a metric the API doesn’t return directly, like a margin or a rate can be derived from two fields
- Blend in other sources: If the analysis spans systems, append similar datasets or join related ones, so Claude works with one unified table

Step 2: Connect to Claude
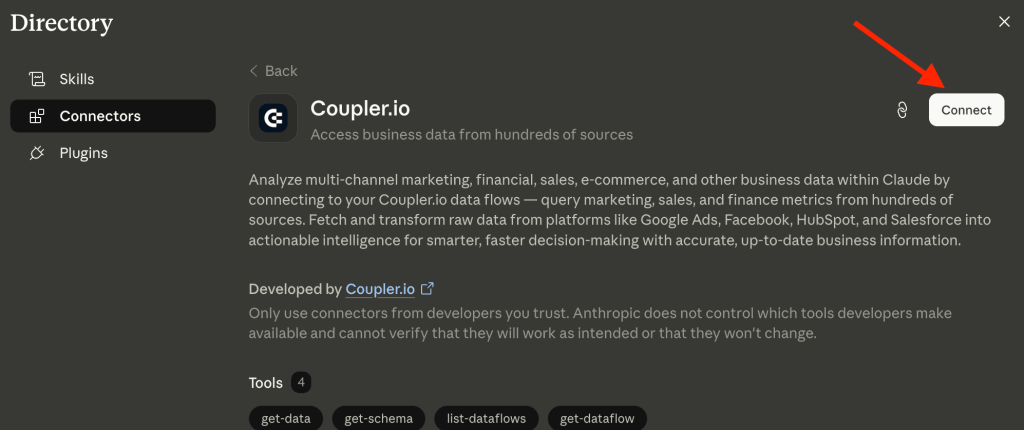
Choose Claude as the destination for your dataflow and click Get connector.
Coupler.io was one of the first extensions to connect your data to Claude and is one of the best Claude connectors so far.

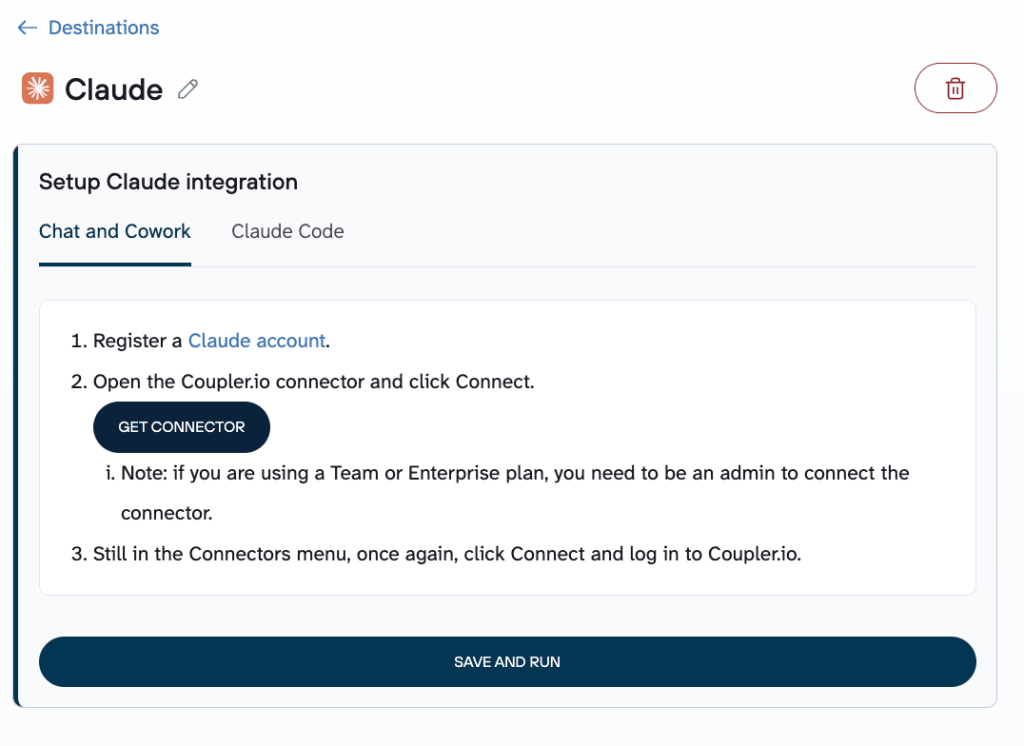
Coupler.io opens its connector page right inside the Claude app, where you authorize it to connect data to Claude.

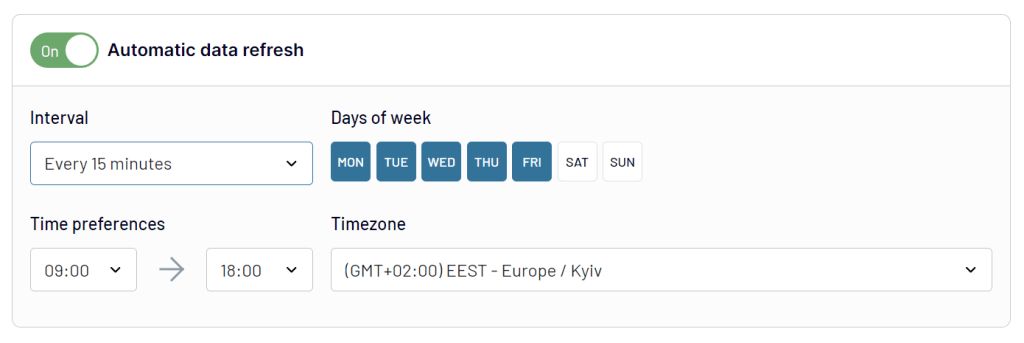
Before running the dataflow, decide how often the data should update: hourly, daily, or weekly. Match this to your source. If the API updates a few times a day, an hourly refresh works.
Click Save and Run to launch the first import.

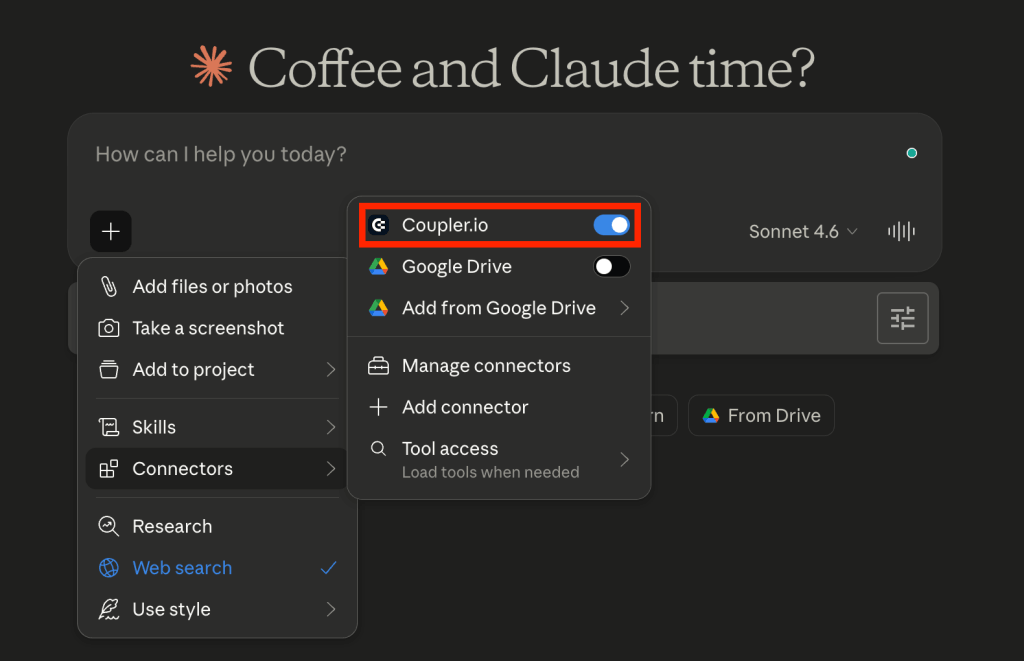
Once the first run completes, open Claude and switch on Coupler.io in the list of Claude data connectors. Claude now has access to the Coupler.io MCP server, with your JSON data available as a structured dataset in the conversation.

Say you’ve connected usage events from your product’s API: “Which features had the highest active usage last week, and which ones dropped compared to the week before?”

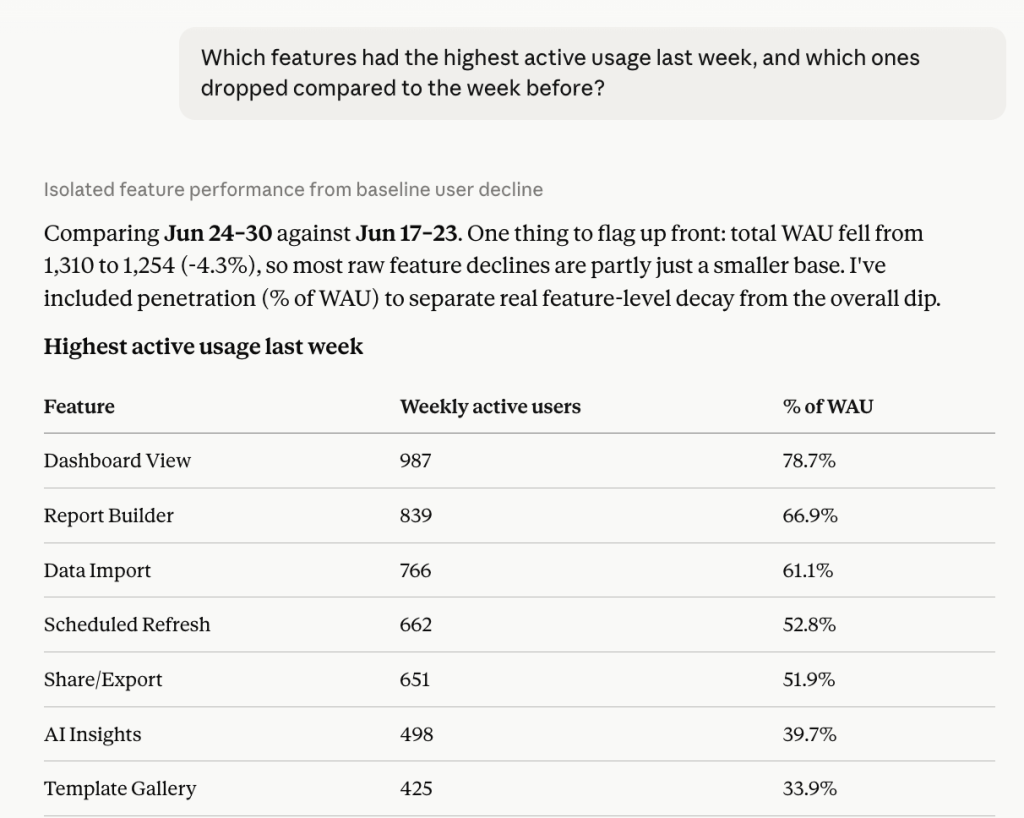
In this analysis, Claude ranks the features, but it also catches that overall usage dipped. It separates genuine declines from noise and suggests where to investigate next.


Get your API data into Claude with Coupler.io
start free, no credit cardWhat matters to connect API to Claude AI for data analysis
In the previous section, you asked Claude which features dropped last week. Ask the same question over a raw JSON export, and you get a very different answer: a list of numbers, mislabeled fields, and no sense of what matters.
The difference between that and the response above comes down to three things.
Gives business context, not raw JSON
An API returns keys like mrr_delta or cust_seg_4. Claude can read them, but it has to guess what they mean. With Coupler.io, your dataset arrives with readable column names and descriptions, so Claude knows it’s looking at monthly recurring revenue change for a specific customer segment. The contrast shows up immediately with answers grounded in your business data instead of generic ones.
Backs every number with the Analytical Engine
Language models predict text. They don’t compute, so a total or growth rate can be confidently wrong. You won’t realize this until you double-check manually. Coupler.io closes this gap with its Analytical Engine, a calculation layer between your data and Claude. It runs the math, verifies the results, and passes only validated numbers forward. And Claude explains what the numbers mean for your business.
Gets access to multiple destinations with one pipeline
The same dataflow for your Claude integrations can also send data to Google Sheets, Looker Studio, or your BI tool. You analyze in Claude and report elsewhere without setting anything up twice. When the source API changes, you fix it in one place, i.e Coupler.io.
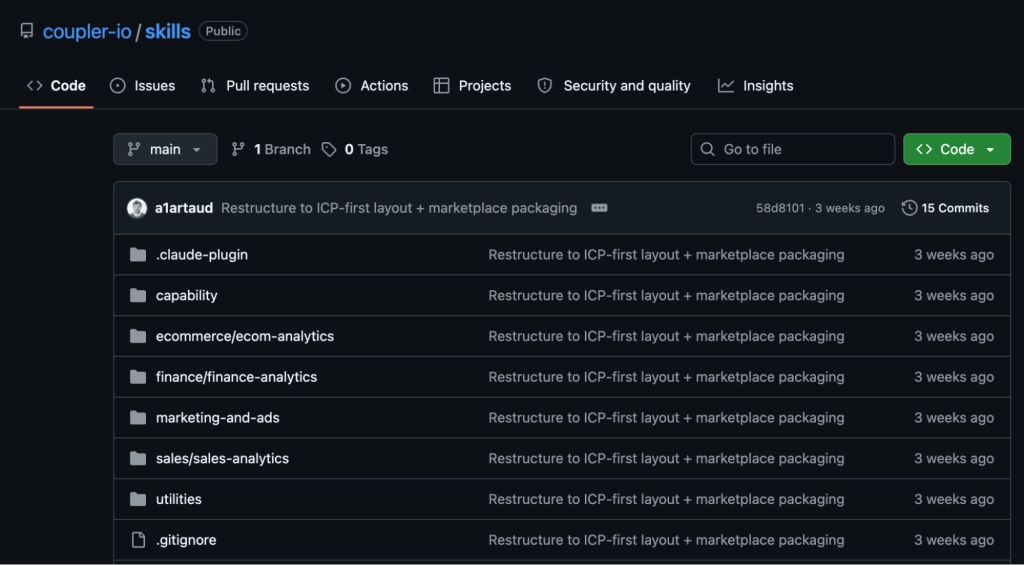
Comes with built-in AI agent skills
Coupler.io ships with a library of AI agent skills. These are instruction sets that tell Claude what data to pull and what analysis to run. They run as Claude Skills, natively inside Claude AI. Data analysis skills cover marketing, sales, finance, and ecommerce. For example, ask for a financial health check, and the finance skill breaks down margins and MRR with SQL-style queries. The capability skills handle the workflow around them. One documents your dataset so analyses start from accurate context, another turns output into a validated and decision-ready report.
To use one, open the skills library, pick the skill that fits, and add it to your workflow, then prompt Claude in plain language as before. The connection gives Claude access to your data.

How to analyze the data once it’s in Claude
Skills give you a guided path for common Claude data analysis. But because the data is connected, you’re not limited to them. You can ask Claude anything about your dataset in plain language, which matters most for the exploratory questions.
Here are six ways to analyze data in Claude, with example prompts you can adapt to your own.
Trend analysis
Let’s say you’ve connected subscription data from your billing platform’s API (Stripe, Chargebee, or similar). The data consists of monthly recurring revenue, plan changes, and cancellations. The question you want answered isn’t just how revenue moved, but why: is growth coming from new customers, existing ones upgrading, or is churn quietly eating into it?
“Show how MRR changed over the last six months. Break down the change into new business, expansion, and churn. What's the biggest driver?”

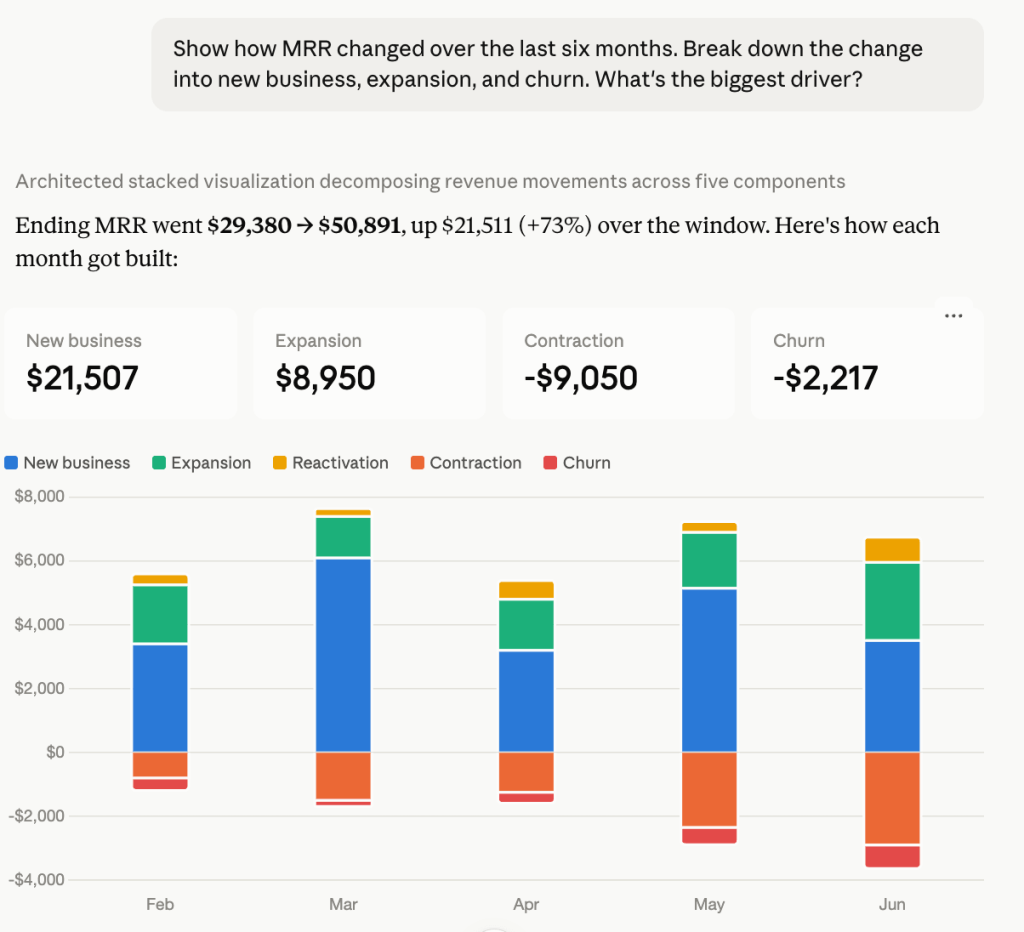
Claude pulls the relevant columns, calculates the month-over-month movement, breaks down the drivers behind the revenue change, and explains it all in plain language.
Anomaly detection
Pull event data from your payments API like Stripe or Razorpay with transactions, refunds, and failed charges in one dataset. Problems here tend to surface late, like refund spikes, runs of failed payments, or a broken integration that quietly stops sending records. You want them flagged before they appear in the monthly report.
Ask Claude to find what you’d otherwise catch too late.
“Scan the dataset for anomalies: sudden spikes or drops, missing values, or numbers that don't fit the pattern of the surrounding weeks. Flag anything worth investigating.”

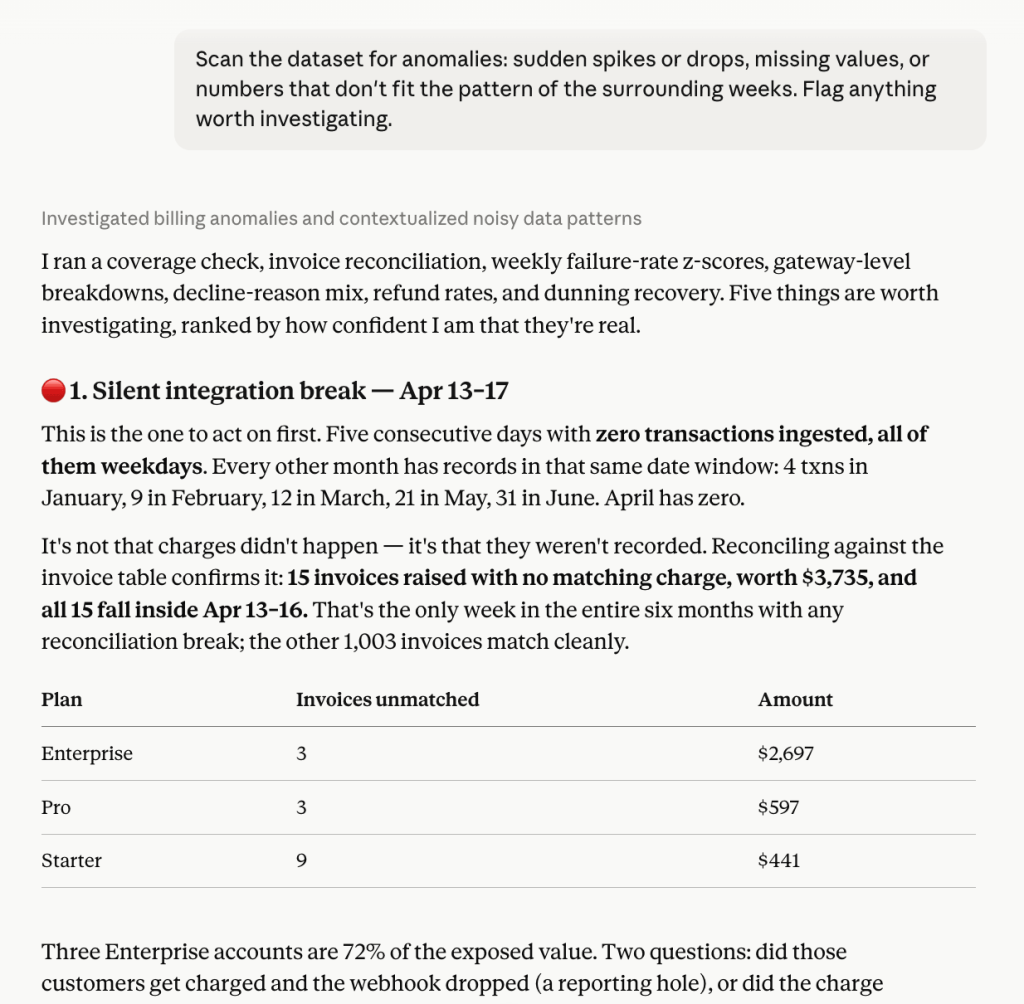
This doubles as a data quality check. If an API started returning malformed records three weeks ago, this is where you find out. In this example, Claude caught a five-day gap where no transactions were recorded. It cross-checks the invoice table to prove the charges went missing, and separates that real break from the mid-month low sales that are normal for the business.
Segment and cohort breakdowns
A CRM or subscription API like HubSpot gives you customers, plans, signup dates, and status. And a top-line churn number tells you something’s wrong but not where. To know that you need a rate by who’s leaving and when they joined.
“Compare churn rate by plan tier and signup cohort. Which segment is driving the overall churn increase?”

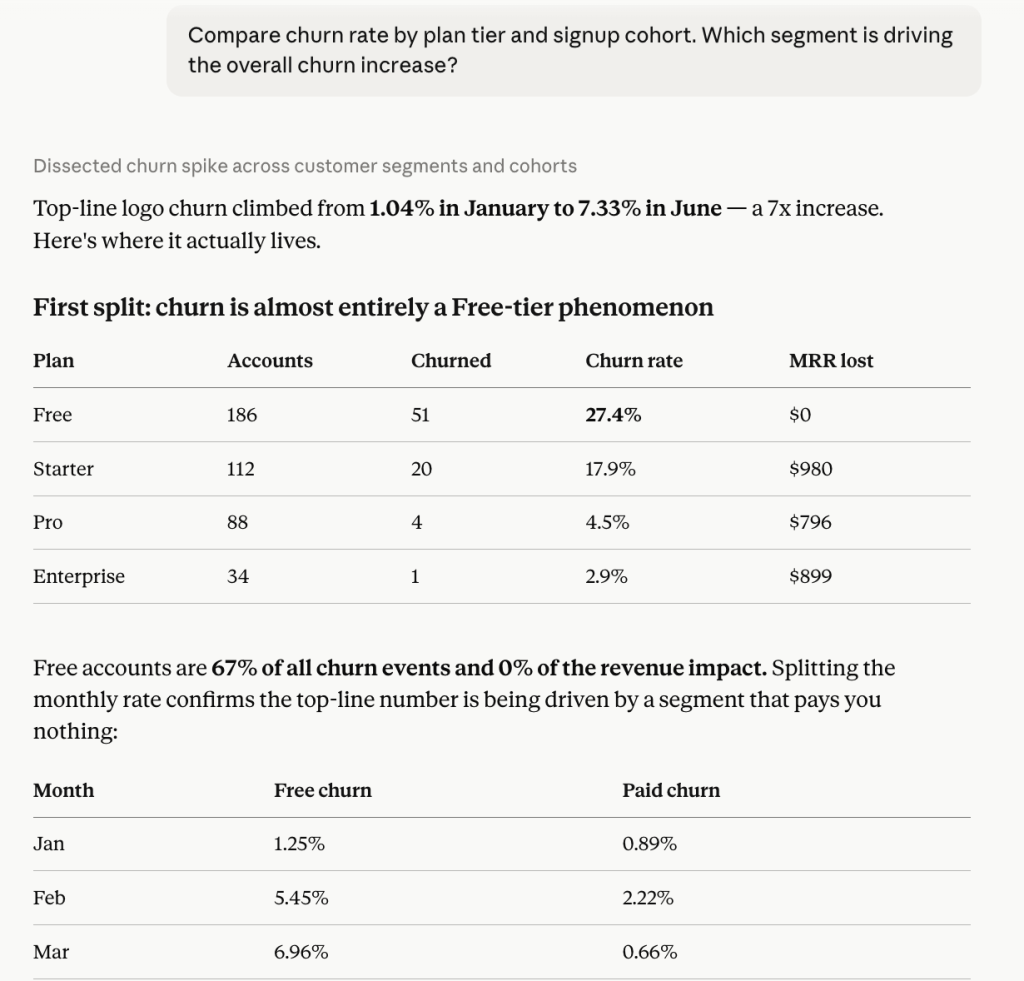
Claude splits the base by plan and cohort and pins the increase to recent signups in their first 90 days (an activation problem). It even flags that churn and the revenue leak sit in opposite tiers, so a single top-line number would have pointed you at the wrong segment.
Verified calculations
When you connect order data from your Shopify API, you get line items, discounts, and fulfillment costs across every product line. This is where analysis gets risky: language models are strong at interpreting patterns but unreliable at computing aggregates over a large dataset directly. A compound growth rate or a projection built on a slightly wrong sum is worse than no number at all.
“Calculate the compound monthly growth rate for each product line and project revenue for the next quarter. Show your calculations.”

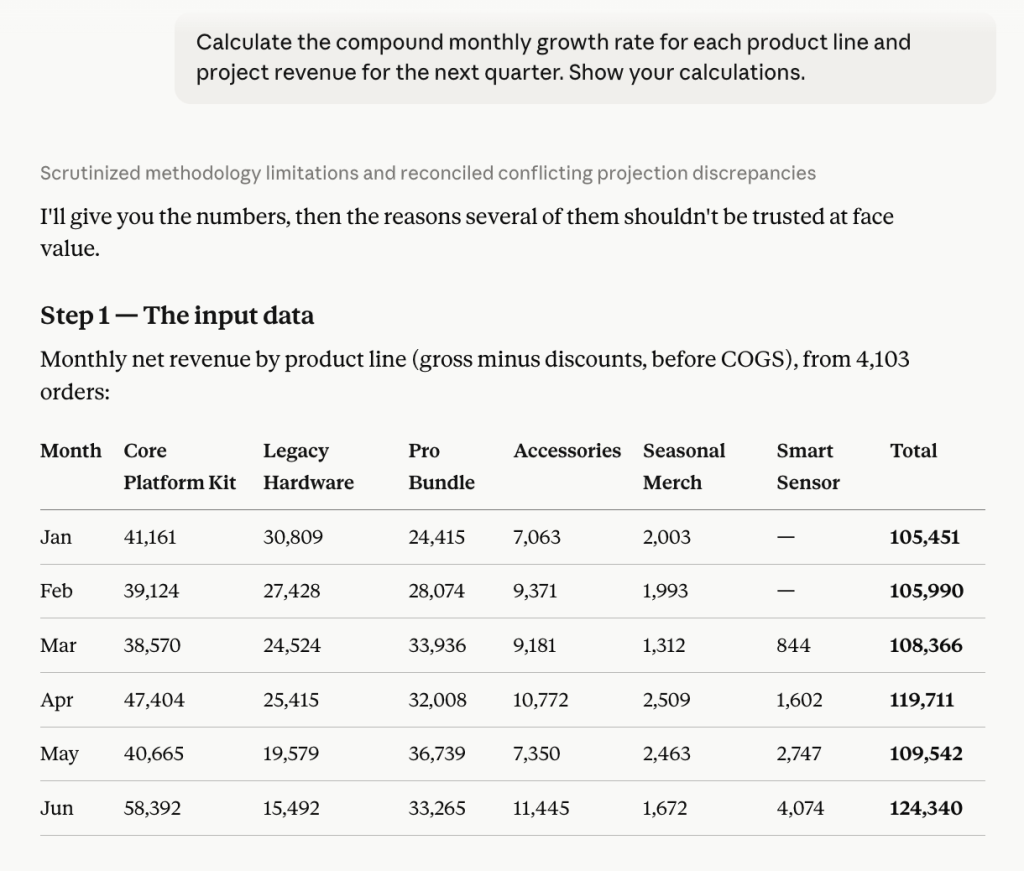
Claude has a built-in analysis tool for this. It writes and runs code to compute figures instead of estimating them. In this example, it computes the growth two ways, checks the projection top-down against bottom-up, and flags the product lines too noisy to project at all.
Coupler.io’s Analytical Engine adds a layer of accuracy on top. When a question involves calculations, Claude sends a structured query to the Coupler.io MCP, where the Analytical Engine runs the math and returns verified results. The model then interprets numbers it did not compute itself.
Data visualization
Any of the analyses above can become something you drop straight into a deck. With your dataset connected, you don’t have to export to a spreadsheet, build a chart, and reformat it. Just describe the chart you want and iterate on it in the same conversation.
“Create a chart showing revenue by segment over the last two quarters, and add a short takeaway under it.”

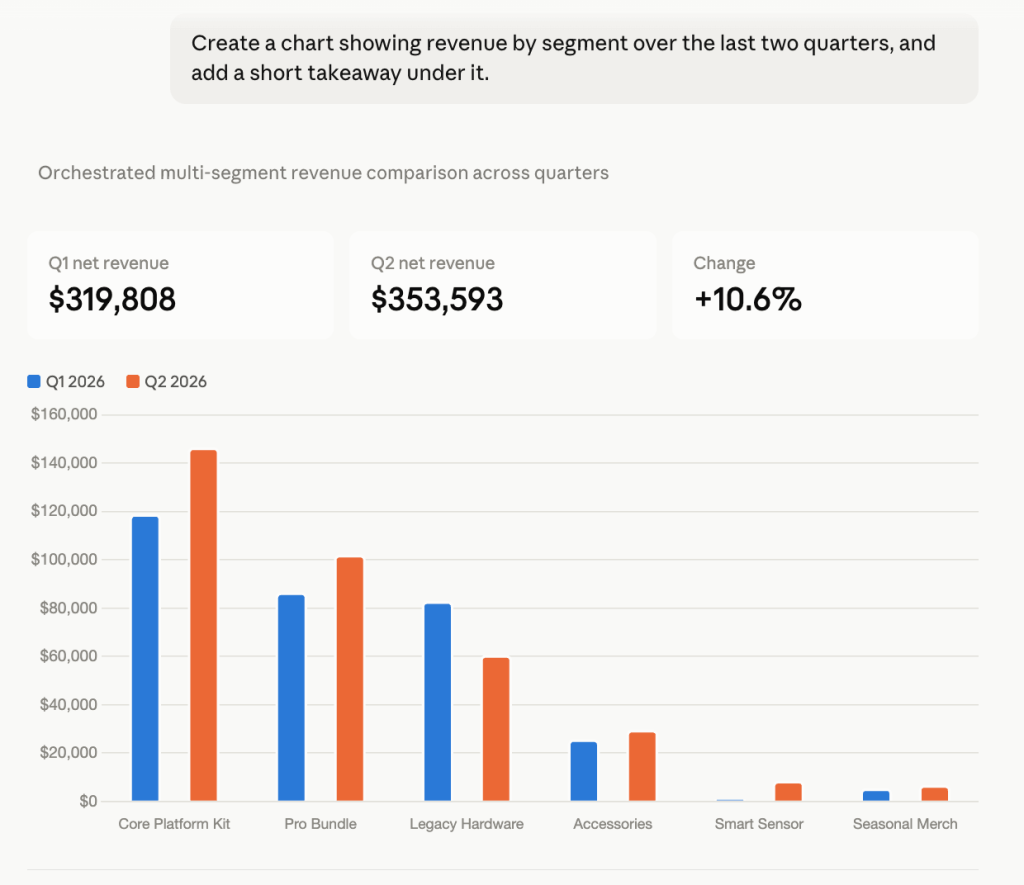
Claude builds the chart and writes a takeaway under it, and points out any numbers that look better than they are, like growth inflated by a mid-quarter launch. If you want a different cut, ask, and it redraws in the same chat.
Recurring reporting with Claude Projects
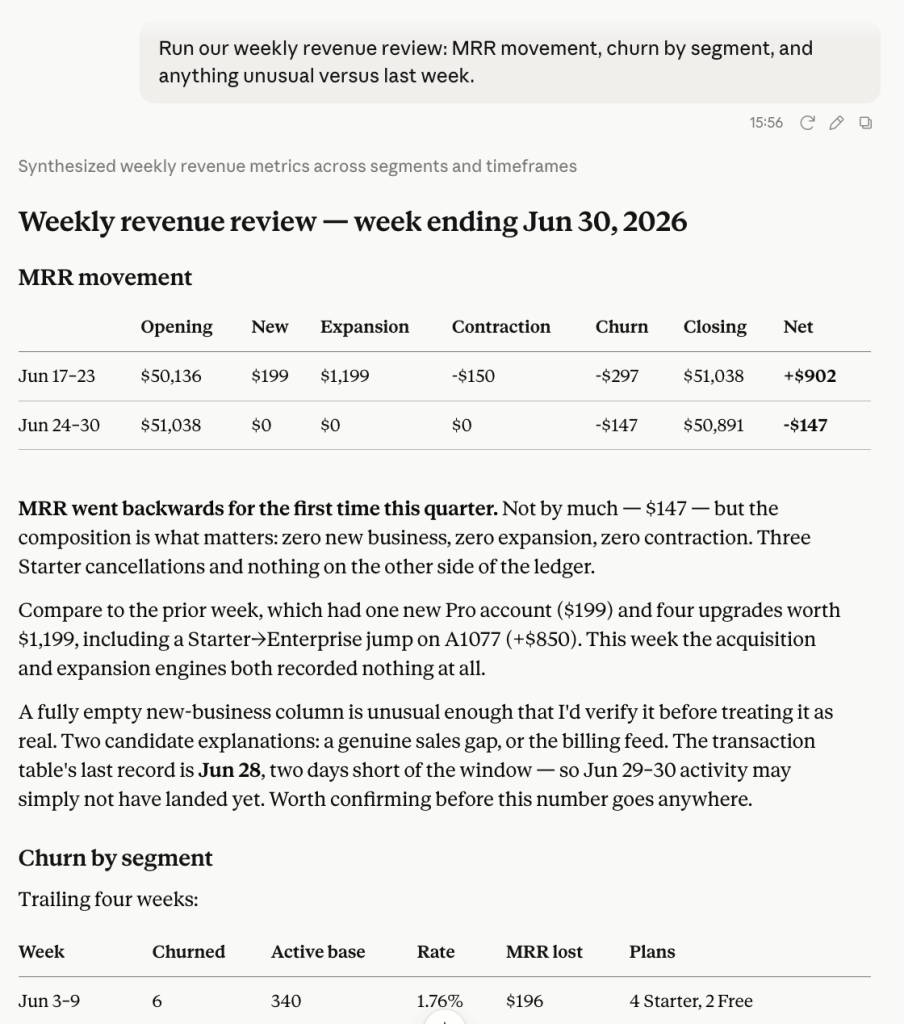
For API data analysis in Claude that runs weekly or monthly, set up a Claude Project. Add your business context once as the Project’s custom instructions, which work like a system prompt: metric definitions, targets, how your team talks about the numbers. This way every conversation in the Project starts with that context already in place. Now paired with scheduled data refresh in Coupler.io, the same prompt gives you an updated report on current data each time you run it.
“Run our weekly revenue review: MRR movement, churn by segment, and anything unusual versus last week.”

Turn your own API data into analysis-ready datasets for Claude
Get started for freeOther ways to load API data into Claude
Coupler.io covers most recurring analysis workflows. Two other routes exist for specific situations: a custom MCP server when you need Claude to take actions (not just analyze), and a manual file upload for one-off checks on small datasets.
Connect your API data via MCP / a custom connector
When it makes sense: you have engineering resources and need more than analysis. A custom MCP server gives Claude a live, two-way connection to your API, so it can read data and take actions.
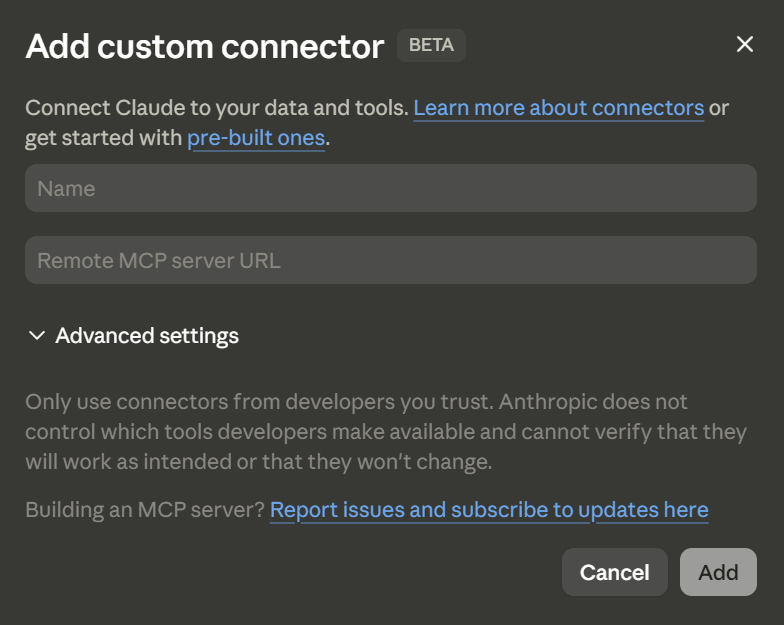
The Model Context Protocol (MCP) is an open standard created by Anthropic for connecting AI applications to tools and data. The route works like this: your team builds a remote MCP server that wraps your API, exposing its endpoints as tools Claude can call. You then add it in Claude under Settings > Connectors > Add custom connector, paste the server URL, and authenticate. From that point, Claude can query your API mid-conversation.

For fully programmatic workflows, there’s also the Claude API route: your code fetches data from your API and sends it to Claude for analysis through the Messages API. The setup is standard for developers: install the SDK with pip install anthropic, store your key from the Anthropic Console as the ANTHROPIC_API_KEY environment variable, and send data with client.messages.create, setting max_tokens for the response length. From there, you can add tool use, so Claude calls functions in your pipeline, or streaming responses for real-time output.
This suits teams building internal tools or automated pipelines rather than working in a chat interface. Along with the build cost, you also own the operational side: API rate limits, credential management, and updates when either API changes.
The cost of this setup is ownership. You build the server, host it where Claude’s infrastructure can reach it, handle authentication, and maintain it when your API changes. For a team that needs deep, custom integration, that investment is worth it. If you only need your API data available for analysis, Coupler.io gets you there without writing or maintaining any code.
Export API data and upload to Claude
When it makes sense: one-off analysis on a small dataset. If you need to check something once and the data fits in a file, this is the fastest route with zero setup.
Most APIs let you export a response as JSON, and many tools built on APIs offer CSV export. Claude supports both formats for file upload. So, you can upload API data to Claude as a file in seconds: export it, drag the file into the chat, and start asking questions.
The limitations show up as soon as the analysis becomes regular:
- Context window limits: Claude reads the whole file into the conversation, so large datasets either get truncated or crowd out room for the actual analysis. Uploading raw API dumps with thousands of records hits this fast
- No data refresh: The file is a snapshot. The moment it’s exported, it starts going stale, and next week’s report means a fresh export
- Manual repetition: Every analysis session starts with the same routine: export, clean, upload, re-explain what the columns mean. The work that Coupler.io does once, you do every time
For a quick look at a small dataset, none of this matters. For anything recurring, the pipeline route covered earlier is the sustainable way to load API data into Claude. The data stays live, structured, and ready whenever you ask.
Load your API data into Claude and start analyzing
try Coupler.io freeFAQs
Can Claude connect to an API directly?
Not to an authenticated API endpoint, no. Claude can read public web pages, but it has no built-in way to call your API with credentials and pull structured data. To connect data source to Claude, you need a bridge. The most reliable one is Coupler.io, which fetches your API data and delivers it to Claude as a structured and updated dataset. Teams with engineering resources can build a custom MCP server instead, and for one-off checks, a manual file export works.
How much API data can Claude analyze at once?
Everything in a conversation has to fit within Claude’s context window, which ranges from 200K to 1M tokens depending on the model and plan. Raw API dumps with thousands of records run into limits quickly. The practical answer is to send aggregated, filtered data rather than everything the API returns. Coupler.io’s transformations handle this before the data reaches Claude, so the dataset arrives at an analyzable size.
How do I keep the data in Claude up to date?
With file uploads, you can’t. Staying updated means re-exporting and re-uploading. With the Coupler.io Claude custom connector, you set a refresh schedule once, with updates as frequent as every 15 minutes, and every conversation runs on current data.
Can I analyze data from multiple APIs together?
Yes. When you import API data into Claude through Coupler.io, you can combine sources in one dataflow, appending similar datasets or joining related ones, so Claude sees a single unified dataset. It is also the cleaner option for cross-source questions like comparing product usage against billing data.