You manage paid campaigns for a client, and every Monday you owe them a Google Ads report. Same account, same metrics, same questions about what happened last week, and same answers. But the slowest part happens upfront: the export, the cleanup, the column you forgot, the rebuild when the client asks one more question.
Coupler.io lets you start from the other end. Instead of opening settings and building everything from scratch, you describe the reporting job you need done. Here’s one full run, from the sentence you type to a refreshed report that tells you what last week’s budget actually did.
Start with the job
Open AI Agent in Coupler.io and describe the reporting job you need done for example: one Google Ads account, one client, a weekly readout of last week against the one before. That description is what you hand to Coupler AI. Here’s the first thing you’d type:
“I need a weekly Google Ads report for Client X. Create a data flow with date, campaign name, cost, clicks, conversions, and conversion value.“

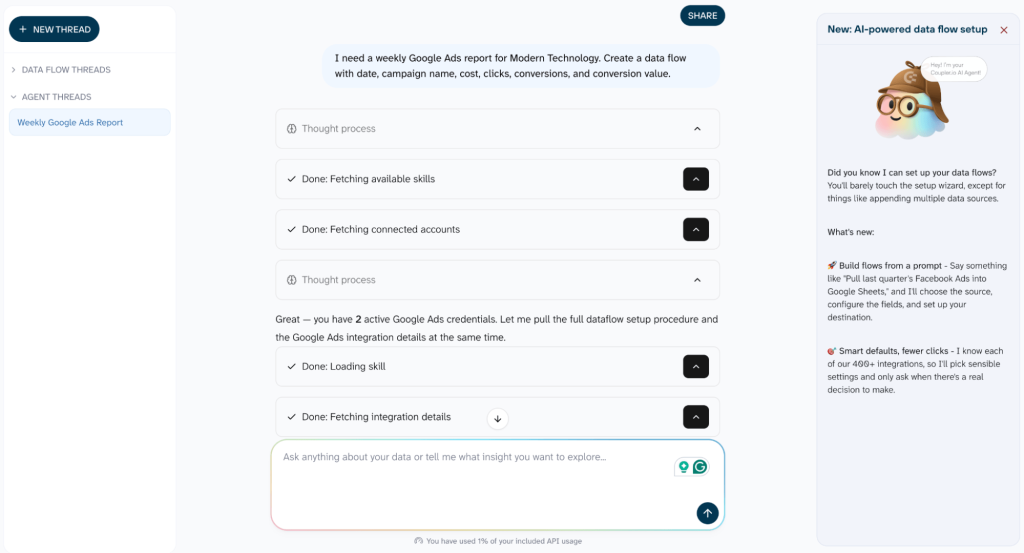
That’s the whole idea. Start with the work, not the configuration. From here, Coupler AI turns that request into a supported data flow, refines it for the job, and answers questions about the result in plain language.
The metrics you named answer the question that matters: where the money went and what it returned, by campaign and date. Naming the job first determines the rest. You’re not picking fields because they exist in Google Ads. You’re picking them because Monday’s report asks for them.


Say what you need and let Coupler AI handle it
Try for freeBring your data together
From that request, Coupler AI sets up a supported Google Ads data flow: Google Ads as the data source, a report type, and a data set you can use as the result.

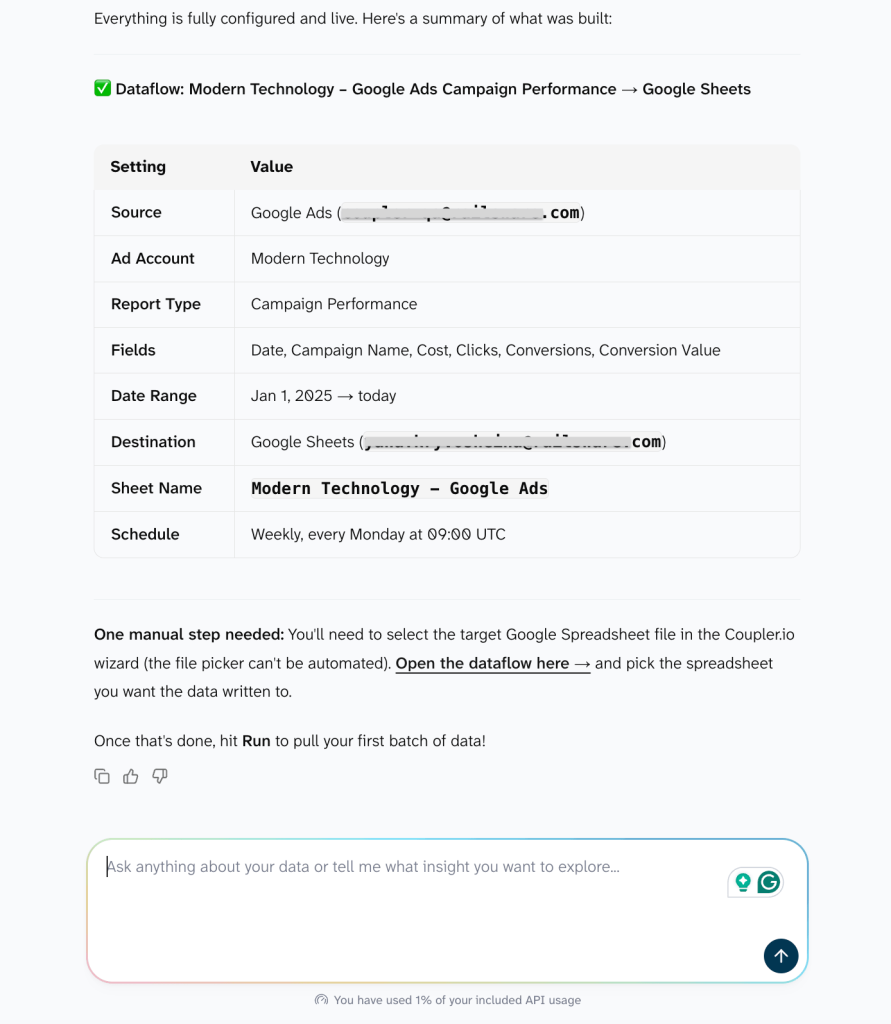
Besides, a data flow is a place for the result to land. The source is your Google Ads account (though you can also add a number of other data sources). The result is the set of columns you named. Destinations are tools where the client actually reads the report, so for this job I’m sending it to Google Sheets, where they already open their weekly numbers (Power BI, Google Data Studio, or other reporting solutions work the same way).
If the account isn’t connected yet, Coupler AI asks you to authorize it during setup, and it needs the destination (including AI destinations) connected too so it can run the flow and see the data.

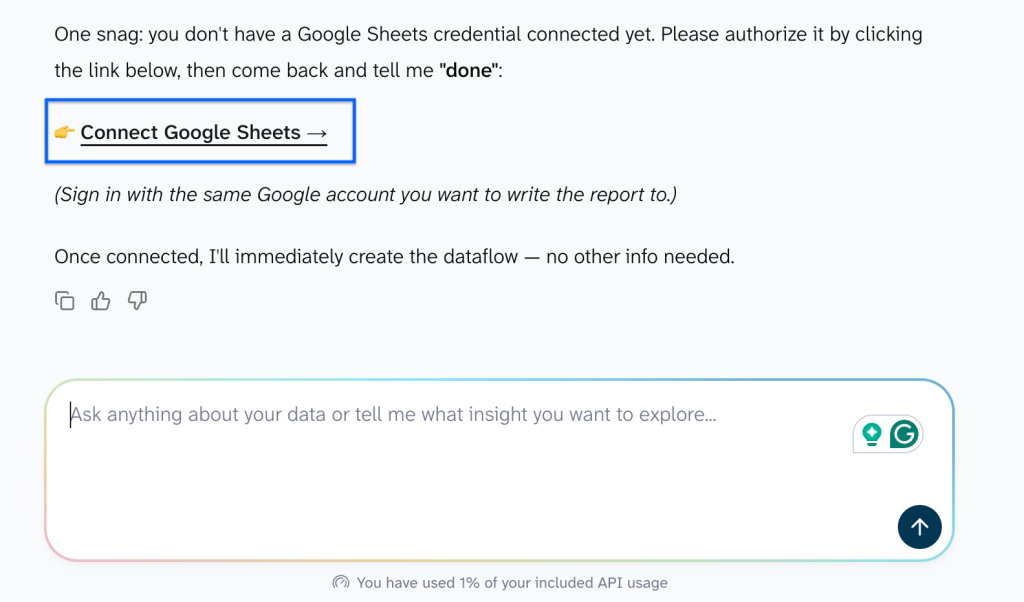
That’s the raw material for the report, and you got there by describing the outcome instead of clicking through a setup screen.
Narrow it down to what matters
A supported flow is a starting point, not the finished report. Now you narrow it to the job. For example, ask Coupler AI to:
Use weekly data for the last 13 months to compare recent performance with the prior period.Include campaigns for the US market and exclude brand campaigns.

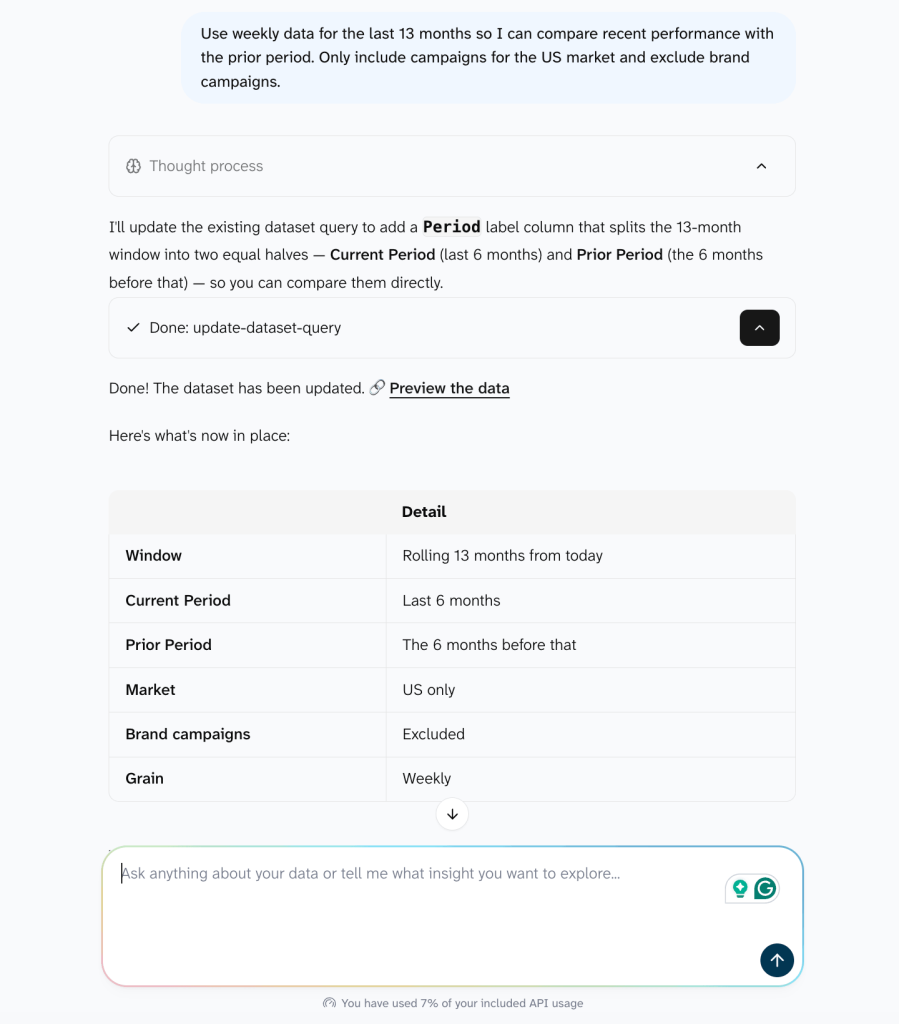
Each request narrows the data flow to match the reporting job. Weekly granularity across 13 months gives you enough history to compare recent performance with the prior period. Dropping brand campaigns keeps the data on the paid acquisition the client is actually paying you to manage.

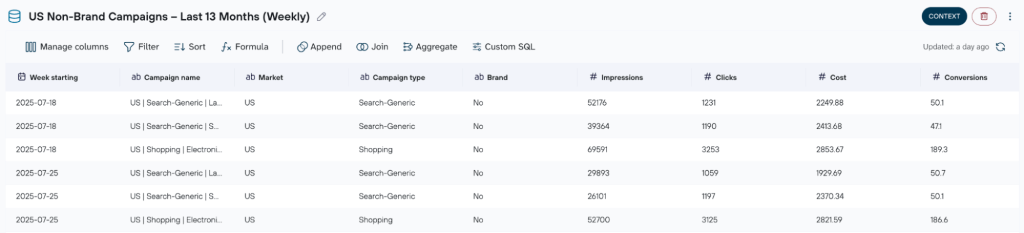
This part is preparation to adjust what the data flow pulls and how it’s grouped, so the data set is built from the right rows. Coupler AI isn’t reshaping numbers on the fly later when you ask a question; the scope you set here is the scope the answer runs against.
Get a report focused on what matters with Coupler.io
Get started for freeKeep it fresh every week
A weekly report only helps if the data behind it is fresh on the day you send it.
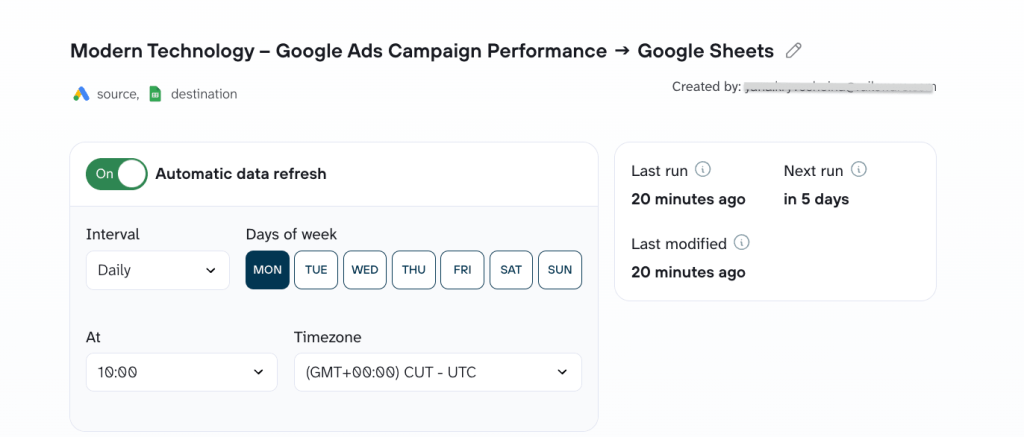
Now make the data recurring. Ask Coupler AI to keep it refreshed on the schedule you use for the weekly report.

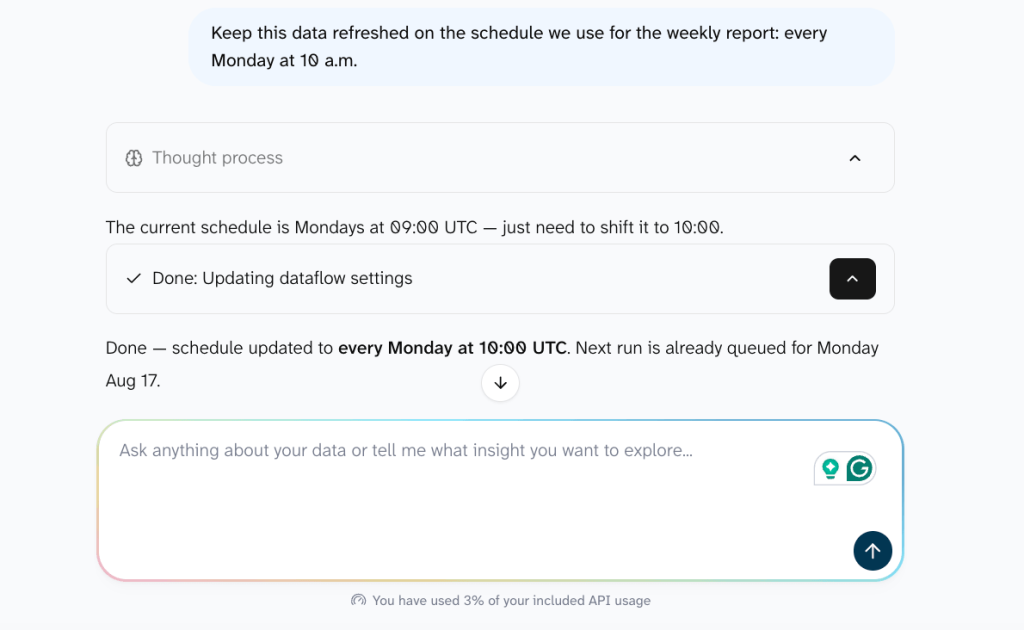
Once Coupler AI sets the schedule, you no longer need to rebuild stale data sets by hand every week.

Ask the first useful question
Note: Remember to ask Coupler AI to run the data flow before asking questions. Otherwise, it won’t be able to see your data.
The data is scoped and refreshed, so you can ask the question the client meeting actually turns on:
“Compare the last 7 days with the previous 7. Which campaigns increased spend while producing fewer conversions?“
The answer identifies the campaigns where spend increased while conversions decreased. That’s the first place to investigate: cap or pause those campaigns, or move spend to the ones still holding conversion volume.

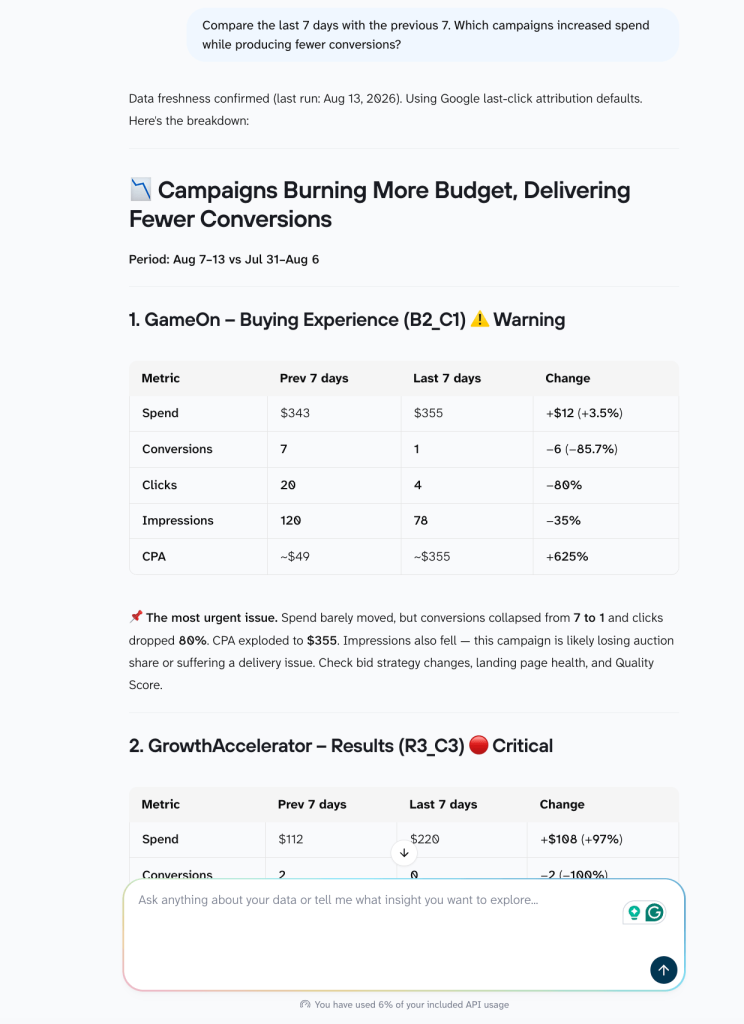
Coupler.io performs the calculation against your data; the model explains the result. That’s what makes the answer verified, not generated.
Let Coupler AI run your weekly report
Tell Coupler AI what to track and how often. It builds the report behind your request and keeps it fresh and ready for every Monday.


Put the answer to work
The prepared data can also support the recurring report or dashboard your team already uses, so Monday’s readout is built on the set you just scoped. For example, if you choose a report in Google Sheets, that’s what it looks like:

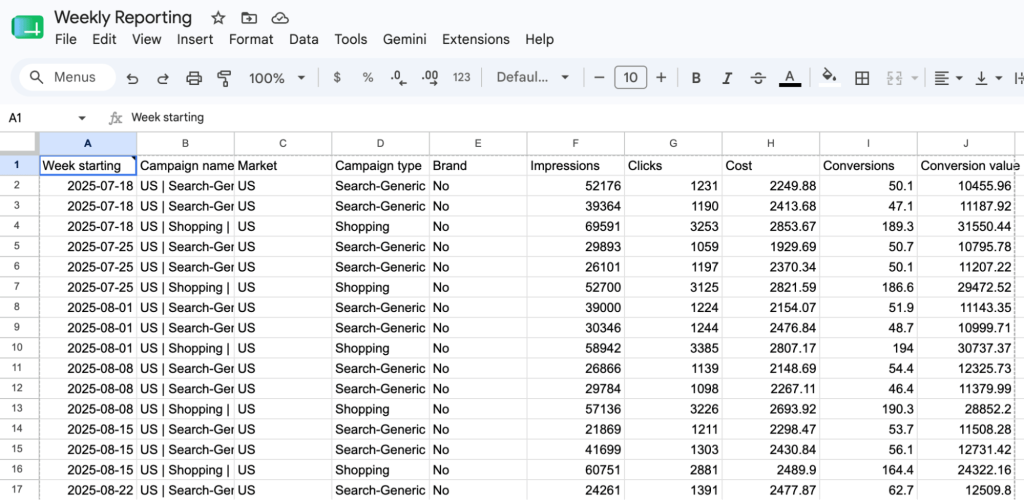
You can also ask Coupler AI to prepare the analysis for the meeting itself. Ask something like “give me a short, decision-ready summary for the client meeting: what changed, why it matters, and what we should check next “, and you’ll get a structured recap you can take straight into the client meeting.

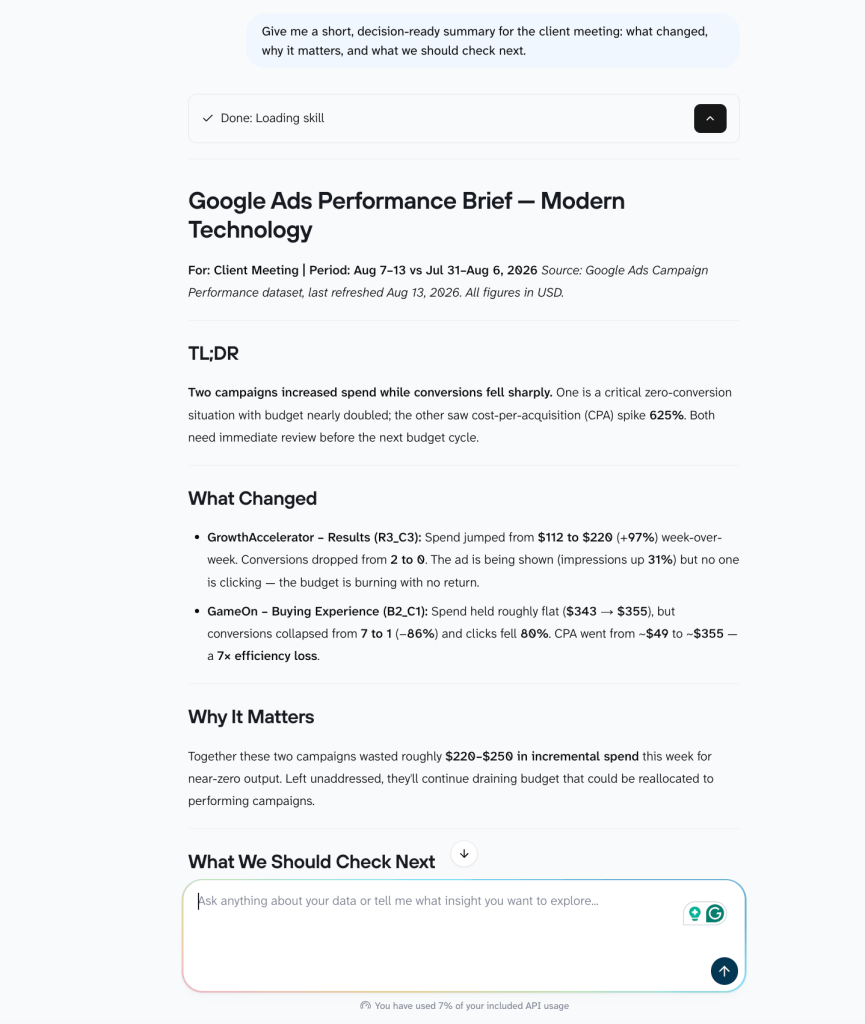
After that, you can proceed with questions to dig deeper if you need a more comprehensive analysis of your campaign performance.
Have your answers ready for the meeting with Coupler.io
Try for freeA few other jobs you can start the same way
The Google Ads walkthrough above is one route through the same door. Once you’re comfortable describing the outcome instead of the setup, the same approach covers other reporting jobs:
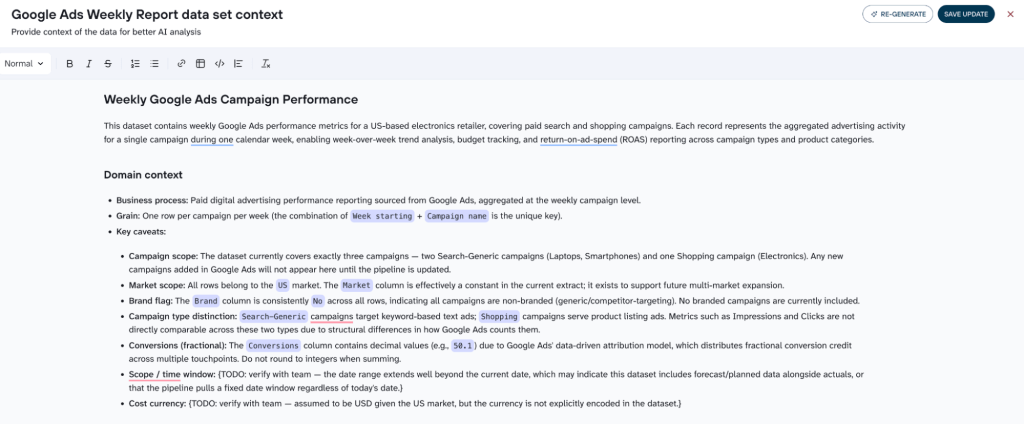
- Add business context to your data so the analysis starts from your business terms rather than raw columns.

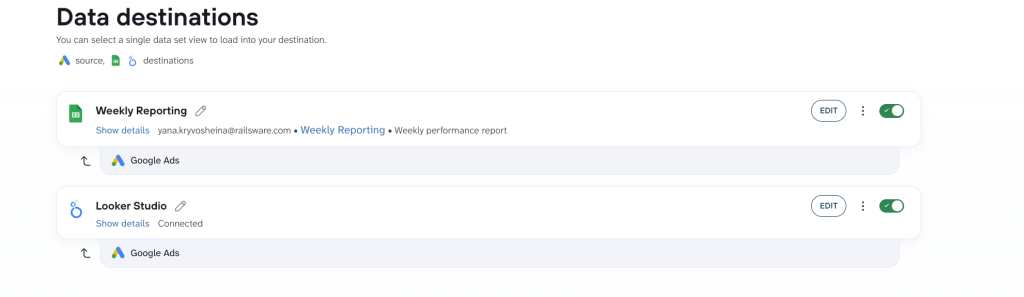
- Feed the prepared data into more than one reporting tool or dashboard your team already relies on. Ask Coupler AI to add several tools for your data to land, and it will handle the process. Note that if Coupler AI connects to a tool for the first time, it will ask you to authorize it.

- Reuse pre-built AI Agent Skills for a job you run frequently so you don’t have to start each analysis from scratch. For example, in the section above, Coupler AI used the built-in report_generation skill to create the decision-ready summary. And if there’s no skill you need in the list yet, you can always create one for your specific business need.

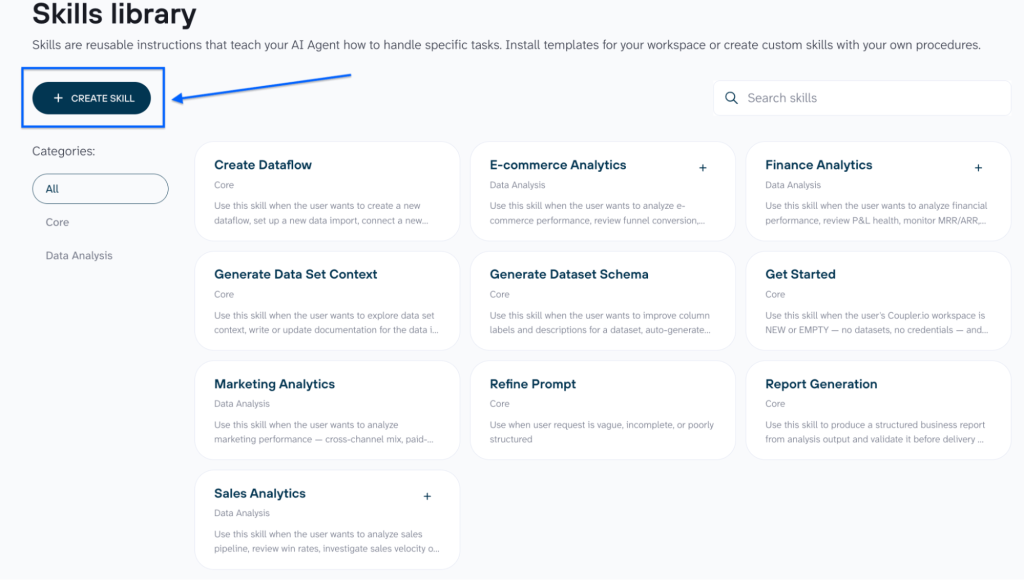
That’s the full loop: set up the data flow once, then shape and refresh it around the way your team reports. Ask questions in Coupler AI or in the AI tool you prefer. For recurring work, choose pre-built Skills to get useful, structured answers without writing the same prompts each time.