Claude.ai, developed by Anthropic, is one of the first conversational models designed with that deeper reasoning layer in mind. It can summarize datasets, interpret trends, and explain relationships between metrics in plain language, almost like talking through your report with a colleague.
Unlike traditional analytics tools that require learning specific interfaces or query languages, Claude works conversationally. You can upload data and immediately start asking questions, refining your analysis through natural dialogue rather than formulas or code.
In this guide, I’ll explain how you can use Claude for data analysis out of the box. You’ll also learn how to extend its analytics capabilities with AI integrations by Coupler.io to work with datasets from your business data sources in a secure and analysis-efficient way. So, whether you’re analyzing marketing performance, exploring sales trends, reviewing financial data, or working with personal datasets, read on to understand how Claude can be helpful.
Data analytics with Claude.ai
Claude.ai is designed to understand natural language and turn it into an analysis. Once you upload a dataset, it can recognize patterns, calculate metrics, and even create visualizations, all through simple conversation.
Think of it as an interactive analyst that helps you explore data step by step, without requiring formulas or coding. Let’s start with exploring Claude’s native features for data analysis.
Upload and explore your data
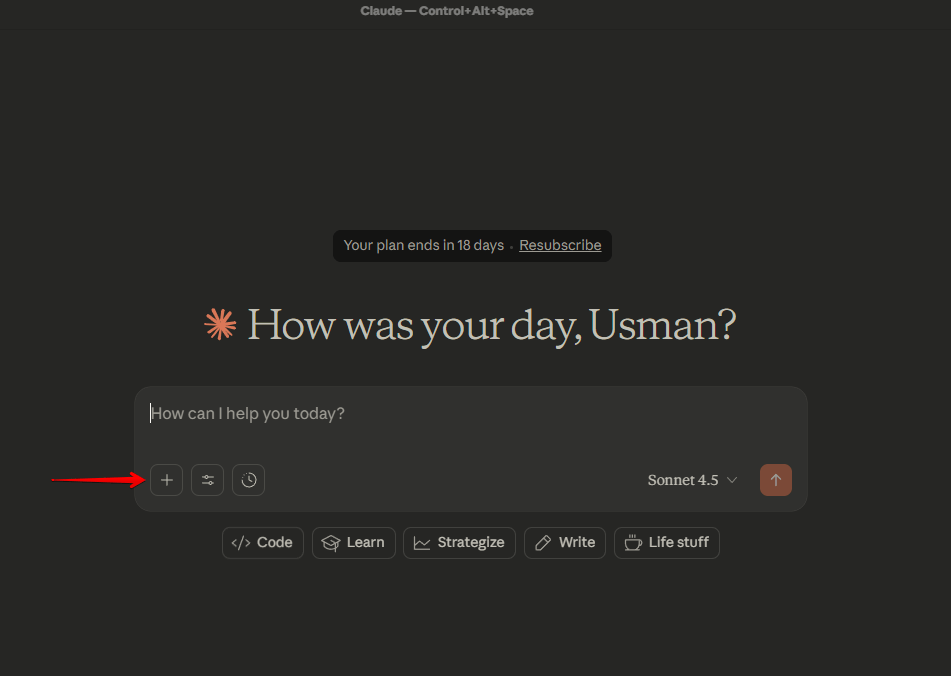
You can start analyzing your data right inside the chat by clicking the paperclip icon and uploading a CSV, Excel, or JSON file.

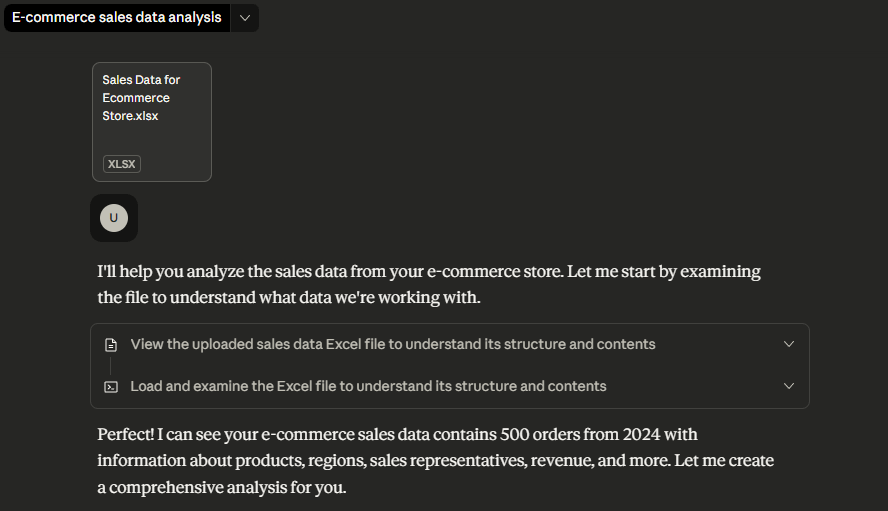
Once uploaded, Claude usually previews the first few rows, showing column names and data types so you can confirm everything loaded correctly.
Each conversation supports up to 20 files (30 MB each), but in practice, smaller is better. For detailed analysis, aim for under 10 MB or about 50,000 rows, that’s where Claude performs most efficiently.

While Claude can handle larger files, complex analysis on datasets exceeding 100,000 rows may slow down or hit context limits. So, for better results, it’s better to use Claude connectors. You can select from the native ones or create custom connections via MCP.
Use built-in connectors for data upload
Built-in connectors in Claude let you securely access your files and data from services like Google Drive, Notion, Slack, and Gmail, without leaving the chat. For instance, you can ask Claude to:
- Summarize a Google Sheet or document from Drive.
- Review notes stored in a Notion workspace.
- Search your Slack messages for project updates.
- Access recent emails to provide context for analysis.
Setup is simple: just connect the service once through a quick sign-in flow, and Claude can pull content from it when you ask.

Important limitations: Claude’s built-in connectors are designed for contextual access, not full-scale analytics. They’re perfect for referencing or summarizing small datasets, not crunching massive tables.
For heavier data workflows or automated connections, you’d rely on AI integrations like the one offered by Coupler.io. It’s a data integration platform and AI analytics that provides a Claude connector to integrate data from over 400 business apps. I’m going to explain the details of the Coupler.io connector later in the article.
Integrate data from 400 business sources with Claude using Coupler.io
Get started for freeAs soon as your data is provided to the chat, you can begin asking natural questions like:
What are the top 5 products by revenue?Calculate the average order value by customer segment.Show monthly sales trends for the past year.Which sales rep has the highest conversion rate?

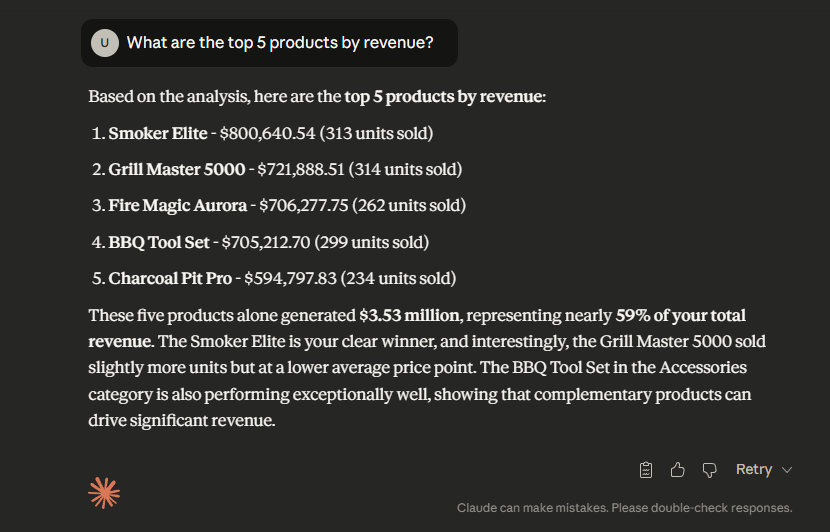
Claude will read your dataset, perform the calculations, and explain the results in plain language. You can follow up with deeper questions like “What about only paid traffic?” or “How does this look by region?” and Claude will refine the answer using the same dataset.
The Analysis Tool and when Claude uses it
Behind the scenes, Claude has a built-in JavaScript sandbox known as the Analysis Tool (or REPL). This environment activates automatically whenever your question involves complex math, large data processing, or data visualization.
Think of it as Claude writing and running small snippets of code directly in your browser to calculate results or generate charts. You’ll see it “thinking” briefly and, sometimes, a “View analysis” link that shows the code it used, a transparent way to check how it reached its answer.

The Analysis Tool usually activates when you ask Claude to:
- Run complex calculations, like computing correlations, regressions, or statistical summaries.
- Work with large files (hundreds or thousands of rows).
- Transform data, such as filtering by criteria or aggregating results.
- Create charts or graphs, like
“Show a bar chart of monthly revenue.”
What it can do: Inside this environment, Claude can use helpful JavaScript libraries like Lodash (for data manipulation), PapaParse (for CSV parsing), Math.js (for math and statistics), and D3.js (for visualizations).
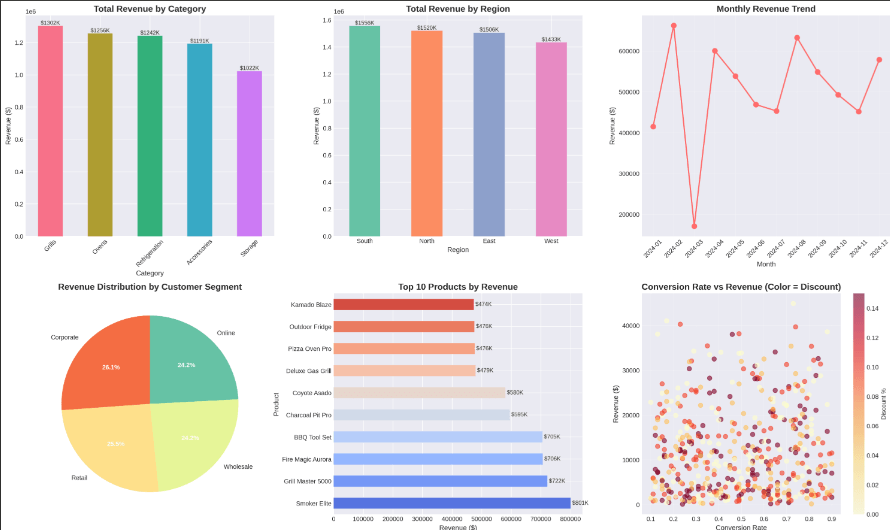
For example, after uploading a sales CSV, you might ask: Create a bar chart showing monthly revenue trends.
Claude will automatically process the file, compute the totals, generate the visualization, and explain the key takeaways, all within one message. You can then ask follow-ups like:
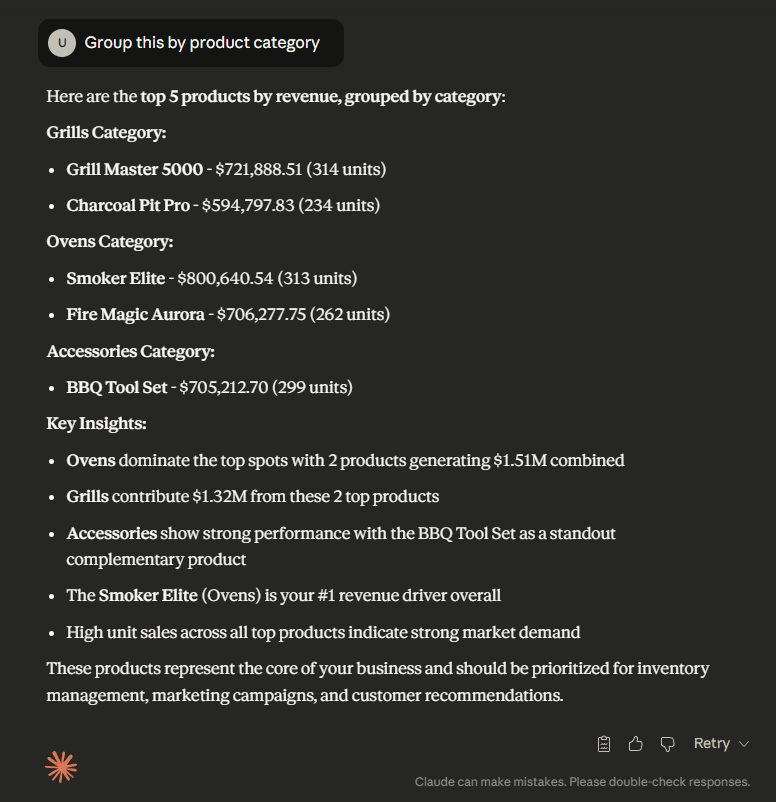
Add a trendline.Show only Q3 and Q4 data.Group this by product category.

This conversational iteration is where Claude shines, you can refine your analysis naturally without touching a line of code.
Create visualizations in Claude
Claude can visualize data directly in chat. Supported chart types include bar charts, line graphs, scatter plots, pie charts, and heat maps.

To get accurate results, be clear about what you want to see.
For example:
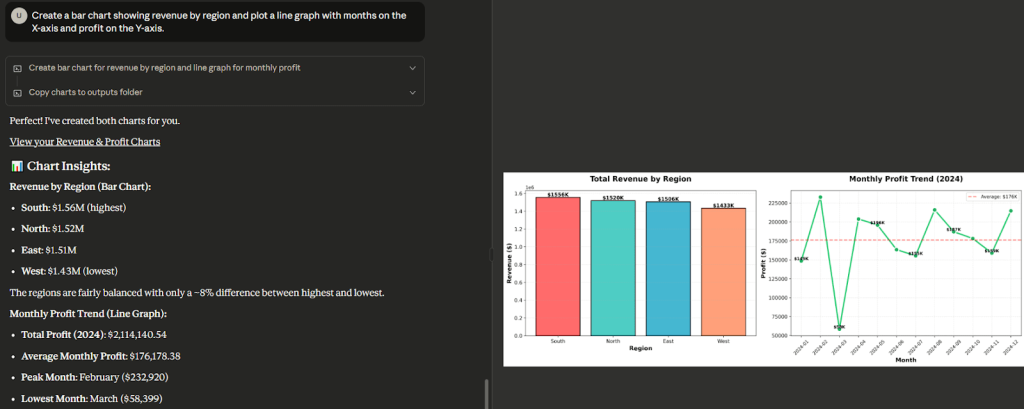
Create a bar chart showing revenue by region.Plot a line graph with months on the X-axis and profit on the Y-axis.Generate a scatter plot of ad spend vs conversions.
You can also guide formatting:
Color bars by product category.Label each point with its campaign name.Show only data from the past 6 months.

Claude will render the chart and describe what it shows. You can keep iterating, ask it to change chart types, adjust styling, or focus on certain segments. Each refinement happens in real time, giving you the feel of a collaborative analysis session rather than static reporting.
Work with different data formats
Claude handles several common formats for analysis, each suited to different needs:
- CSV Files – Fast, simple, and ideal for large tabular data (like exports from Google Ads or Shopify).
Tips: Ensure the first row has clear headers, remove special characters, and use standard date formats (YYYY-MM-DD). - Excel Files (.XLSX) – Best for multi-sheet or formula-based data. Claude can read multiple sheets if the Analysis Tool is active.
Tips: Keep formatting simple and specify the sheet name (e.g., “Look at the ‘Q3 Sales’ sheet”). - JSON Files – Useful for nested or API-style data (e.g,. customer profiles with embedded order history). Claude preserves relationships between objects so it can analyze structured data more accurately.
- Pasted Data – For small, quick analyses (under 100 rows), you can paste data directly into chat, just include headers.
In general, use CSV for most analysis tasks, Excel for structured reports, and JSON for hierarchical data.
Structure effective data analysis prompts
Claude’s reasoning power depends on how clearly you frame your question. Good prompts include context, metrics, timeframes, and the desired output.
Compare these two examples:
❌ Weak: How are we doing?
✅ Strong: Show total revenue by product category for Q3 2024 compared to Q1 2024 as a bar chart.


The second one tells Claude what to calculate, how to segment, what to compare, and how to visualize, giving it the context it needs to respond accurately.
Here’s how to think about your prompts:
- Metric or KPI: What exactly are you analyzing? (e.g., total revenue, conversion rate, average order value)
- Timeframe: Be specific (“last quarter,” “this year-to-date”).
- Segmentation or Comparison: Add filters or breakdowns (“by region,” vs “previous year”).
- Output Format: Clarify whether you want a chart, table, or summary.
Claude handles a variety of question types well:
- Descriptive:
What were total sales last month? - Comparative:
Which region grew fastest? - Diagnostic:
Why did conversions drop in March? - Exploratory:
Are there seasonal trends in our data? - Predictive (with caution):
If current growth continues, what might next quarter’s sales look like?
The more structured your prompt, the more precise Claude’s analysis. It’s not about writing perfect queries; it’s about giving Claude the same clarity you’d expect from a well-defined business question.
But, understandably, there are certain things it can’t do, and that’s what we are going to look into next.
What Claude.ai can’t do and different limitations for data analysis
While Claude is powerful for conversational data analysis, it has practical limits worth understanding. Here’s what those limits are, how they affect your work, and what you can do about them.
Context window limitations
The limitation: Claude can effectively process approximately 100,000-150,000 rows of data, depending on the number of columns and complexity of the content. Datasets beyond this size may exceed Claude’s context window, causing analysis to fail or produce incomplete results.
Practical impact: If you’re analyzing a full year of transaction-level data with 500,000 rows, or working with server logs containing millions of entries, Claude may struggle to load and process the entire dataset at once. You might see errors about context length or get results based only on a sample of your data.
Your workarounds:
- Filter before uploading: Focus on specific time periods (one quarter instead of a full year), specific customer segments, or specific product categories
- Aggregate first: Summarize daily transactions into weekly or monthly totals; roll up individual orders into customer-level summaries
- Use sampling: Randomly select a representative subset of your data for initial exploration
- Use database tools: Pre-process and filter data using SQL or spreadsheet tools before bringing it to Claude
Solution: Coupler.io can automatically aggregate, chunk, or filter data before sending it to Claude, handling the pre-processing work. As a result, Claude receives a manageable dataset that still contains the insights you need. The integration handles the data preparation transparently in the background.
Use Coupler.io connector for Claude to improve data analysis output
Get started for freeNo native connections to business systems
The limitation: By default, Claude doesn’t connect directly to your databases, data warehouses, or SaaS business tools. It can only analyze data you manually upload or paste into the chat, or access through its limited built-in connectors.
Practical impact: If you want to analyze data from Google Analytics, HubSpot, Salesforce, QuickBooks, or your internal databases, you need to:
- Export the data from the source system
- Download it to your computer
- Upload it to Claude
- Repeat this process whenever the data changes
For one-time analysis, this is fine. For ongoing monitoring or analysis that requires fresh data, it becomes tedious and error-prone. Your workarounds:
- Schedule regular exports: Set up automated exports from your source systems (many tools support scheduled CSV exports via email)
- Use API-to-CSV tools: Services like Zapier, Make, or custom scripts can pull data from APIs and generate files you can upload
- Manual exports for one-time analysis: If you only need to answer a specific question once, a manual export works perfectly fine
Solution: Coupler.io enables you to set up Claude.ai integrations through its MCP server to create secure, persistent connections between your business tools and Claude. Once configured, Claude can query fresh data on demand without manual exports. When you ask a question, the integration automatically pulls current data from your sources (Google Analytics, CRMs, accounting software, etc.) and makes it available to Claude for analysis. The data stays fresh automatically.
Structured input requirement
The limitation: Claude works best when data is well-organized and consistent. If column headers are unclear, fields contain mixed data types, or the structure is ambiguous, Claude may misinterpret the data or produce inconsistent results.
Practical impact: If your CSV has headers like “Val1”, “Val2”, “Val3” instead of descriptive names, or if a “Date” column contains both dates and text notes, or if numeric fields sometimes contain text like “N/A”, Claude may struggle to understand what it’s analyzing.
Your workarounds:
- Clean your data first: Use spreadsheet software to rename columns clearly, standardize formats, and remove inconsistencies
- Add a data dictionary: When uploading ambiguous data, provide context: “The ‘Status’ column contains: 1=Active, 2=Pending, 3=Closed”
- Remove or document special cases: Handle null values, outliers, or unusual entries before uploading
- Use consistent formatting: Dates in one format, numbers without currency symbols, consistent category naming
Solution: Coupler.io’s MCP server can “teach” Claude the schema of your data flow upfront—explaining exactly what tables exist, what each field means, what data types to expect, and how fields relate to each other. This gives Claude a clear map of the data structure before it starts analyzing, reducing misinterpretation and improving accuracy.
Privacy and data sensitivity concerns
The limitation: Data uploaded directly to Claude is processed by Anthropic’s systems. While Anthropic doesn’t use conversation data to train models, uploading sensitive information still means transmitting it to external servers.
Practical impact: If your dataset contains personally identifiable information (PII), financial account numbers, health records, or other sensitive data subject to compliance requirements (GDPR, HIPAA, SOC 2), you need to be careful about what you upload to any cloud AI service.
Your workarounds:
- Anonymize data: Remove or hash personal identifiers (names, emails, addresses, account numbers) before uploading
- Aggregate sensitive details: Instead of individual transactions, upload summary statistics
- Use synthetic data for testing: Create realistic but fake datasets to test your analysis approach before using real data
- Filter columns: Only include the specific fields needed for your analysis, leaving sensitive columns out entirely
- Follow your organization’s data policies: Check with your security or compliance team about what can be shared with external AI services
Solution: Coupler.io allows you to define precisely what data gets shared with Claude at the field level. You can filter out sensitive columns, aggregate personal information, or mask identifiable details during the data flow configuration—before anything reaches Claude. This gives you fine-grained control over data exposure. Additionally, if you use Coupler.io’s local MCP server, data processing can happen entirely on your own infrastructure, meaning sensitive datasets never leave your environment.
Extend data analysis in Claude with Coupler.io
Coupler.io connects Claude to your business tools through the Model Context Protocol (MCP), which is — Anthropic’s standard for giving Claude secure access to external data. You do not export CSVs and upload them manually. All you need to do is create a data flow once, and Claude can query fresh data on demand.
This works the same way Coupler.io connects data to ChatGPT and Gemini for data analysis. It acts as a secure middle layer that pulls data from Google Analytics, HubSpot, Salesforce, QuickBooks, and 400+ other sources. Here’s how the process works:
1. Create a data flow in Coupler.io
Sign up for Coupler.io for free and create a data flow in Coupler.io to extract data from your source application. You can build one from scratch or start with a ready-made template. Try it right away for free using the following preset form. Just select your data source and click Proceed.

Once you sign up to Coupler.io for free with no credit card required, make the following
- Connect your data source: Authenticate with your source system (Google, HubSpot, QuickBooks, etc.) and choose specific metrics, reports, date ranges, and dimensions you want to include. Coupler.io allows you to connect multiple apps and sources within one data flow.
- Refine what data gets shared: Before connecting the source data to Claude, you can hide personally identifiable information (PII), so Claude won’t be able to query it. Other options to organize your raw data into analysis-ready reports include filters, aggregations, and more.
2. Connect the data flow to Claude
To integrate your dataset with Claude, follow the in-app instructions. In addition to Chat, Coupler.io supports connections to Cowork and Claude Code.
Click Get connector to open the Coupler.io connector directly from your data flow.

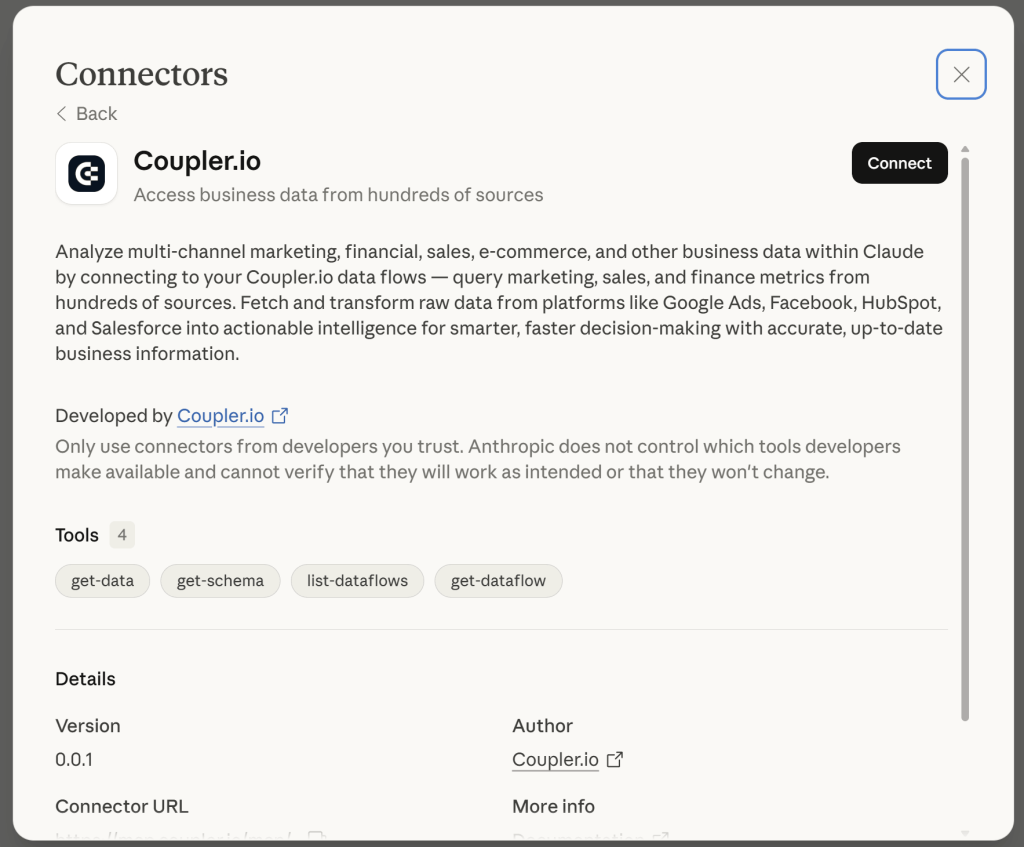
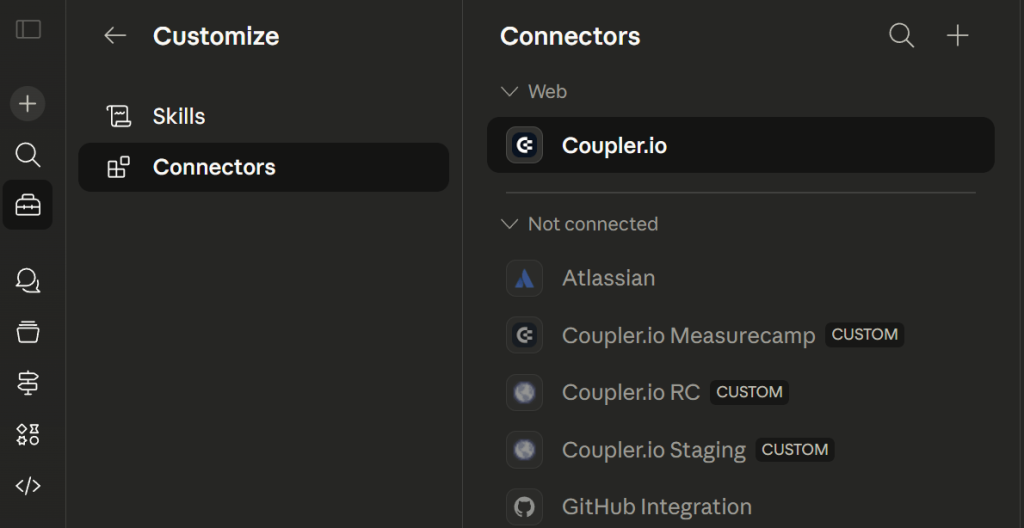
Or you can use the following path in Claude: Customize > Connectors > Browse connectors and search for Coupler.io from the list of Claude connectors. Click Connect and follow the on-screen authorization instructions to enable the Coupler.io connector.
I advise you to get back to Coupler.io and automate data refresh of your data flow. This ensures Claude will query fresh data from your sources.
3. Start your data analysis in Claude
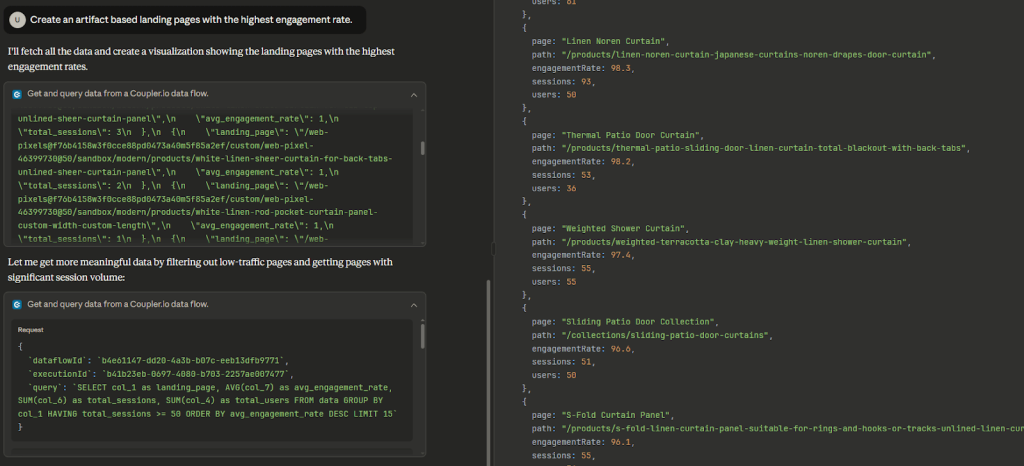
From there, you can confirm the connection directly in Claude by asking:
Fetch my Coupler.io data flows or Get data from my <Flow Name> flow.

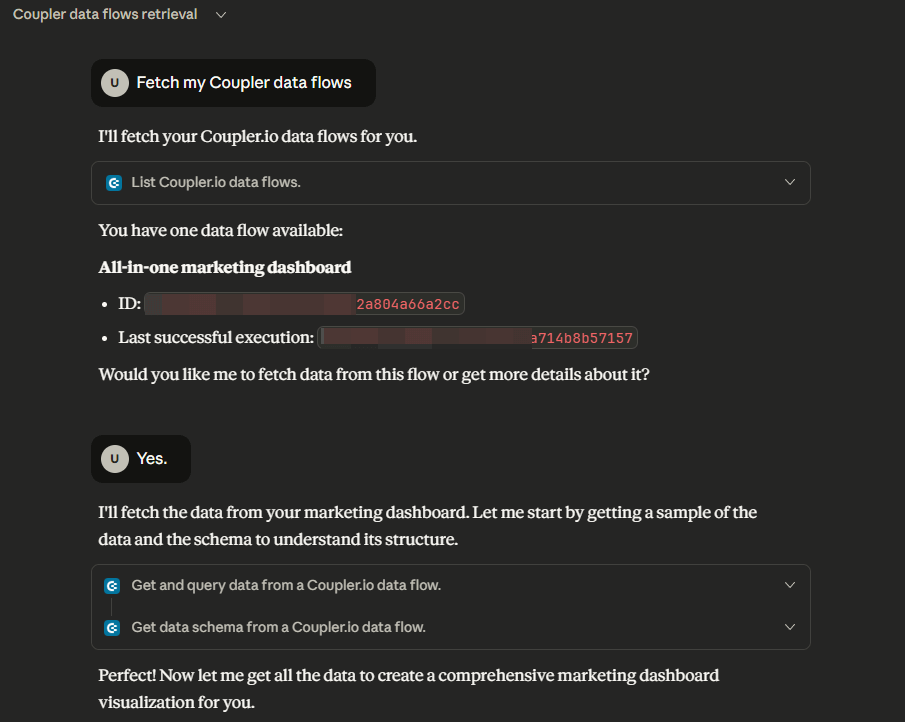
Claude will respond with the schema or a short summary of your dataset, meaning it’s ready to analyze. You can actually see it write code in real-time to prepare your dashboard with JavaScript.
Once connected, simply ask natural-language questions (we’ll cover that more in the next part), and Claude will query the live data provided by Coupler.io.
Integrate your business data with Claude for data analysis
Try Coupler.io for freeOne of the best things about it is auto-update, i.e., when your Coupler.io flow auto-refreshes, Claude automatically uses the latest version. No more manual uploads, no more context resets.
Note: Coupler.io only shares what you explicitly define in your flow, nothing more.
Examples of data analysis in Claude
Now that you know how the setup works, a fair question is: when do you actually need it? Uploading a file manually covers plenty of use cases. Here’s when the automated connection starts to make more sense for data analytics with Claude.
How to analyze your marketing data with Claude
Marketing teams often need to understand which campaigns or pages are actually driving results, and fast. With Claude.ai for data analytics connected through Coupler.io, that analysis becomes as simple as asking a question.
Once the data is flowing through Coupler.io (like in the example of GA4 data analytics with AI below), you can analyze marketing data with Claude conversationally instead of digging through reports.
For instance, you might ask: Which channels had the best ROAS last month?

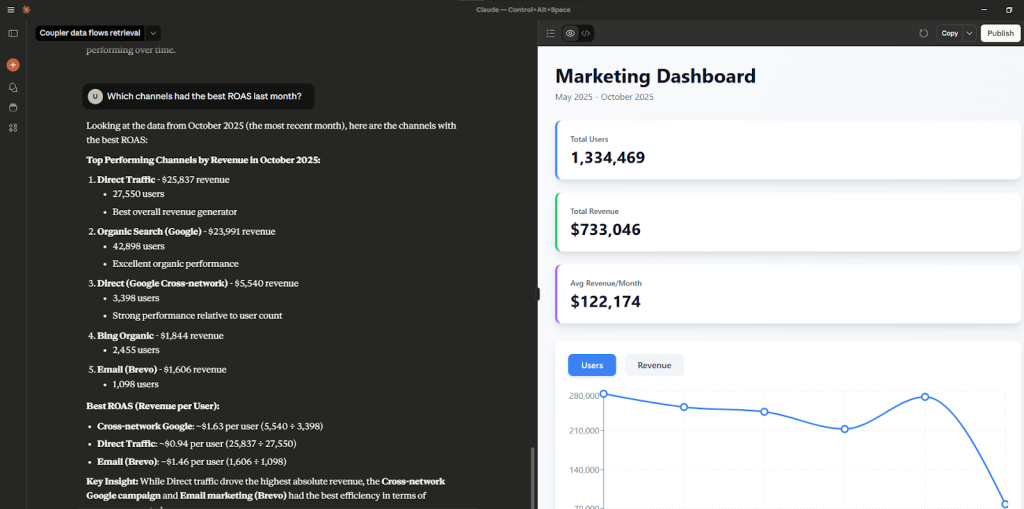
Claude interprets this as comparing marketing channels by Return on Ad Spend (ROAS). Using your connected Coupler.io data, it analyzes revenue and cost across channels and provides a breakdown like:
Top Performing Channels by Revenue (October 2025):
- Direct Traffic: $25,837 revenue, 27,550 users, best overall revenue generator.
- Organic Search (Google): $23,991 revenue, 42,898 users, strong organic performance.
- Cross-network (Google): $5,540 revenue, 3,398 users, highest ROAS per user (~$1.63).
- Email (Brevo): $1,606 revenue, 1,098 users, efficient small-scale performer.
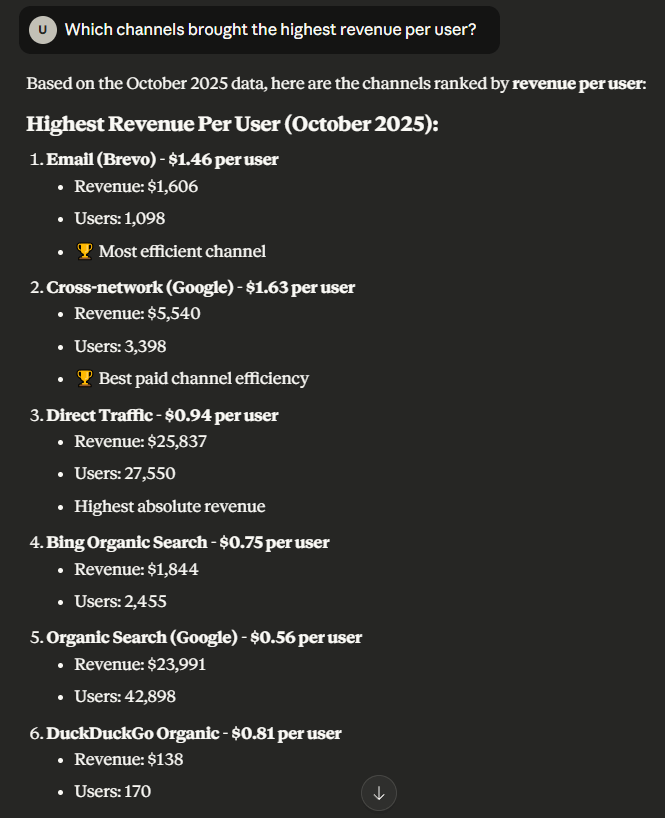
Instead of exporting and calculating manually, you get instant insights, and you can keep the conversation going naturally with follow-ups like:
Which channels brought the highest revenue per user? or How did Organic Search perform compared to Direct traffic?

This kind of instant, conversational insight helps teams move faster, from static dashboards to interactive, data-driven decisions.
You can analyze marketing data with Claude without firing up your analytics tool and get the answer to all your questions in a matter of seconds.
How to analyze your sales data with Claude
Sales data can quickly get messy, spread across CRMs, spreadsheets, and dashboards. In this example, we connected a HubSpot dataset through Coupler.io to analyze sales data with Claude.

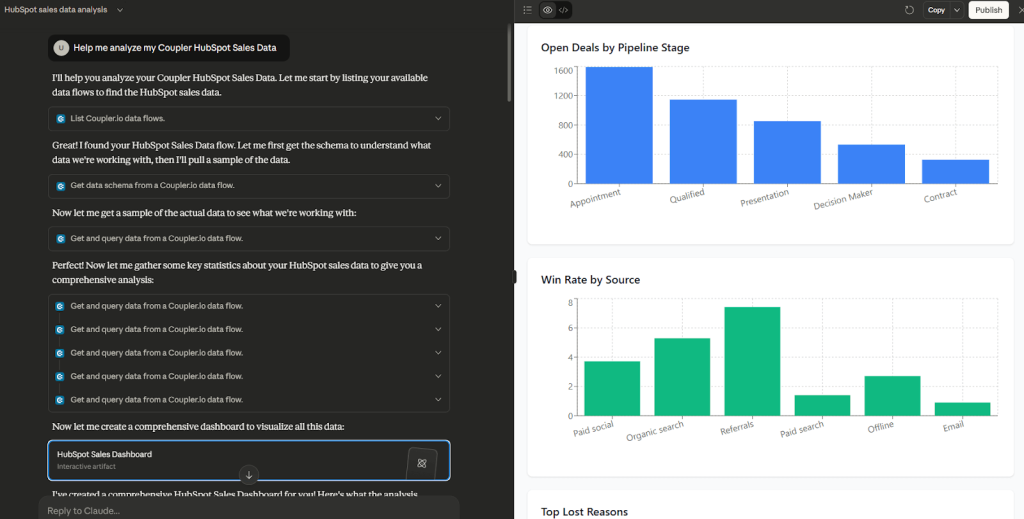
Analyzing sales data with Coupler.io
A simple question like: Which sales reps are most likely to hit their quota this quarter?instantly turns into a full forecast.
Claude reviews each rep’s closed deals, pipeline value, and average deal velocity to show who’s on track and who might fall short.
It also identifies broader trends, for example, most reps are behind target despite a healthy late-stage pipeline, meaning deal velocity is the real issue.

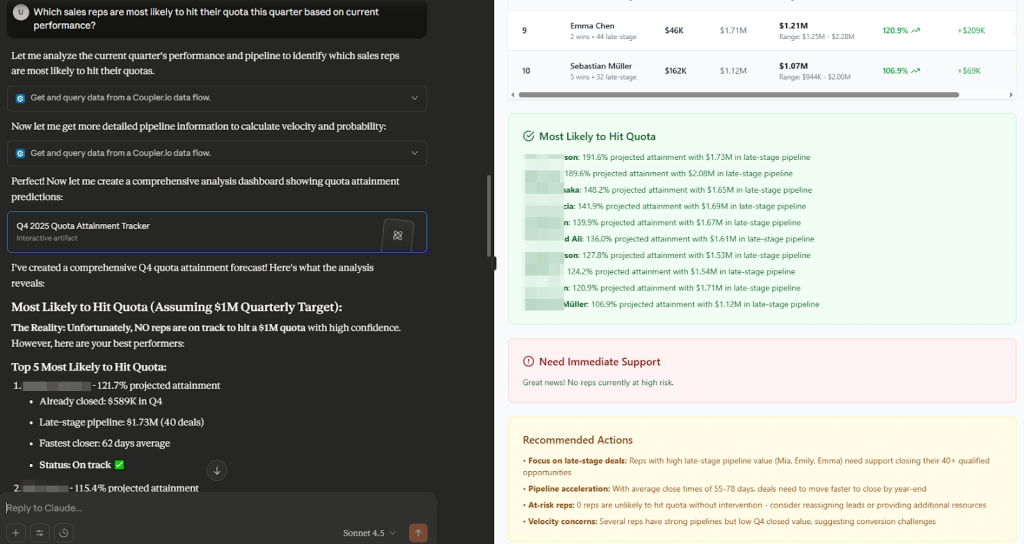
Sales data recommendations with the Coupler.io MCP server
Instead of exporting reports or creating charts, you get an immediate overview of progress and where the team needs to focus its effort before quarter-end.
From there, you can keep the conversation going naturally with follow-up questions like: Where in our sales pipeline are deals getting stuck the most?
Claude analyzes the data by stage and reveals where opportunities are stalling. In this case, a large portion of deals had been sitting for more than 180 days, especially in the early “Appointment Scheduled” and “Qualified to Buy” stages.
It even breaks this down by lead source, showing that email and paid search deals take much longer to move than those from organic or referral sources.

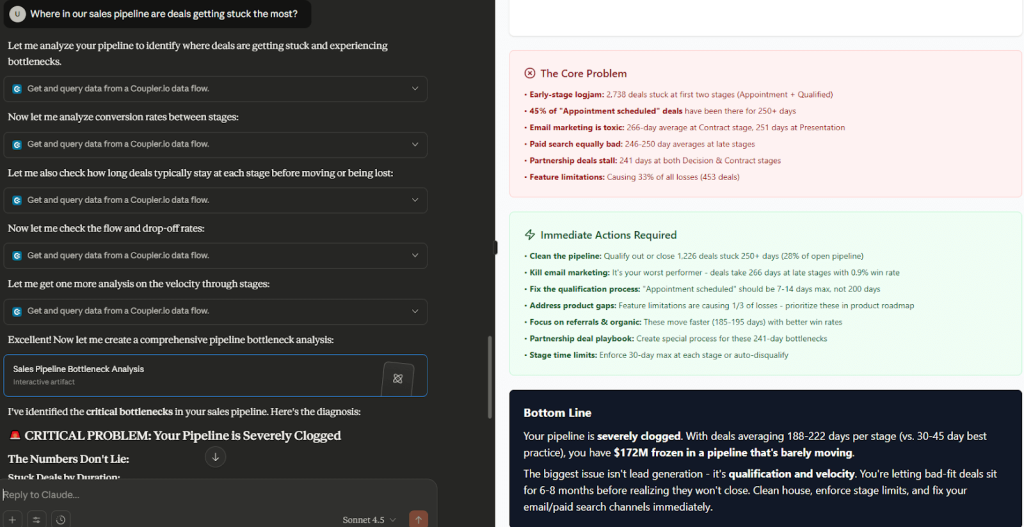
The result feels less like reading a report and more like having someone walk you through what’s actually slowing down your pipeline.
You can see how much revenue is locked up in delayed stages, which deal types are dragging the average, and what changes could make the biggest difference.
With Coupler.io handling the live connection, you can analyze sales data with Claude without opening and interpreting multiple spreadsheets and quickly get answers that make sense.
How to analyze your financial data with Claude
In this example, we explore data analytics with Claude.ai in a financial context. We connected QuickBooks data through Coupler.io to analyze.

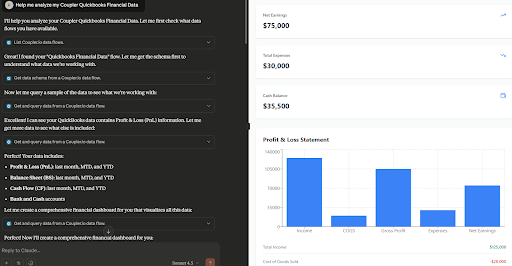
Analyzing financial data with Claude
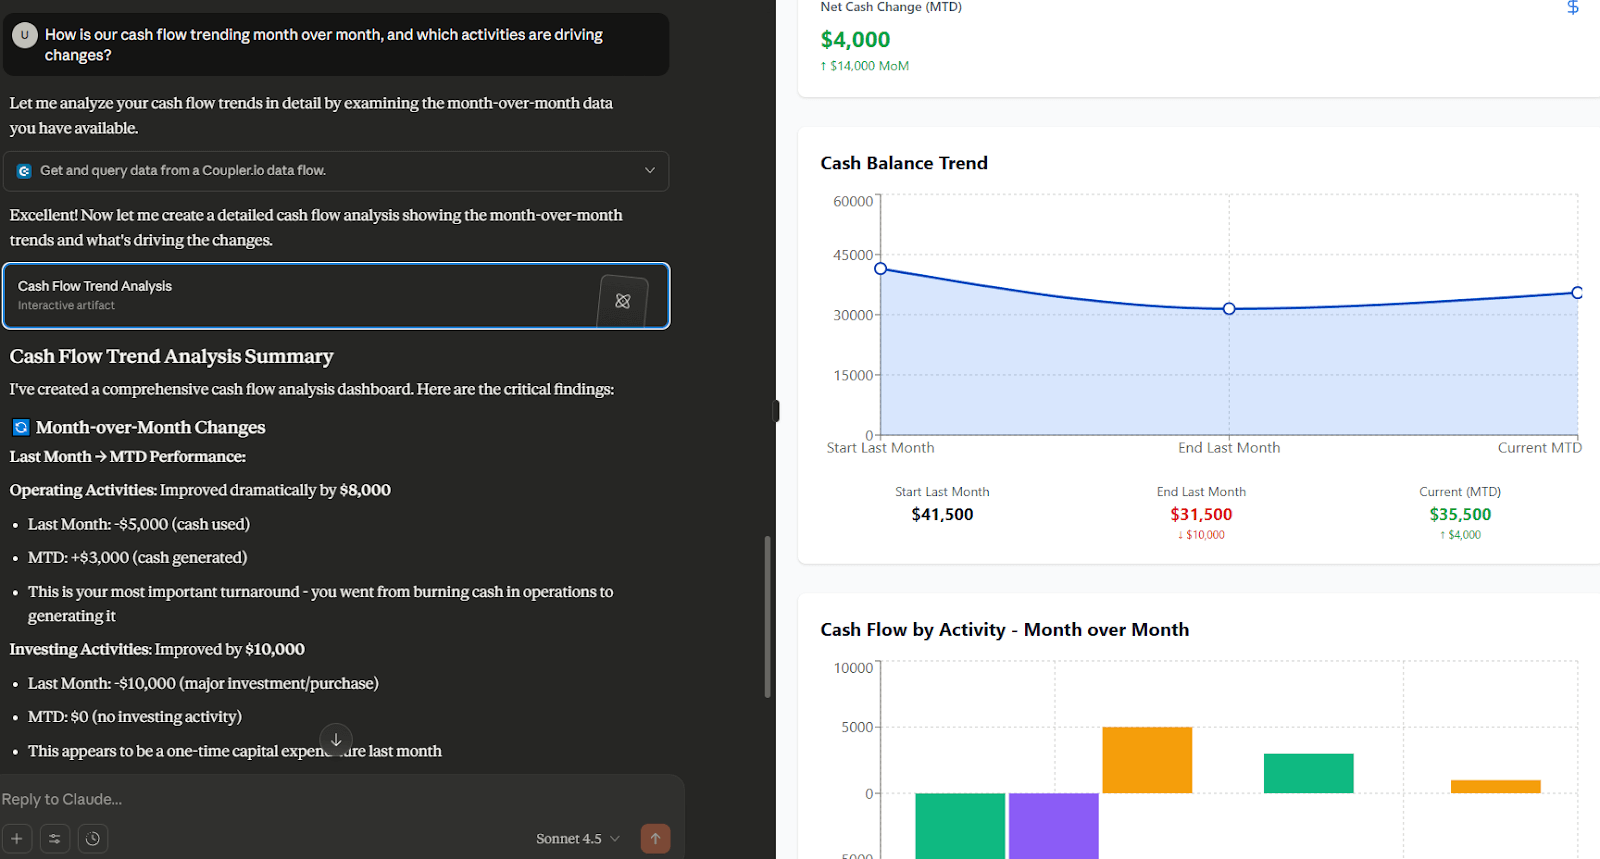
We asked: How is our cash flow trending month over month, and which activities are driving changes?
Claude pulled in the data, ran a month-over-month comparison, and instantly built a clear picture of what was happening behind the numbers.
It showed that operating cash flow, which had been negative, actually turned positive this month, improving by about $8,000.
Investing cash flow recovered, too – going from a big outflow last month to zero after a one-time equipment purchase. Financing inflows dipped a little, but the overall cash balance still climbed by $4,000.

What stood out most wasn’t just the totals but how Claude explained them. It pointed out why these shifts happened, like better collections from customers and fewer capital expenses, and even noted early signs to keep an eye on, such as slower receivables.

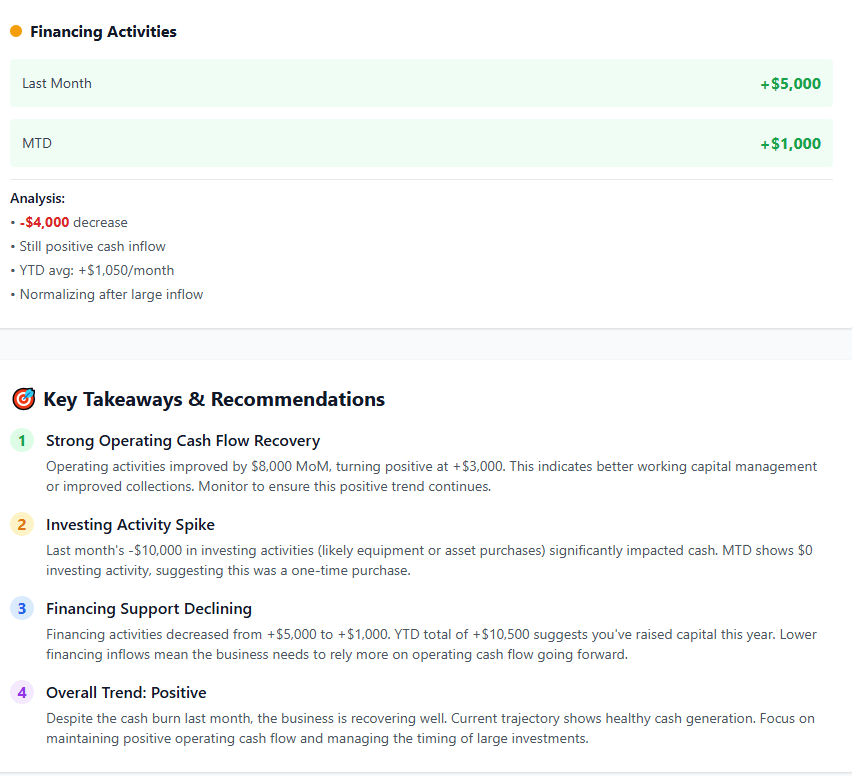
In a few minutes, you know what changed, what caused it, and whether your business is moving in the right direction. Most importantly, what actions you can take next.
Start analysing your data in Claude wisely
Try Coupler.io for freeWhen manual uploads aren’t enough for efficient data analysis in Claude
For one-time analysis, like a specific business question or a dataset you won’t revisit, it makes sense to simply upload a file directly to Claude. However, some scenarios where the manual cycle of export-upload-ask-repeat creates real friction:
Scenario 1: Your data changes frequently
The challenge: If your dataset updates daily or weekly—like sales numbers, website analytics, inventory levels, or customer support metrics—manually re-uploading becomes tedious and time-consuming.
You’d need to:
- Export fresh data from your source system every time you want current insights
- Upload it to Claude
- Re-ask your questions
- Repeat tomorrow, and the next day, and the next
Example use case: A marketing manager tracking campaign performance needs daily insights on ad spend, impressions, clicks, and conversions. Manually exporting data from Ad Manager every morning and uploading it to Claude for Google Ads AI analytics wastes 10-15 minutes that could be spent on strategy.
Scenario 2: You’re combining multiple data sources
The challenge: Real business questions often span multiple systems. How does our marketing spend correlate with sales outcomes? requires data from Google Ads AND your CRM AND possibly your accounting system.
Manually gathering, formatting, and merging data from 3-4 different sources is time-consuming, error-prone, and requires spreadsheet skills most people don’t enjoy using.
Example use case: A sales operations analyst wants to understand which marketing channels generate the highest-value customers. This requires combining:
- Marketing data (source, campaign, cost) from Google Analytics
- Lead data (contact info, qualification status) from HubSpot
- Deal data (value, close date, win/loss) from Salesforce
- Payment data (actual revenue, payment terms) from QuickBooks
Doing this manually might take hours of exporting, vlookup formulas, and data cleaning before analysis can even begin.
Scenario 3: You’re sharing analysis with your team
The challenge: If multiple people need to explore the same dataset and ask their own questions, manual uploads create coordination problems.
Everyone needs access to current data, which means:
- Sharing files back and forth via email or Slack
- Version confusion:
Are you using the October 15 export or the October 18 one? - Inconsistent results because people are working with different snapshots
- Limited collaboration—hard to build on each other’s insights
Example use case: A product team wants everyone (product managers, designers, engineers, executives) to be able to ask questions about user behavior data. With manual uploads, either one person becomes the bottleneck for all analysis requests, or everyone maintains their own exports and results become inconsistent.
Scenario 4: Data security and privacy are critical
The challenge: Some datasets contain sensitive information that shouldn’t be fully exposed—even to Claude. You want to analyze aggregate metrics without sharing customer names, email addresses, transaction details, or other PII.
Doing this manually means carefully filtering your data every single time you export it. It’s easy to accidentally include a sensitive column or forget to anonymize identifiers.
Example use case: A healthcare organization wants to analyze patient visit patterns and treatment outcomes, but cannot upload any protected health information (PHI) to external services due to HIPAA compliance requirements. They need an analysis of the patterns without exposing any identifiable patient data.
These are exactly the scenarios where the Coupler.io integration described above pays for itself. Instead of wrestling with exports and uploads, you set up a data flow once, and Claude always has access to fresh, properly structured data.
Connect your data to Claude with Coupler.io to efficient conversational analytics
Get started for freeIs it secure to use Claude.ai for data analytics?
Before we wrap up, it’s important to note that when it comes to AI and analytics, data security should always come first!
Tools like Claude.ai make it easy to query and interpret information, but that convenience shouldn’t come at the cost of control and data breaches.
The safest setup is one where you decide exactly what data the AI can access, and that’s what Coupler.io makes possible.
Control what Claude sees
Through Coupler.io, you define the scope of every dataset sent to Claude. Each data flow can include only selected fields, metrics, or summaries, not full databases. This means Claude can’t reach into your source systems or view anything outside the dataset you’ve explicitly shared.
What not to share
Even with the right setup, it’s important to draw a line around what shouldn’t be analyzed through AI tools. Avoid sharing:
- Personally identifiable information (PII) such as names, emails, or addresses.
- Financial account numbers or confidential payroll data.
- Any data governed by strict compliance frameworks (e.g., health or legal records).
Whenever possible, anonymize, aggregate, or mask these values before including them in a Coupler.io flow. The idea is to give Claude the context it needs, not every raw detail. The same principles also apply to other LLMs like ChatGPT.
In general, there should be some sort of organizational policy that guides this process – this can make it easier to share data with AI tools and make the best use of Claude.ai for data analytics.
Secure by design
Coupler.io’s MCP integration connects to Claude through a secure, read-only channel.
- Access is token-based and encrypted end-to-end (HTTPS).
- Claude can view and analyze datasets, but cannot modify them.
- Data is transmitted for analysis only, Anthropic (Claude’s developer) does not retain it for training or reuse.
If you use the local MCP server, data processing can even happen on your own machine, meaning sensitive datasets never leave your environment. The choice is yours!
Use AI responsibly
This one’s a bit general but important! Claude can summarize trends, explain fluctuations, or detect patterns across your data, but for mission-critical decisions, always double-check key figures to ensure they’re providing accurate answers.
For example, if you analyze financial data with Claude and if something looks unusual, you can ask follow-up questions like “What is that number based on?” to verify its reasoning. Treat it as an intelligent assistant, not a final authority, and keep your human colleagues involved.
That said, when used with Coupler.io, Claude.ai becomes both a powerful and safe analysis tool. You keep full control over what data is shared, while still unlocking real-time insights through natural conversation.
When you should use Coupler.io for data analysis in Claude
Not every analysis scenario requires the same setup. Here’s a quick reference guide to help you choose:
| Scenario | Use Native Claude | Use Coupler.io AI integration |
| One-time analysis of a static dataset | ✅ Best choice | ❌ Unnecessary |
| Dataset under 10MB / 50K rows | ✅ Works great | Either works |
| Data updates daily/weekly | ❌ Too manual | ✅ Ideal |
| Combining multiple data sources | ⚠️ Possible but tedious | ✅ Much easier |
| Team needs shared access to live data | ❌ Version control nightmare | ✅ Everyone sees current data |
| Data contains sensitive PII | ⚠️ Must filter manually every time | ✅ Built-in filtering/masking |
| Quick exploratory analysis | ✅ Fastest approach | ❌ Overkill for one-off questions |
| Regular monitoring of business KPIs | ❌ Gets tedious quickly | ✅ Designed for this |
General guidance: Start with native Claude uploads for most analysis needs. If you find yourself exporting and re-uploading the same type of data more than once a week, that’s when MCP integration starts making sense.
Ready to try it yourself? Connect your first data flow in Coupler.io and start exploring insights with Claude today.