Once Jennifer, an investor in a SaaS product, decided to check how things were going in their business. She asked Jim, a product owner, to share his KPI performance dashboard, where she saw the following: the number of signups has a steady growth meanwhile the MRR stands still. These two key performance indicators give an actionable insight – the product does great at generating leads but fails at converting them into clients. Based on this data, Jennifer and Jim can elaborate an action plan to improve their conversion rate, which should kickstart the MRR growth.
At the same time, the number of valuable KPIs is not limited to signups and MRR. Your business can have lots of important metrics that can help you assess the performance of activities, executives, departments, and the company overall. And the better you monitor these KPIs, the more chances your business has for success. So, let’s explore the value of tracking KPIs and dive into more hands-on best practices of this.
What is KPI tracking?
KPI tracking is a set of methods and tools to monitor the dynamics of specific key performance indicators.
Key performance indicators or KPIs are metrics that are critical to understanding the state of business, for example, recurring revenue, customer acquisition cost, customer lifetime value, net promoter score, and many others.
Why should you track KPIs?
The key value of tracking KPIs for any business is the facilitation of making decisions powered by data and achieving the established goals.
In layman’s example, when driving a car, you must track the amount of gas in your tank or the charge level of your battery. If you do not track this KPI, your vehicle is likely to stall somewhere in the middle of your route.
If we get back to our example with a SaaS product, the investor managed to understand the state of the business with the help of only two KPIs – signups and MRR. The more relevant metrics are available for tracking, the more insights the stakeholders can obtain and, therefore, run actions that will let them improve their business performance.
So, you should track KPIs to make data-driven decisions aimed at achieving your business goals.
What are the benefits of KPI tracking?
Apart from increasing the efficiency of decision-making, KPI tracking can also ensure other actionable advantages to your business operation:
- Enhances employee accountability & engagement. When you set and track specific KPIs, you engage your employees to increase their performance and hold them accountable for it. Everyone in your team knows the set goals, and they do their best to achieve them.
- Provides an understanding of your customer. With the KPIs related to understanding your customer needs, you can focus your effort on working with the proper audience. Tracking KPIs of this kind, such as churn, retention, engagement, and others, will let you get insights into customer behavior and preferences.
- Helps you identify bottlenecks and areas for improvement. KPI tracking allows you to see the overall picture of your business performance. So, you can identify the bottlenecks, which are the reason for underperformance, and smooth areas, which can be scaled for even better results.
That’s probably it for the KPI tracking introductory part. Below, you will find more hands-on information and best practices starting with the well-liked ‘how-to’😉
How to track KPIs – the main elements of a KPI tracking system
A KPI tracking system is a set of tools, processes, and approaches to measure and analyze metrics and performance indicators. As a rule, a KPI tracking system is represented by a dynamic analytics KPI report or dashboard.
Take a look at the following KPI tracking dashboard. It demonstrates the SaaS product funnel and metrics associated with each stage of the funnel. It’s most likely that Jennifer checked out some similar KPI tracking systems to understand that the conversion of an increased number of sign-ups is low.
To build this analytics dashboard or any other KPI tracking system, you need to complete five essential stages:
#1 – Set goals and KPIs associated with them
Identify what you want to achieve and the KPIs you will be using to measure your business progress. The selection of objectives will let you figure out what metrics are required to track the performance of your business or a particular activity.
For example, if your goal is to increase sales, the metrics to track should be associated with marketing performance and customer satisfaction.
No less important is that KPIs should be attainable and realistic.
#2 – Select metrics
Based on the identified key performance indicators, you can define the metrics and their benchmarks.
Note: KPIs are used to measure performance toward specific goals. Metrics are used to track performance across all areas of business. KPIs may be made up of a variety of different metrics.
For example, the goal of increasing MRR twofold by the end of the year is a KPI. To track this KPI, you’ll need different metrics, including website visitors, signups, paid users, and others.
#3 – Choose a KPI tracking solution
Select a tool or create a custom solution to track KPIs. In most cases, this means that you need to choose a platform to host your KPI tracking system.
You can do this using spreadsheets like Excel, dashboard templates, business intelligence tools, and other solutions.
For example, Google Analytics is a ready-to-go solution to track KPIs within web analytics. At the same time, most business owners tend to use custom web analytics dashboards built in Looker Studio, Power BI, and other tools that accumulate data from multiple sources. In addition, this provides you with enhanced data visualization options, graphs, charts, scorecards, and other elements to use on your dashboard.
#4 – Collect and transform data
Collect the raw data needed for KPI tracking. This also involves the necessary calculations and transformations to convert the raw data into measurable metrics.
The transformed data is then loaded into the tracking system in the form of KPI reports or dashboards. To collect data from your sources, you may use third-party ETL connectors, for example, Coupler.io, or rely on the built-in integrations of your KPI tracking platform.
#5 – Revise the KPI tracking system
Run recurring revisions of your KPI tracking system to understand its efficiency to make informed decisions. If necessary, make respective changes in order to improve the value of the KPI tracking.
It may occur that your analytics dashboard can contain otiose data that brings zero value to measuring progress towards your objective. In this case, it’s better to cut such metrics to keep the focus on your target KPIs.
#6 – KPI performance tracking and alerts
To make your KPI tracking system even more efficient, you can set up data alert notifications. These allow you to receive automatic notifications via emails or messenger apps when specific KPIs meet certain conditions. For example, you project a steady growth (2%) of signups per week. If this condition has not been met and last week’s growth was less than 2%, you’d get a notification to your preferred channel, for example, Slack.
Data alert automations are meant to ensure timely responses to the challenges you may encounter. Such a feature is available out of the box in different data management apps. For example, you can create custom notifications in Airtable, set data alerts in Power BI, and so on. Therefore, keep in mind this criterion when choosing a KPI tracking solution or building a custom KPI performance tracking dashboard.
A few KPI tracking examples
The above-introduced example of a KPI tracking dashboard was built in a spreadsheet app, Google Sheets. Let’s check out a few more examples of KPI performance tracking systems created in BI tools, such as Looker Studio and Power BI.
Ecommerce KPI tracking report
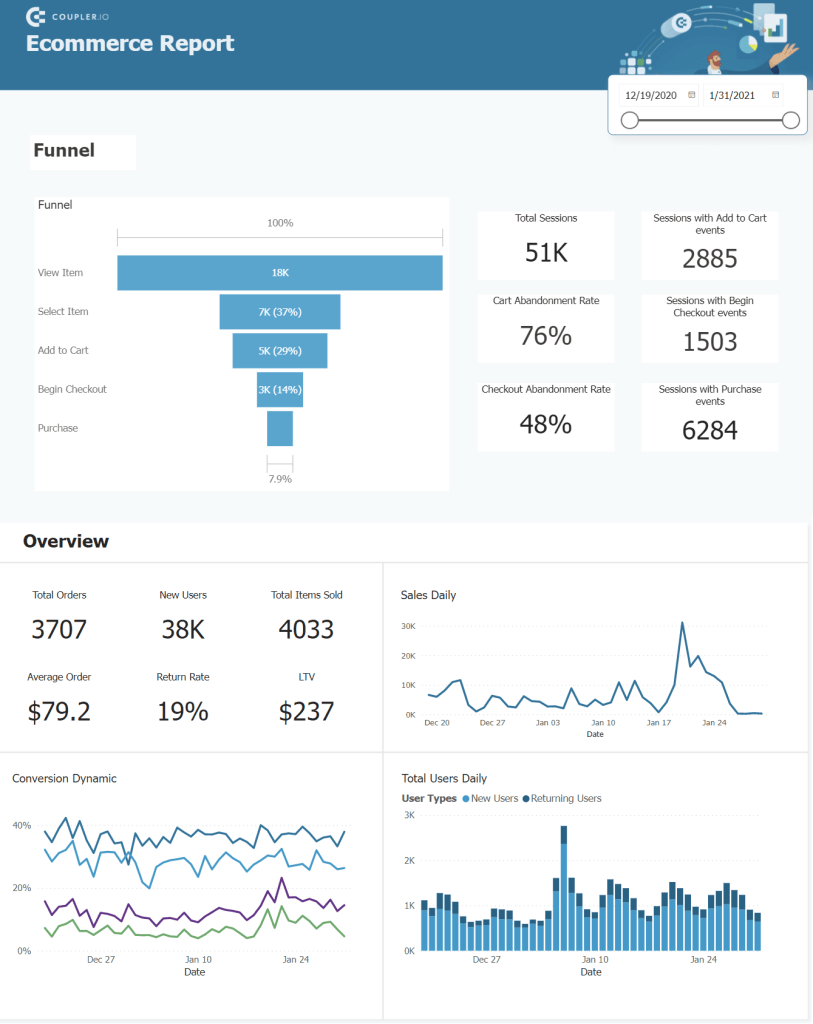
This ecommerce KPI tracking dashboard was built in Power BI. It consists of two main sections:
- Funnel – the visual representation of the sales funnel + a set of KPIs including total sessions, card abandonment rate, and others.
- Overview – a set of charts + key sales KPIs, including LTV, average order value, and others.
Such a KPI monitoring dashboard allows ecommerce businesses to keep an eye on the ball of their performance and improve decision-making thereupon.
Customer service KPI tracking dashboard

This customer service KPI dashboard was designed in Looker Studio. It provides a combination of charts and scorecards for different KPIs, including customer satisfaction level, number of opened and closed cases, and so on.
Such a dashboard is an actionable tool to track the KPI performance of the customer service department, which is crucial to increase the retention of your clients.
Do you want a powerful KPI tracking dashboard for your business?
All these dashboards have been designed by the data experts of Coupler.io.
Coupler.io is a data automation and analytics platform that offers two solutions:
- An ETL tool to integrate your dashboard with multiple data sources. This allows you to automate data collection and transformation without any coding. The number of supported sources is above 60, and it keeps growing every month!
- A data expert service to handle advanced data analytics and manipulation tasks. Coupler.io experts can automate custom dataflows, set up data infrastructure, and build a bespoke KPI tracking system.
So, you can use Coupler.io as a connector to automate data flow to the KPI tracking dashboard that you’ve built or are going to build yourself. The ETL connector will let you automate data refresh at a custom frequency from every day to every 15 minutes!
Or you can submit a request to the Coupler.io data expert service, which will design a custom KPI tracking dashboard according to your requirements. Choose wisely whichever option suits best for your needs.
How to define the right KPIs to track for your dashboard
Every KPI should bring insights into achieving a clearly-defined business goal.
In view of this, you need to select key performance indicators for your tracking dashboard based on the established goals. So there is no selection of the best KPIs everyone should use.
Let’s deep dive into this using the use case of Jennifer and Jim. Their primary goal is to increase MRR by 50% by the end of the year. The basic formula for MRR is:
Number of monthly subscribers x price of the plan
Note: We use a simplified MRR formula for this example. The formula will need to be updated if your product has multiple subscription plans, downgrade/upgrade options, and other factors.
So, the key variable in the formula is the number of subscribers. To become a subscriber, a user normally goes through the following core stages of the sales funnel:
- Awareness – a user lands on a website or page either from organic search or another marketing channel (advertisement, reference link, etc.)
- Acquisition – a user signs up for a product or service.
- Activation – a user performs a certain action or set of actions using the product or service, which indicates that the user becomes active.
- Purchase – a user makes a purchase.
The number and specifics of these stages can differ depending on your goals and marketing channels used. However, the logic remains the same. Based on this information, you can single out the metrics you should track. These include the number of users per stage.
In addition, you should include rates that indicate the process of moving through the funnel:
- From awareness to acquisition – acquisition rate
- From acquisition to activation – activation rate
- From activation to purchase – conversion rate
You can set benchmarks for these KPIs and configure alerts to notify you about their progress. So, your KPI tracking dashboard may contain the following indicators:
- Total number of new visitors
- Total number of sign-ups
- Total number of active users
- Total number of paid users
- Acquisition rate
- Activation rate
- Conversion rate
- Monthly recurring revenue
- Average revenue per user
These metrics are essential to track if your goal is to monitor and improve the overall growth of a SaaS product. For other goals, such as improving customer experience or validating new marketing channels, the set of KPIs will differ.
What are the top 5 KPI examples every business should be tracking?
The health and sustainability of any business rest on the following pillars:
- Positive balance between revenue and costs
- Growing inflow of new customers
- Decreasing churn of existing customers
These three factors allow you to define the core five metrics to include in your KPI tracking system:
- Revenue – a crucial KPI to measure financial performance.
- Customer acquisition cost – a KPI that indicates the efficiency of managing costs.
- Website traffic – how many new visitors come to your website and could be turned into leads.
- Net promoter score – a KPI that defines the level of customer satisfaction and how likely they are to recommend your product or service to others.
- Retention rate – the percentage of users who remain loyal to your business over a specified period. This KPI allows you to understand the effectiveness of customer service, product quality, and other factors.
Any business has multiple facets, which directly or implicitly affect its performance. Therefore, you may have different goals to achieve within your business activities and, hence, track different sets of KPIs like financial KPIs, marketing KPIs, etc.
What you need to integrate KPI tracking and reporting on a business
So, you’re a business owner who wants to run your business effectively, i.e., make decisions based on data, not only inner feelings. This requires you to set up a certain data management and analytics process. Here are the four major prerequisites to integrate KPI tracking into your business.
- Business objectives with defined KPIs
- KPI tracking system
- KPI system owner
- Reporting procedure
Of course, we’ll dive into each of these prerequisites.
Business objectives with defined KPIs
It goes without saying that no business can progress without clear goals. So, the first thing you need to do is define your business goals and align KPIs with them. Basically, a KPI is the quantitative expression of your goal. For example, a goal to increase signups can be expressed as a KPI to increase signups twofold by the end of the next month.
KPI tracking system designer
The main prerequisite, in our opinion, is the designer of the KPI tracking system, i.e. who will create and maintain it. As a rule, you need a data analyst or data engineer to configure complex data flows and calculations for your analytics dashboard. So, there are two options: hire a data expert as an employee or hire a third-party expert service.
Hiring an in-house data expert is a complex and time-consuming process. Besides, for some businesses, it may not be feasible to keep an experienced data analyst on board due to insufficient scope for them. In this case, hiring a data expert service for designing and implementing your KPI tracking system is the best option. This way, you can be sure to get results in a fast and efficient manner.
KPI tracking system
Your KPI tracking system can include one analytics dashboard or a set of dashboards & reports. Building a KPI tracking system is a complex process, which involves different subprocesses such as automation of data flows, design of dashboard layouts, etc.
It’s also crucial to keep in mind that when your business grows, your KPI tracking system will grow as well since new KPIs will appear eventually. Therefore, building a system to track KPIs is just a part of the process. It’s followed by maintaining, revising, and even revamping your tracking system.
Reporting procedure
Once your KPI tracking system is developed and ready for use, you should answer the following questions:
- How often to report your results?
- Who is allowed to get access to dashboards?
- What is the interval for the KPI tracking system to be revised?
These questions are meant to help you establish reporting procedures for working with the tracking system in an efficient way.
Top 5 KPI tracking best practices
Best practices are, in fact, guidelines or advice that are supposed to be the most efficient way to implement something. We, the data-driven SaaS company with 15+ years of business data analytics experience, can share the following recommendations on how to make the best of KPI tracking.
Keep KPIs easy to understand
Both objectives and their KPIs must be clearly defined so that all your team members can understand them and do their best to reach the goal. Every goal can be expressed as a KPI.
For example, if your goal is to increase customer satisfaction, the KPIs could be to increase the retention rate by x times and decrease the churn rate by X times, and so on.
Increase data accuracy
The data used for calculating and tracking your KPIs must be accurate and reliable. This will let you ensure that the decisions made are efficient according to the insights derived from your tracking dashboard.
There are multiple approaches to increasing data accuracy, including data entry automation, data cleansing, and so on.
Encourage ownership of KPIs
It’s important to promote the idea of a shared team’s accountability for achieving KPIs objectives. This will encourage the team to take ownership of the KPI and do their best to achieve the result.
For example, it’s not only the marketing manager’s responsibility for increasing website visits by 50% by the end of the year, but the entire marketing team. Knowing this responsibility will make the team owners of this KPI and motivate them to explore every avenue toward this goal.
Regularly review the KPIs
Your KPI tracking system should be flexible. This means you should regularly check whether the KPIs you track are aligned with the current business objectives.
For example, if your business objective is to increase revenue, revenue growth could be one of the KPIs to track. However, if you see that the revenue growth rate has been going down for a certain period of time, you may need to change the strategic goals.
Updated the KPI tracking process
The KPI tracking process should be dynamic and adapt to internal and external factors. This allows you to make your data accurate and decision-making efficient.
For example, most of you know that GA universal will no longer be available starting from July 2023. In this regard, all the KPIs based on the data coming from GA universal must be tuned to use the GA4 property.
Future trends in KPI tracking
Usually, when we begin to talk about future trends, the first topic to appear is AI (artificial intelligence). ChatGPT and other tools based on machine learning algorithms have already been actively used in different fields, including chatbots, recommendation systems, and others. So, KPI tracking with the help of AI is a matter of a couple of years or even months! The AI pace is tremendous.
What can AI give to KPI tracking in particular? Mostly it’s the ability to analyze vast amounts of data and identify trends not detected by most humans. Such progressive KPI tracking systems will let you gain deeper insights into business performance and make your decision-making not only data-driven but also AI-driven.
This will also contribute to predictive analytics. AI will use historical data to forecast future progress making KPI tracking as efficient as it has ever been before.
Apart from AI expansion, another trend we’d like to highlight is real-time tracking. Currently, most KPI tracking systems use scheduled automation, i.e., you get updated data every day, every hour, or at another frequency. The future trend strives for real-time data refresh, which should guarantee even more agile decision-making.


