Building a marketing dashboard usually means exporting CSVs, cleaning them in a spreadsheet, and wiring charts in a BI tool. Then someone asks for one more metric, and you start again.
There’s a faster way. Connect the Coupler.io MCP server to Lovable and describe both the data and the dashboard in one prompt. Lovable sets up the data pipeline in Coupler.io, adds a scheduled JSON output, and builds a web app that reads from it once you paste one link back. The result is a published dashboard that refreshes itself every day, with no manual exports.
I’ll walk you through the steps, share the exact prompt I used, and explain why each part of it matters.
Why build dashboards this way
For Lovable lovers, or anyone who’d rather vibecode a dashboard than configure a BI tool, this setup gives you:
- Live data. Coupler.io refreshes the JSON output on schedule, so the dashboard updates itself.
- Quick load. The app reads one prepared dataset instead of querying each ad platform, so it opens in seconds.
- Any change is one sentence in chat. A new chart, metric, or color scheme is a prompt, not a ticket to the data team.
- Blend as much data as you need. Combine ads, CRM, ecommerce, and analytics sources in one dataflow.
- Create any metric, and Coupler.io calculates it. Describe it (blended CAC, ROAS per channel), and Coupler.io computes it in the dataset before the dashboard displays it.


Track blended metrics in Lovable with Coupler.io
Start for freeWhat you need
Three things, all of which take a couple of minutes to set up:
- A Coupler.io account with your data sources connected (for this example, Google Ads and Meta Ads). You don’t need to build the dataflow in advance: Lovable creates it for you through the MCP server.
- A Lovable account. Custom MCP servers work on all Lovable plans.
- The Coupler.io MCP server URL:
https://mcp.coupler.io/mcp. It’s a hosted endpoint with OAuth sign-in, so there’s nothing to install or run locally.
Step 1. Connect Coupler.io MCP to Lovable (1 minute)
In Lovable, the Coupler.io MCP server works as a chat connector. It lets Lovable read and work with your Coupler.io data while it builds.
- Open Connectors in Lovable (sidebar, or the + menu next to the prompt box).
- Click Add custom and choose MCP server.
- Name it
Coupler.ioand paste the server URL:https://mcp.coupler.io/mcp. - Choose OAuth as the authentication method.
- Click Add & authorize, sign in to Coupler.io in the window that opens, and approve access.
Coupler.io now shows up in your list of chat connectors. To check it works, ask Lovable something simple, like “Using the Coupler.io connector, list my data sources.”
Step 2. Write one prompt for the data and the dashboard (1 minute)
Start a new Lovable project. The prompt has two jobs: tell Lovable how to set up the data in Coupler.io, then what the dashboard should show. Here’s the data part of the prompt I used:
Build a live weekly ads dashboard for Google Ads + Meta Ads, past 180 days, using my Coupler.io connector.

Data setup (do this first, in Coupler.io):
- Create ONE dataflow "Ads – Google + Meta weekly" with two sources:
  Google Ads and Meta Ads, both campaign performance, last 180 days → today.
- Blend them into one dataset with shared columns: date, platform (Google/Meta), campaign, spend, impressions, clicks, reach.
- Add a JSON output for the blended dataset and schedule it daily at 9 am CET.

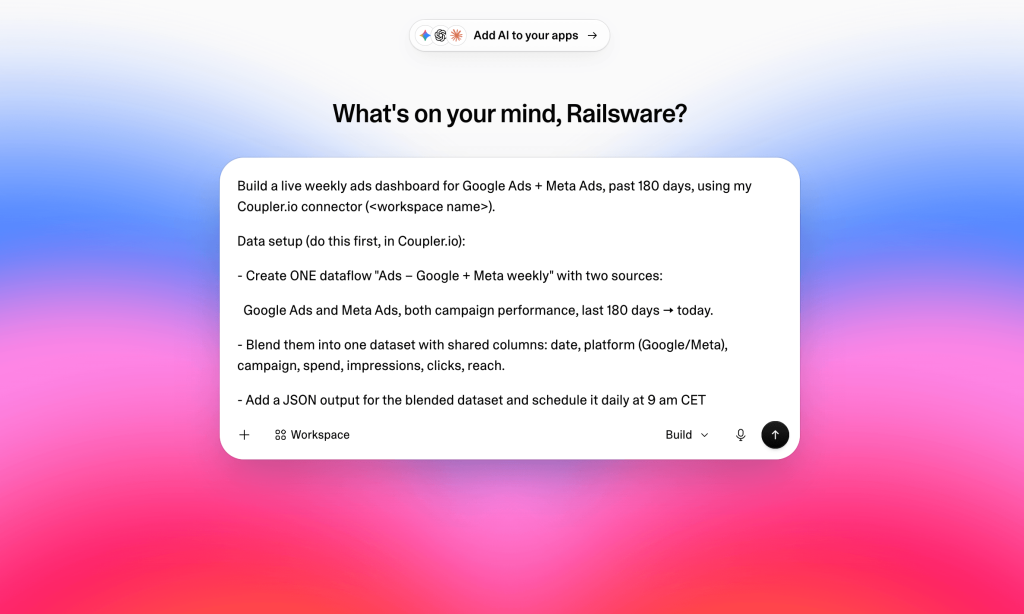
Each line of the data setup does a specific job:
- Name the connector. Lovable reaches for your real Coupler.io data instead of generating mock numbers.
- One dataflow, two sources. Google Ads and Meta Ads refresh together, so the two platforms never drift out of sync.
- One blended dataset with shared columns. A single schema lets the dashboard switch between Google, Meta, and combined views, and calculate CPM, CPC, and CTR from totals.
- A JSON output on a daily schedule. This is what makes the dashboard live. Lovable’s MCP connection only works while you build, and the published app can’t call it. The JSON output gives the app a URL to fetch, and the schedule refreshes the data every morning at 9 am CET.
After the data setup, describe the dashboard itself. For mine, I asked for CPM on top of the usual metrics, weekly granularity, tooltips that explain every number, and trends over time.
Step 3. Let the Coupler.io MCP server build the data pipeline (2–3 minutes)
You don’t set up anything in Coupler.io by hand. The Coupler.io MCP server works through the data setup in the order you gave it in the chat:
| Stage | What the Coupler.io MCP server does | MCP tools you’ll see |
|---|---|---|
| Discover | Finds your connected sources and reads the Google Ads and Meta Ads setup options | list-integrations, get-integration, get-integration-field-options |
| Build the dataflow | Creates “Ads – Google + Meta weekly” and adds both sources | create-dataflow, create-dataflow-source (×2) |
| Run | Pulls the past 180 days from both platforms | run-dataflow |
| Blend | Finds the raw datasets and creates one blended dataset with shared columns | list-datasets, create-dataset |
| Output and schedule | Adds the JSON destination and sets the daily 9 am CET refresh | create-dataflow-destination, update-dataflow |
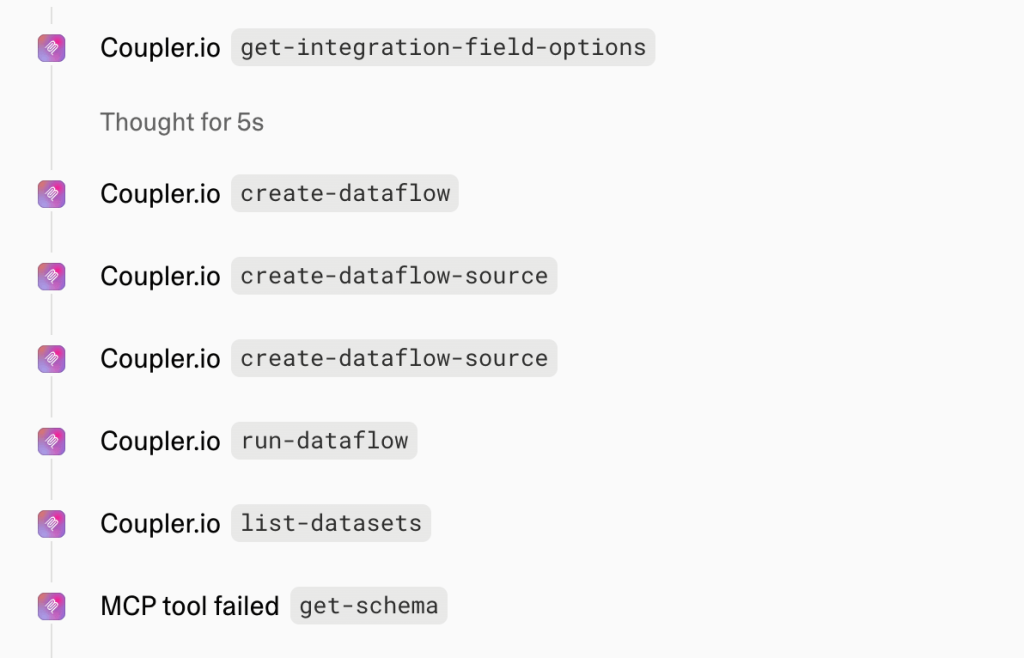
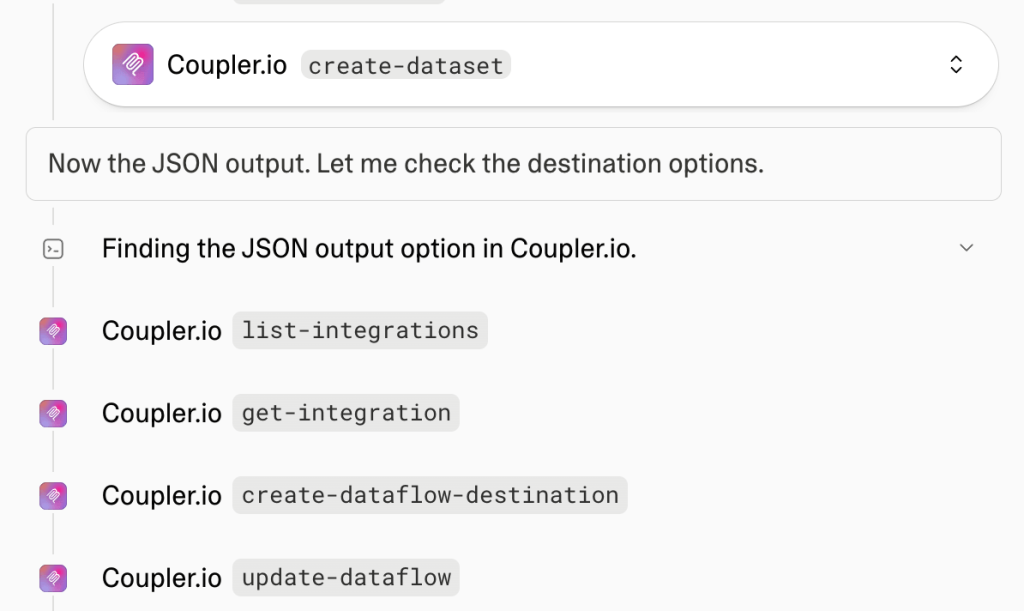
Lovable asks for your approval before running any tool that changes something, like creating or running a dataflow. Read-only lookups run without a prompt.
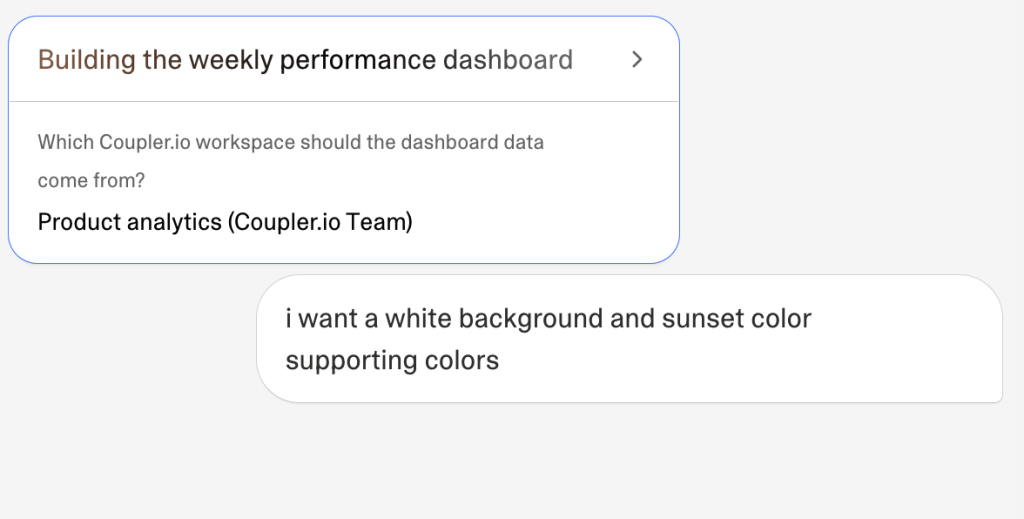
If you have more than one Coupler.io workspace, Lovable may ask which one to use. Pick it, and add design direction in the same reply if you have any. I asked for a white background with sunset accent colors.

Step 4. Generate the JSON link and add it to Lovable (1 minute)
This is the one step you do by hand. Lovable creates the JSON destination, but it stays incomplete until you generate its link in Coupler.io.
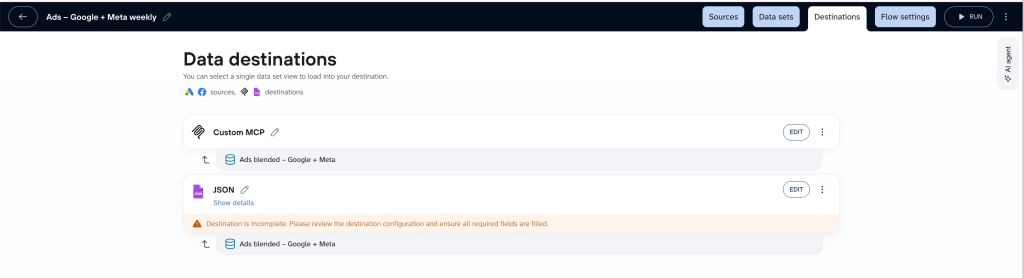
- In Coupler.io, open the new dataflow and go to the Destinations tab. The JSON destination shows a warning that it’s incomplete. If you can’t find the dataflow, ask Lovable for a direct link to it.

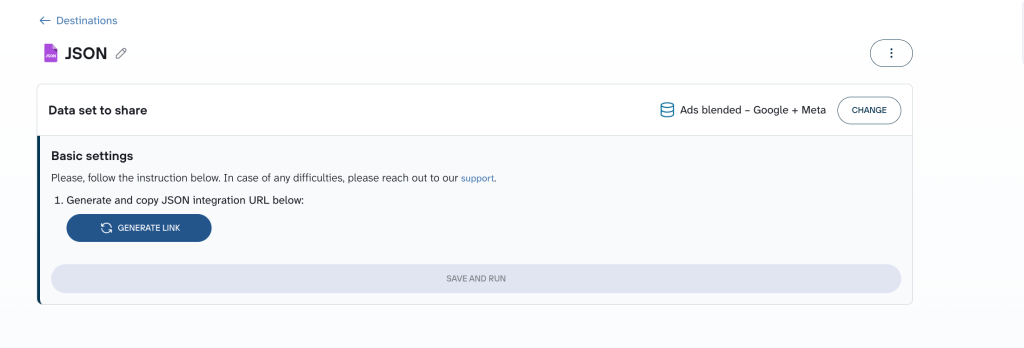
- Click Edit on the JSON destination, click Generate link, and copy the URL. Then click Save and run.

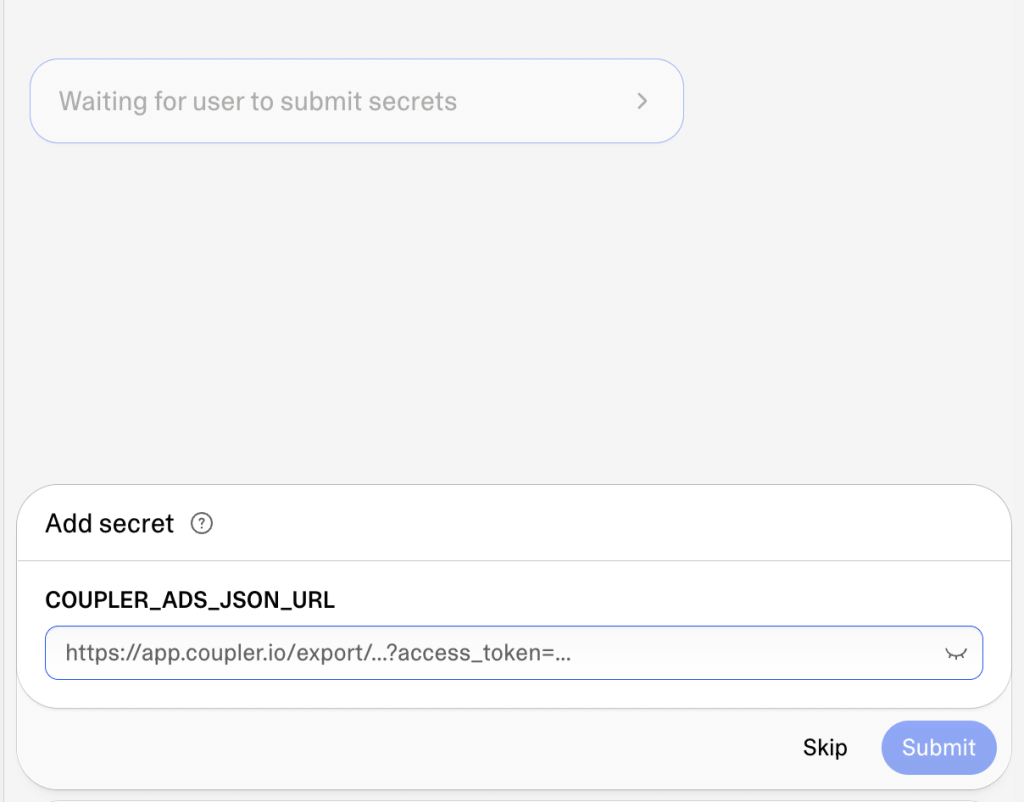
- Back in Lovable, the chat asks for a secret named
COUPLER_ADS_JSON_URL. Paste the link and click Submit. Lovable stores it as a secret, so the link never sits in the chat history or the app’s code.

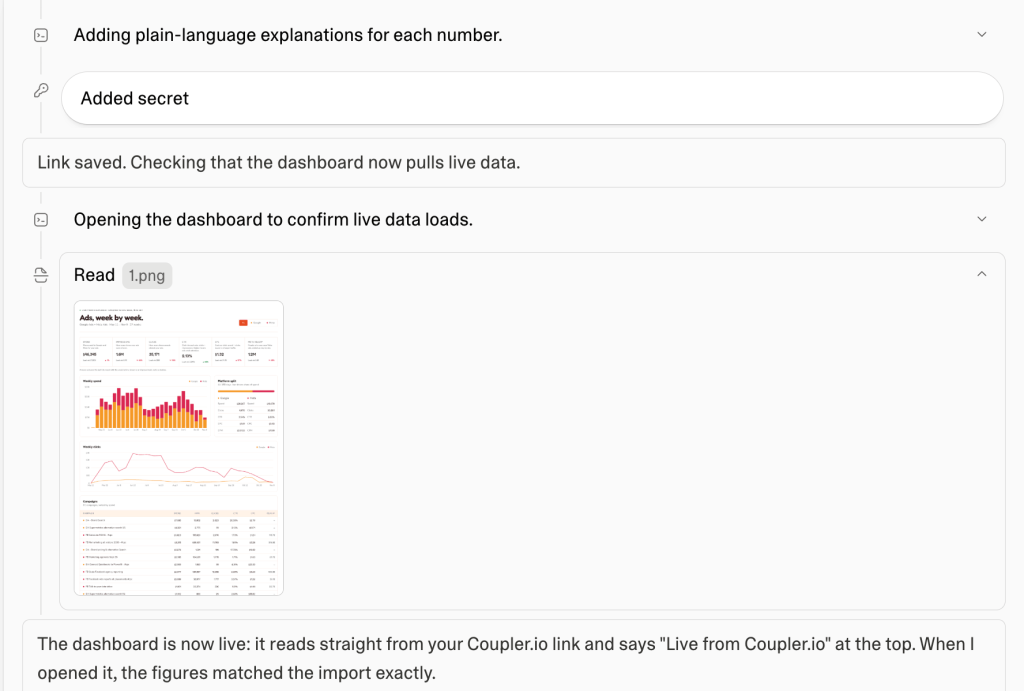
- Lovable opens the dashboard to confirm it loads live data and checks the figures against the import.

Step 5. Review and publish (1 minute)
What I got back was a working dashboard, not a mockup. Mine came back with:
- Six KPI cards: spend, CPM, CPC, CTR, impressions, and clicks, each with its week-over-week change.
- A weekly trend chart for any of those six metrics, covering the full 180 days.
- A source switcher: Google + Meta combined, Meta only, or Google only.
- Tooltips on every metric explaining what it means and how it’s calculated.
- A sync timestamp showing when the data was last pulled from Coupler.io.

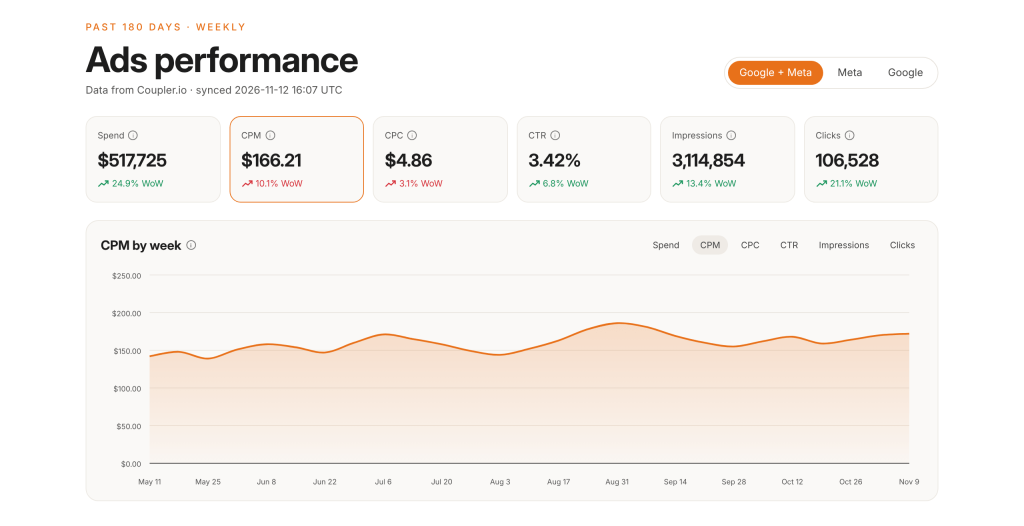
If something’s off, ask for changes in the chat, for example “Add a CPM comparison between Google and Meta” or “Show cost per conversion instead of clicks”.
You can change the design the same way: ask for your brand colors, a dark theme, or a different chart type, and Lovable restyles the dashboard in one prompt.
Bonus: the dashboard is mobile-friendly out of the box. For the workaholics among us, that means checking yesterday’s CPM from the beach or between courses at dinner with friends. I won’t judge.

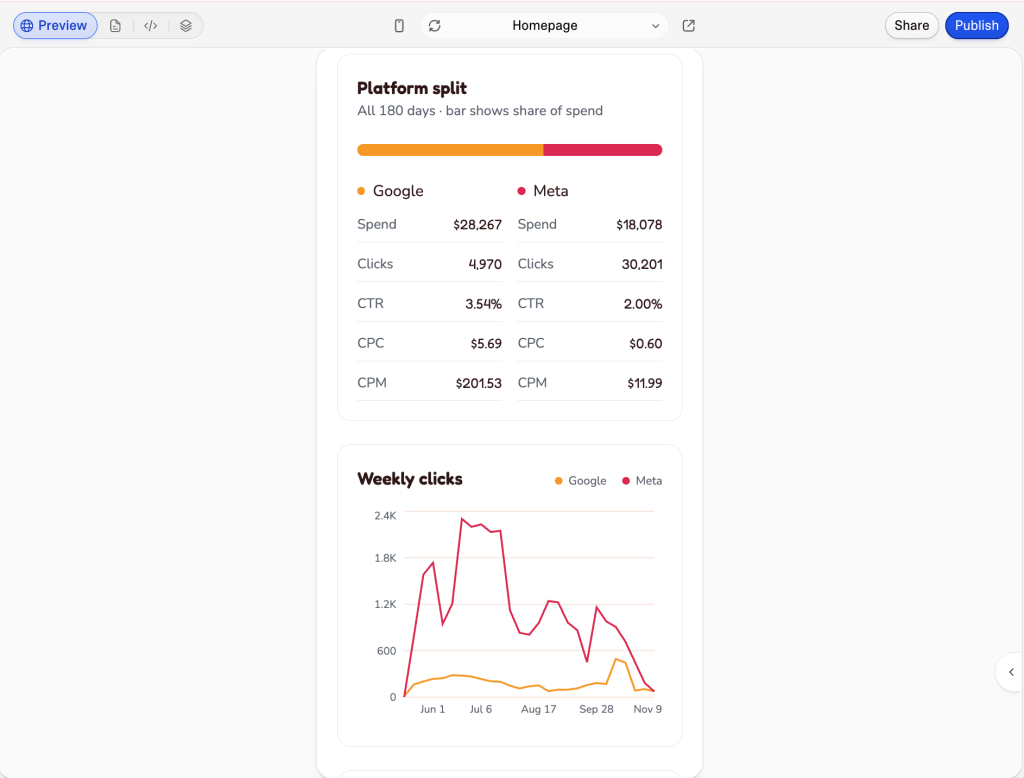
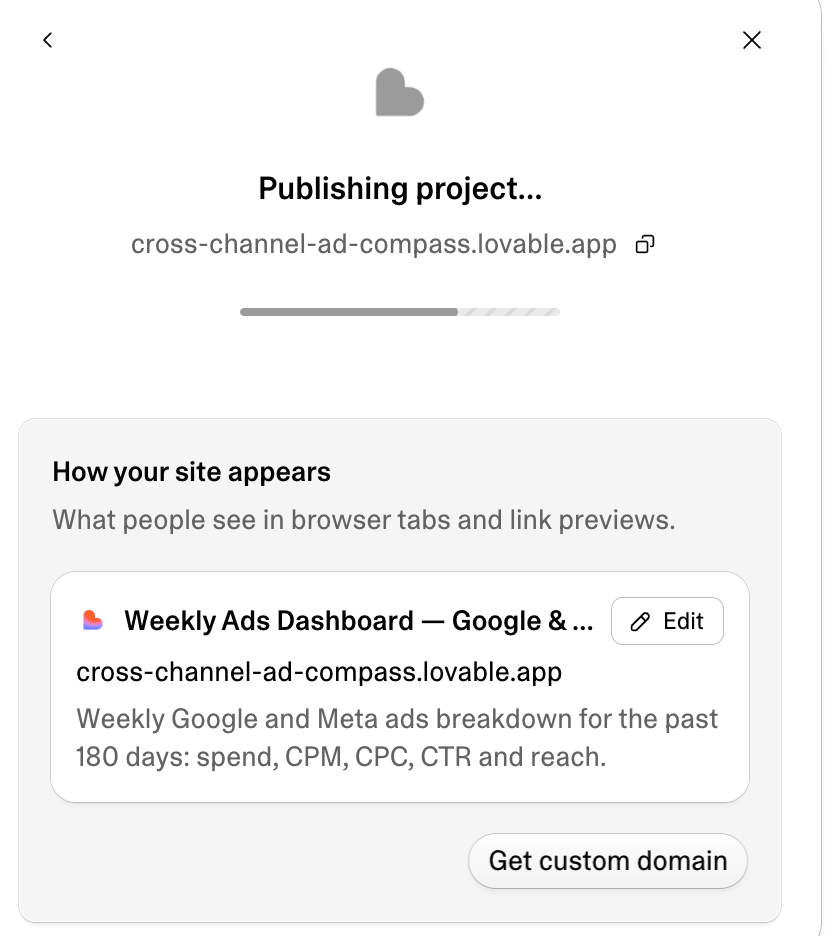
When you’re happy, click Publish. Lovable gives the app a live URL (mine was cross-channel-ad-compass.lovable.app) and lets you edit the title and description that appear in browser tabs and link previews. You can also connect a custom domain.

From here, the dashboard maintains itself. Coupler.io refreshes the JSON output every morning, the published app reads the new data on load, and the sync timestamp shows when it last updated. No one has to reopen Lovable to keep the numbers current.
Get a Lovable dashboard that updates itself daily
Try Coupler.io freeMore dashboards you can build the same way
The pattern stays the same for any data: one dataflow, one blended dataset, one scheduled JSON output, then the dashboard. Swap the sources, columns, and metrics, and Lovable builds a different dashboard on the same Coupler.io connection. Prompts to start with:
E-commerce sales
Build a live daily e-commerce dashboard for Shopify, past 90 days, using my Coupler.io connector.

Data setup (do this first, in Coupler.io):
- Create ONE dataflow "Shopify – sales daily" with Shopify orders as the source, last 90 days → today.
- Keep these columns: date, order ID, revenue, customer type (new/returning).
- Add a JSON output for the dataset and schedule it daily at 9 am CET.

Dashboard:
- Daily revenue, orders, AOV, and returning-customer share.
- Add tooltips that explain every number.
Blended ROAS
Build a live weekly ROAS dashboard for Shopify, Google Ads, Meta Ads, TikTok Ads, and Pinterest Ads, past 6 months, using my Coupler.io connector.

Data setup (do this first, in Coupler.io):
- Create ONE dataflow "ROAS – all channels weekly" with Shopify, Google Ads, Meta Ads, TikTok Ads, and Pinterest Ads as sources, last 6 months → today.
- Blend them into one dataset with shared columns: date, channel, spend, impressions, revenue.
- Add a JSON output for the blended dataset and schedule it daily at 9 am CET.

Dashboard:
- Weekly ROAS and CPM per channel, plus a combined view.
- Add tooltips that explain every number.
SEO performance
Build a live SEO dashboard for Google Search Console and GA4, past 3 months, using my Coupler.io connector.

Data setup (do this first, in Coupler.io):
- Create ONE dataflow "SEO – GSC + GA4" with Google Search Console and GA4 as sources, last 3 months → today.
- Blend them on landing page into one dataset with shared columns: date, landing page, clicks, impressions, sessions, conversions.
- Add a JSON output for the blended dataset and schedule it daily at 9 am CET.

Dashboard:
- Top landing pages by clicks, CTR, and conversions, with a weekly trend.
- Add tooltips that explain every number.
Finance overview
Build a live finance dashboard from QuickBooks, this year by month, using my Coupler.io connector.

Data setup (do this first, in Coupler.io):
- Create ONE dataflow "Finance – P&L monthly" with the QuickBooks P&L report as the source, this year by month.
- Keep these columns: month, revenue, expenses, net income.
- Add a JSON output for the dataset and schedule it weekly on Monday at 9 am CET.

Dashboard:
- Revenue, expenses, and margin trend by month.
- Add tooltips that explain every number.
The more specific the prompt, the fewer follow-up edits you’ll need. Name the columns you want in the dataset and match the refresh schedule to how often the people who use the dashboard check it.
Connect Coupler.io once, write one prompt that covers the data setup and the dashboard, approve the steps, paste one link, and publish. That’s five minutes from idea to a shareable URL that refreshes itself every morning. When the next request comes in, you change the prompt, not the pipeline.
Turn data from 400+ apps into reports and AI answers
Get started with Coupler.ioTips and FAQ on building a Lovable dashboard
Compare one or two KPIs against the native ad platform for the same period. Differences usually come from time zones, currency, or attribution windows, and you can ask Lovable to fix them in one prompt.
Watch out for averaged ratios
CPM, CPC, and CTR should be calculated from totals (total spend ÷ total impressions × 1,000), not averaged across weeks or campaigns. If a number looks odd, ask Lovable how it’s calculated.
Mind who can see it
Anyone with the link can open a published Lovable app, so if the dashboard shows spend or revenue, ask Lovable to add a login. The JSON link also carries an access token, so keep it in Lovable’s secrets and never paste it into public pages or repos.
Do I need to create a dataflow in Coupler.io first?
No. The data setup part of the prompt has Lovable create the dataflow, the blend, and the JSON output through the MCP server. If you already have a dataflow you trust, tell Lovable to add a JSON output to it by name.
Why not just use the MCP connection in the app?
Lovable’s MCP connection gives it context while you build. The published app can’t call it, so without the JSON output the dashboard would show a frozen snapshot.
How fresh is the data in your Lovable dashboard?
As fresh as the schedule. Daily at 9 am works for most marketing dashboards; pick a more frequent schedule if the team watches spend during the day and your Coupler.io plan supports it.
Which data sources work?
Any source Coupler.io connects to, including ad platforms, CRMs, ecommerce, analytics, finance tools, and databases.
Does Coupler.io work with other AI builders?
Yes. The same MCP server URL works in any MCP client that supports remote servers, such as Claude, Cursor, or VS Code.