Summarize this blog post with:

You’ve just spent 20+ minutes exporting campaign data from Google Ads, only to realize the Facebook Ads numbers don’t match your CRM’s attribution model. Again. By the time you manually reconcile everything in a spreadsheet, the data is already outdated—and your team is making decisions based on yesterday’s metrics.
Campaigns span more platforms—from social media and PPC to email automation and web analytics. Data becomes scattered across tools that don’t communicate with each other. The result: fragmented dashboards, conflicting reports, and hours wasted on manual exports instead of actual analysis.
Marketing data connectors solve this by automating the flow of data from your sources into the tools you already use for reporting and analysis. It can be Google Sheets for quick client reports, BigQuery for centralized data warehousing, Looker Studio for interactive dashboards, or even AI tools for conversational analytics. Instead of building custom integrations or chasing down CSV files, you get a single source of truth that updates automatically.
In this article, I introduce you to the top 5 data connectors for marketers. Examine their features, pricing, and ideal use cases to choose the right tool for your team’s reporting needs.
Types of data connectors for marketing platforms
Marketing data connectors fall into three categories based on who builds them and how they integrate with your tools. Understanding these differences helps you choose connectors that will remain stable and well-supported as your stack grows.
1. Native (first-party) connectors
Native connectors are built and supported by the same company that owns both platforms being connected. This makes them highly stable and easy to maintain, since both sides of the integration are managed under one ecosystem.

Examples:
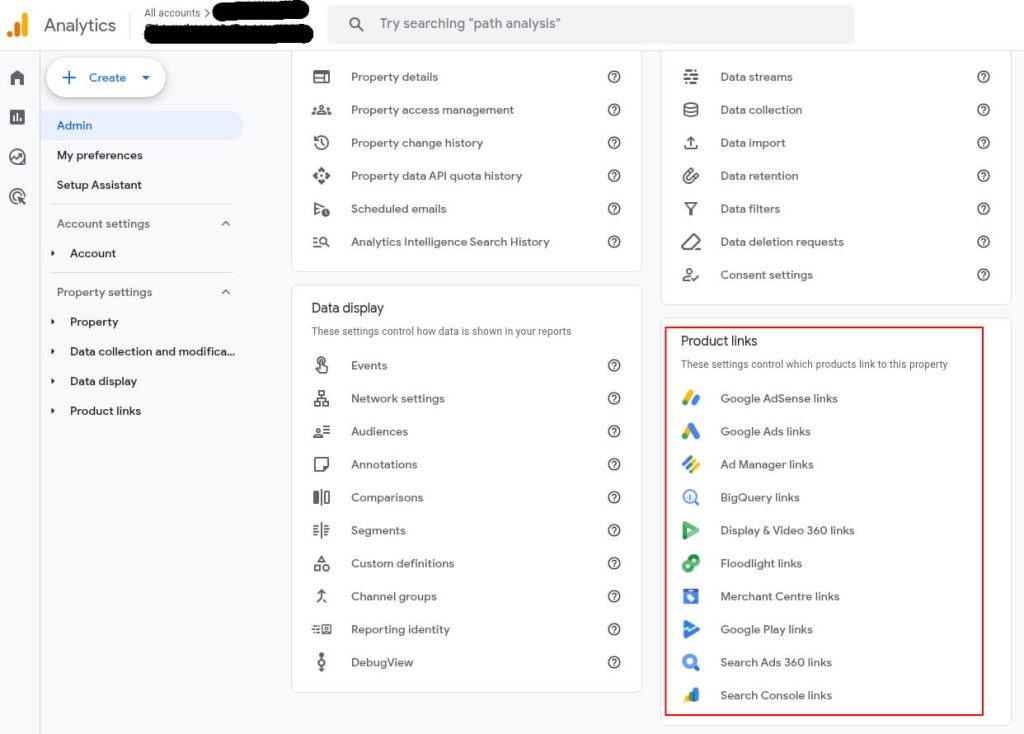
- Google Ads → Google Analytics (campaign tracking flows directly into conversion data)
- Salesforce CRM → Salesforce Marketing Cloud (engagement data syncs automatically with customer records)
- Salesforce → Slack (lead notifications appear instantly in team channels)
When to use them: Your marketing stack lives primarily within one ecosystem (Google Workspace, Salesforce, Microsoft, etc.) and you prioritize stability over flexibility.
Limitations: You’re locked into that vendor’s ecosystem. Connecting tools outside it requires different solutions.
2. Built-in connectors
These are the pre-built integrations provided by BI or analytics platforms to connect with external APIs. The BI tool vendor maintains these connectors, but they’re connecting to third-party services.

Examples:
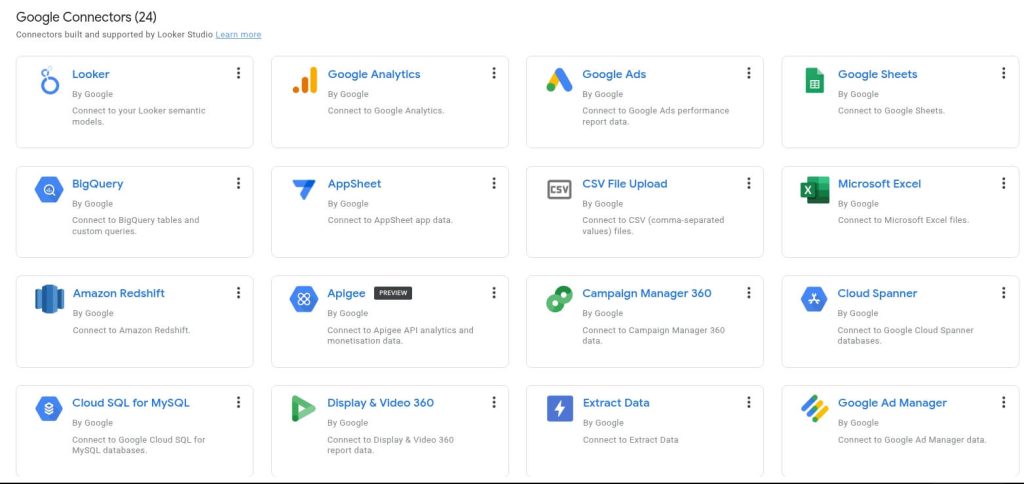
- Looker Studio includes connectors for Google Ads and GA4
- Power BI offers connectors for Salesforce, Google Analytics, and various databases
- Tableau provides pre-built connections to major marketing platforms
When to use them: You already have a BI tool and need to report on a handful of common data sources. They’re included in your existing license, so there’s no additional cost.
Limitations: Coverage is limited to popular platforms. If you need data from TikTok Ads, Mailchimp, or niche tools, built-in connectors often don’t exist. Updates depend on the BI vendor’s priorities, not your needs.
3. Third-party connectors
Third-party connectors are integration platforms built by independent vendors specifically to bridge gaps between tools that don’t natively connect. They specialize in data movement and transformation.
Examples:
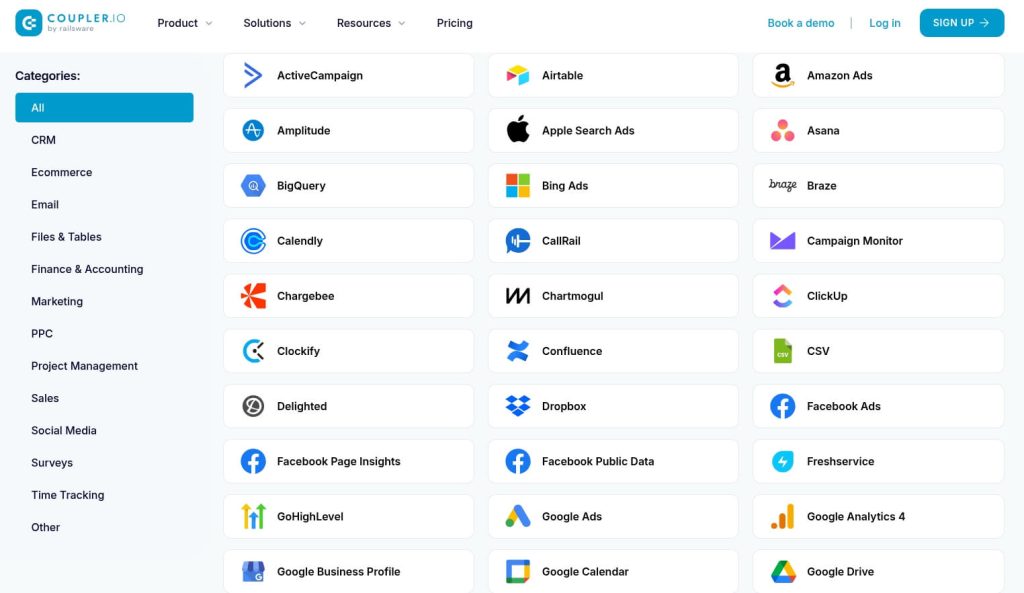
- Coupler.io connects 300+ sources (Google Ads, Shopify, GA4, HubSpot) to destinations like spreadsheet apps, BI tools, DWH, and AI tools
- Fivetran and Stitch focus on warehouse-first integrations
- Zapier and Make handle workflow automation across apps

When to use them: You manage campaigns across multiple platforms (ads, social, CRM, e-commerce) and need a centralized view. You need automation, scheduling, or data transformation capabilities that built-in connectors don’t provide.
Limitations: Additional cost per connection or data volume. You’re dependent on a third vendor’s maintenance and API relationship with your source platforms.
For most marketing teams managing diverse tech stacks, third-party connectors offer the flexibility and coverage needed for comprehensive reporting. Here is our selection of the top 5 data connectors for marketing platforms:
| Tool | Ideal use case | Starting price | Key sources | Key destinations | Standout feature |
| Coupler.io | Multi-channel marketing reporting with automation needs | $24/month | 300+ including Google Ads, Meta Ads, LinkedIn, TikTok, GA4, HubSpot, Shopify | Google Sheets, Excel, BigQuery, Looker Studio, Power BI, ChatGPT, Claude | AI integrations, predesigned dashboard and data set templates |
| PowerMyAnalytics | Small teams running Google-centric campaigns | $14.95/month | Google Ads, Meta Ads, Bing Ads, GA4, Facebook Insights | Google Sheets, Excel, Looker Studio | Affordable entry point for basic dashboards |
| Rivery | Enterprises with dedicated data engineering teams | Contact sales | 200+ SaaS apps, databases, marketing APIs | BigQuery, Redshift, Snowflake, Azure, Databricks | Advanced ELT pipelines with reverse ETL |
| Portermetrics | Agencies managing multiple client ad accounts on a budget | $12.50/month per account | Google Ads, Facebook Ads, LinkedIn Ads, TikTok Ads | Google Sheets, Looker Studio | Pre-built dashboard templates |
| Windsor.ai | Performance marketers focused on attribution and ROI tracking | $19/month | 325+ sources including all major ad platforms, CRMs, e-commerce | Sheets, Looker Studio, Power BI, Tableau, BigQuery | Multi-touch attribution modeling |
Top 5 marketing data connectors
1. Coupler.io: The all-in-one data connector for business
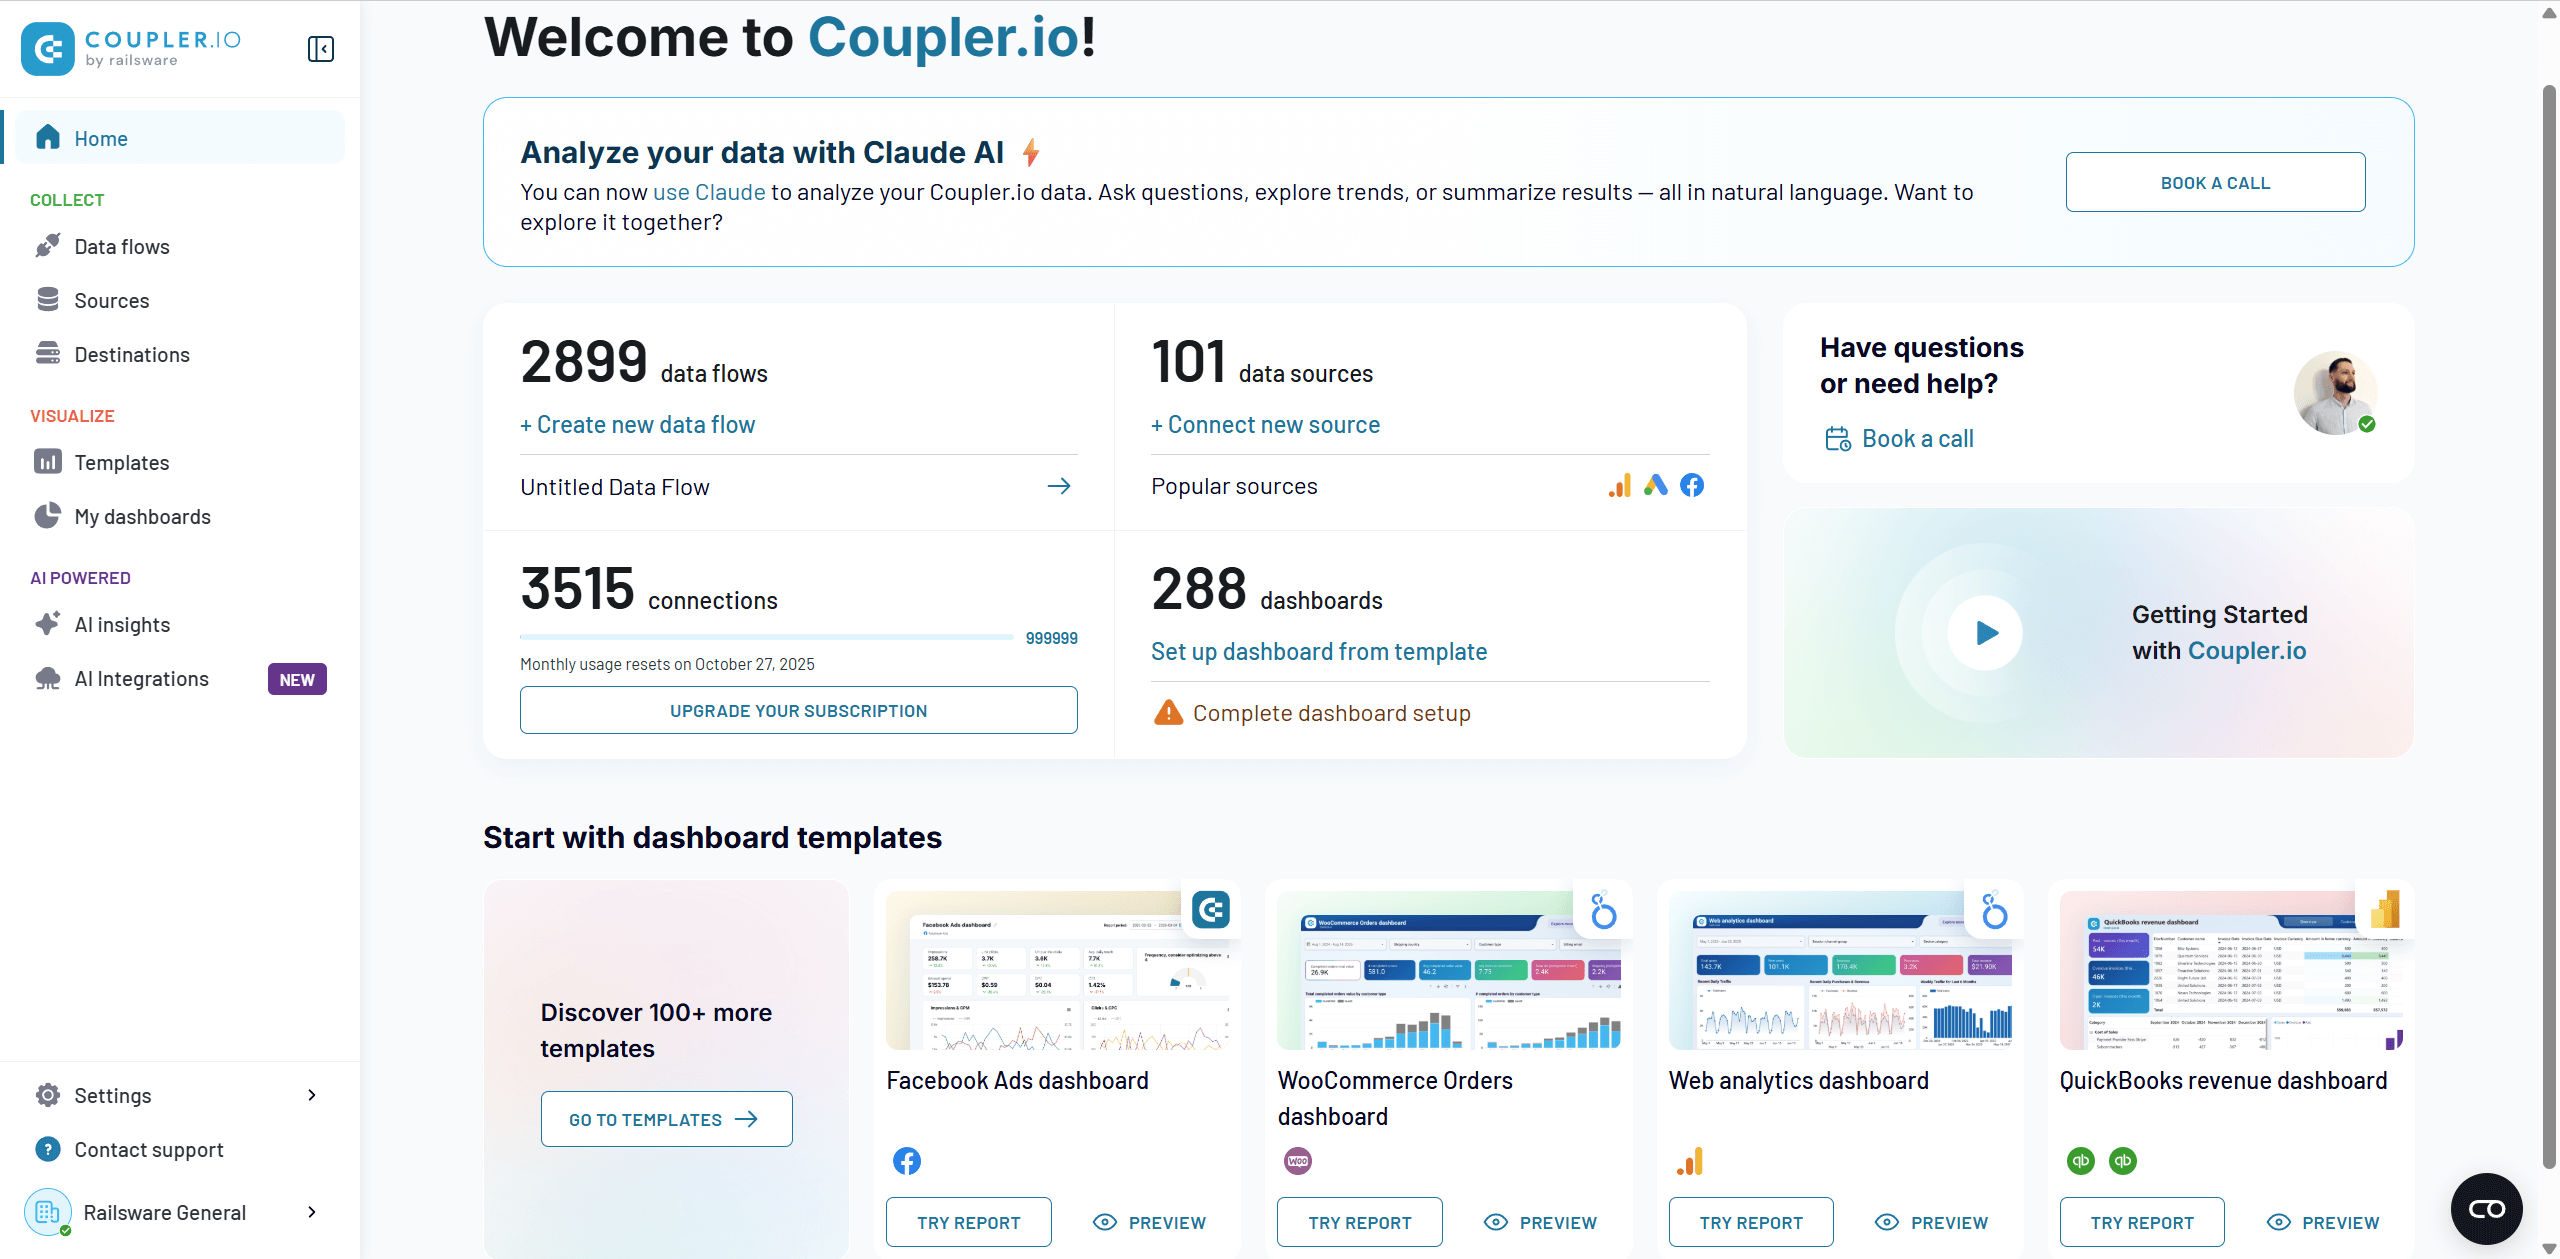
Coupler.io is an all-in-one data integration and AI analytics platform built for marketing teams who need to centralize reporting across multiple channels without writing code or managing APIs. It connects over 100 marketing data sources from ad platforms (Google Ads, Meta, LinkedIn, TikTok) to analytics tools (GA4, Google Search Console). At the same time, the total number of connectors is over 300 business sources, including CRMs (HubSpot, Pipedrive), e-commerce platforms (Shopify, WooCommerce), accounting software (QuickBooks, Xero), and more.
What sets Coupler.io apart from the rest of the data connectors for marketers is its destination flexibility. While most connectors focus solely on dashboards or warehouses, Coupler.io supports both traditional BI workflows and emerging AI-powered analytics.
Where your data can go:
- Spreadsheets (Google Sheets, Excel) for quick client reports and ad-hoc analysis.
- BI tools (Looker Studio, Power BI, Tableau) for interactive dashboards.
- Data warehouses (BigQuery, Redshift, PostgreSQL) for centralized storage and modeling.
- AI platforms (ChatGPT, Claude, Perplexity) for conversational analytics.
This means a small team can start with weekly Google Sheets reports, scale to live Looker Studio dashboards as they grow, and eventually layer in AI-powered insights—all using the same connector.

What you get with Coupler.io:
- Automated scheduling: Set data refreshes from every 15 minutes to weekly, eliminating manual exports and ensuring dashboards stay current.
- Pre-built templates: Access 150+ ready-to-use dashboard templates for PPC, SEO, e-commerce, and finance reporting. Connect your accounts and start analyzing immediately.
- AI-powered insights: The AI Insights feature detects trends, flags anomalies, and suggests optimizations automatically on your dashboards. The AI integrations enable conversational analytics—ask questions about your data in natural language through ChatGPT or Claude.
- Data transformation: Union data from multiple sources, apply filters, create custom calculations, and aggregate metrics without writing SQL.
Best for:
- Marketing agencies managing multiple clients across different ad platforms that need standardized reporting
- E-commerce brands tracking performance across ads, web analytics, and sales platforms in one place
- Growing teams who want to start simple but need room to scale into warehousing and AI analytics
- Non-technical marketers who need powerful automation without coding or API management
Not ideal for:
- Enterprises with existing data engineering teams who’ve already built custom pipelines
- Users who need only one-time data exports rather than ongoing automation
Pricing:
| Free | Personal | Professional | Team | Business |
| $0 | $24/mo | $99/mo | $199/mo | $449/mo |
| 1 connection, 1 user | 5 connections, 1 user | 25 connections, 5 users | 100 connections, 10 users | 400 connections, unlimited users |
| Manual refresh | Unlimited sources & destinations, daily refresh | Unlimited sources & destinations, AI Insights | Hourly refresh, AI Insights, account manager | 15-min refresh, AI Insights, account manager |
Connect your marketing data sources with Coupler.io
Get started for free2. PowerMyAnalytics: good for basic reporting needs
PowerMyAnalytics is a lightweight data connector designed for small businesses and agencies running campaigns primarily within the Google ecosystem. It automates data flow from core marketing platforms—Google Ads, Meta Ads, Bing Ads, GA4, and Facebook Insights—directly into Google Sheets, Excel, or Looker Studio.
The tool strips away complexity in favor of speed and affordability. Setup requires no technical knowledge, and prebuilt connectors get you from installation to your first automated report in minutes. For teams that don’t need advanced transformations or wide platform coverage, PowerMyAnalytics delivers the essentials without the overhead.

What you get with PowerMyAnalytics:
- Automated data refreshes: Schedule daily syncs to keep your spreadsheets and dashboards current without manual CSV exports.
- Prebuilt connectors for major platforms: Quick-setup integrations for the most common ad and analytics sources used by small marketing teams.
- Guided onboarding: Support resources and templates designed for non-technical users who need to get reporting up and running fast.
Best for:
- Small marketing teams with limited budgets running campaigns on 3-5 platforms maximum
- Agencies focused on Google Ads and Meta who primarily use Looker Studio for client reporting
- Teams without technical resources who need plug-and-play solutions rather than customizable pipelines
Not ideal for:
- Multi-channel marketers who need to integrate CRM data, e-commerce platforms, or niche ad networks
- Teams planning to scale beyond basic dashboards into data warehousing or advanced analytics
- Organizations requiring hourly data refreshes or complex data transformations
Pricing
| Single | Business | Pro | Enterprise | Add-ons |
| $14.95/mo | $39.95/mo | $99.95/mo | $295/mo | $49.95/mo |
| 1 source, 1 account | 5 sources, 2 admins | 10 sources, 20 accounts | Unlimited sources, hourly refresh | Spreadsheets, Exports, Hourly refresh |
| Data warehousing | Guided onboarding | Includes exports & spreadsheets | Dedicated rep, end-to-end onboarding | Add-on pricing per feature |
Bottom line: Solid entry point for small teams with straightforward reporting needs, but you’ll outgrow it as your stack diversifies.
Coupler.io vs PowerMyAnalytics
| Feature | Coupler.io | PowerMyAnalytics |
| Free trial | ✅ Yes (7-day) | ✅ Yes (14-day) |
| Free plan | ✅ Yes | ❌ No |
| Sources included in all plans | 300+ (Google Ads, Meta Ads, LinkedIn, TikTok, HubSpot, Shopify, GA4) | Prebuilt ad/analytics (Google Ads, Meta Ads, Bing, GA4, Facebook Insights) |
| Data union (multi-source join) | ✅ Yes | ❌ No |
| Data transformation | Filters, sorting, custom calculations, aggregation, unification | Basic field mapping only |
| Prebuilt templates | 150+ | 10 |
| Data destinations | Spreadsheets, BI and data visualization tools, data warehouses, and AI tools | Spreadsheets, BI, and analytics tools |
| Min. refresh frequency | Every 15 min | Hourly |
| AI capabilities | AI integrations AI Insights | ❌ None |
| Pricing starts at | $24/month | $14.95/month |
3. Rivery: enterprise-grade data pipelines
Rivery is an enterprise-grade ELT (Extract, Load, Transform) platform built for companies with dedicated data teams managing large-scale, multi-source data operations. It supports over 200 connectors spanning marketing platforms, SaaS applications, databases, and business systems.
Unlike marketing-focused connectors, Rivery is designed for data engineering workflows. It excels at building automated pipelines that extract data from diverse sources, load it into centralized warehouses (Snowflake, BigQuery, Redshift, Azure, Databricks), and apply complex transformations before delivering insights to BI teams.

What you get with Rivery:
- Advanced ELT pipelines: Build multi-step workflows with conditional logic, error handling, and orchestration across dozens of sources.
- Reverse ETL and CDC: Push transformed data back into operational systems and capture real-time database changes for instant updates.
- Enterprise-grade performance: Supports high-frequency syncing (down to 5-minute intervals) and handles massive data volumes without degradation.
Best for:
- Large enterprises with BI or data engineering teams who manage complex data infrastructure
- Organizations consolidating data from marketing, sales, finance, and operations into a single warehouse
- Teams building custom data models that require transformation logic beyond what marketing connectors provide
Not ideal for:
- Marketing teams without dedicated data engineering support—the learning curve is steep
- Small businesses looking for quick dashboard solutions rather than enterprise data architecture
- Teams with simple reporting needs that don’t justify the cost and complexity
Pricing
| Base | Professional | Pro Plus | Enterprise |
| Contact Sales | Contact Sales | Contact Sales | Contact Sales |
| 2 users, 200+ sources | Unlimited users, 200+ sources | Unlimited users, Reverse ETL | Unlimited users, custom connectors |
| 60-min sync | 15-min sync | 15-min sync | 5-min sync, enterprise onboarding |
Bottom line: The right tool for enterprise data operations, but massive overkill if you just need marketing dashboards.
Coupler.io vs Rivery
| Feature | Coupler.io | Rivery |
| Free trial | ✅ Yes (7-day) | ✅ Yes (14-day) |
| Free plan | ✅ Yes | ❌ No |
| Sources included in all plans | 300+ (ads, social, ecommerce, CRM, analytics) | 200+ (marketing APIs, SaaS apps, databases) |
| Data union (multi-source join) | ✅ Yes | ✅ Yes |
| Data transformation | No-code filters, calculations, aggregation, unification | Advanced ELT transformations |
| Prebuilt templates | 150+ | Data kits not regular templates |
| Data destinations | Spreadsheets, BI and data visualization tools, data warehouses, and AI tools | Data warehouses and databases |
| Min. refresh frequency | Every 15 min | Hourly (via orchestration) |
| AI capabilities | AI Insights AI integrations | AI data pipeline |
| Pricing starts at | $24/month | Usage-based (higher for small teams) |
4. Portermetrics: affordable connectors for small teams
Portermetrics is a no-frills connector targeting startups and agencies who need quick, low-cost reporting from major ad platforms. It covers Google Ads, Facebook Ads, TikTok Ads, and LinkedIn Ads, sending data directly into Google Sheets or Looker Studio.
What makes Portermetrics appealing is its simplicity and pricing structure. Instead of paying per connection or data volume, you pay per advertising account. For agencies managing multiple client ad accounts, this can be significantly more affordable than competitors—especially when you’re just starting out.
The tool also includes 30+ prebuilt Looker Studio templates, so you can deliver professional-looking client dashboards without building them from scratch.

What you get with Portermetrics:
- Ad platform focus: Prebuilt connectors for the four most common paid advertising channels used by agencies.
- Account-based pricing: Pay only for the ad accounts you connect, making it predictable and budget-friendly for small agencies.
- Ready-to-use Looker Studio templates: Get client-ready dashboards running in minutes without design or configuration work.
Best for:
- New agencies managing ad campaigns for 5-10 clients who need affordable, standardized reporting
- Startups with tight budgets who can’t justify $100+/month for broader connector platforms
- Teams that only run paid ads and don’t need CRM, e-commerce, or analytics integration
Not ideal for:
- Agencies scaling beyond basic ad reporting into multi-channel attribution or customer journey tracking
- Teams needing data transformations, unions, or advanced analytics capabilities
- Organizations requiring hourly data refreshes (Portermetrics updates daily)
Pricing
| Free | Paid | Add-on (Data Blending) |
| $0 | $12.5/mo/account | $83/mo |
| 3 accounts | Flexible accounts | Data blending |
| All sources, daily refresh | Unlimited users, reports & history |
Bottom line: Great for getting started cheaply, but limited growth potential as your needs expand.
Coupler.io vs Portermetrics
| Feature | Coupler.io | Portermetrics |
| Free trial | ✅ Yes (7-day) | ✅ Yes (14-day) |
| Free plan | ✅ Yes | ❌ No |
| Sources included in all plans | 300+ (ads, CRM, ecommerce, analytics, SaaS apps) | Core ad platforms (Google Ads, Facebook Ads, LinkedIn, TikTok) |
| Data union (multi-source join) | ✅ Yes | ❌ No |
| Data transformation | Filters, calculations, aggregation, unification | Limited |
| Prebuilt templates | 150+ | 30+ |
| Data destinations | Spreadsheets, BI and data visualization tools, data warehouses, and AI tools | Spreadsheets and BI tools |
| Min. refresh frequency | Every 15 min | Daily refresh |
| AI capabilities | AI Insights AI integrations | ❌ None |
| Pricing starts at | $24/month | $12.5/month |
5. Windsor.ai: attribution-focused connector
Unlike other data connectors for marketing platforms, Windsor.ai is built around attribution modeling and revenue tracking. It supports over 325 sources, including all major ad platforms, CRMs like Salesforce and HubSpot, and e-commerce systems like Shopify—with a focus on connecting ad spend to actual business outcomes.
The platform’s core strength is multi-touch attribution. Instead of just pulling campaign metrics into dashboards, Windsor.ai helps you understand which touchpoints in the customer journey actually drive conversions and revenue. This makes it particularly valuable for performance marketers, agencies proving ROI to clients, and e-commerce brands optimizing customer acquisition costs.
Data flows into spreadsheets, BI tools (Looker Studio, Power BI, Tableau), or data warehouses like BigQuery for deeper analysis.

What you get with Windsor.ai:
- Multi-touch attribution modeling: Track how different channels and campaigns contribute to conversions across the entire customer journey.
- Automated ETL with attribution layer: Move data while applying attribution logic, giving you revenue-mapped insights automatically.
- Standardized taxonomy across accounts: Normalize naming conventions and metrics across 1,900+ ad accounts for consistent reporting.
Best for:
- Performance marketing teams focused on proving ROI and optimizing customer acquisition costs
- E-commerce brands tracking the path from ad click to purchase across multiple channels
- Agencies managing large client portfolios who need to demonstrate campaign effectiveness with attribution data
Not ideal for:
- Teams with simple dashboard needs who don’t require attribution complexity
- Small businesses where setup effort outweighs the value of multi-touch attribution insights
- Organizations that only need basic data syncing without revenue tracking
Pricing
| Free | Basic | Standard | Plus | Professional | Enterprise |
| $0 | $19/mo | $99/mo | $249/mo | $499/mo | Custom |
| 1 user, 10 sources | Unlimited users, 3 sources | 7 sources, unlimited tasks | 10 sources, 200 accounts | 14 sources, 500 accounts | Up to 300 sources, 50k accounts |
| Daily sync | 75 accounts, daily sync | Daily/hourly sync | Daily/hourly sync | 15-min sync, SSO | Custom connectors, enterprise SLA |
Bottom line: Unmatched for attribution and ROI tracking, but adds complexity if you just need straightforward reporting.
Coupler.io vs Windsor.ai
| Feature | Coupler.io | Windsor.ai |
| Free trial | ✅ Yes (7-day) | ✅ Yes (30-day) |
| Free plan | ✅ Yes (1 connector) | ❌ No |
| Sources included in all plans | 300+ (ads, CRM, eCom, analytics) | 325+ (ads + CRM) |
| Data union (multi-source join) | ✅ Yes | ✅ Yes |
| Data transformation | Filters, calculations, aggregation, unification | Attribution-focused |
| Prebuilt templates | 150+ | 60+ |
| Data destinations | Spreadsheets, BI and data visualization tools, data warehouses, and AI tools | Spreadsheets, BI tools, and data warehouses |
| Min. refresh frequency | Every 15 min | Hourly |
| AI capabilities | AI Insights AI integrations | Attribution modeling |
| Pricing starts at | $24/month | $19/month |
Real results: How companies use marketing data connectors
The best way to understand which connector fits your needs is to see how real teams use them. Here are five examples showing different use cases, from small agencies to enterprise brands.
Digital agency accelerates client onboarding by 5–7x and improves tracking reliability to 95%+
Company: SellThru (GCC-based digital marketing agency)
Challenge
Onboarding new clients at SellThru was slow and inefficient, taking up to two weeks to set up trackers and consolidate historical data across multiple channels. With 250+ accounts under management, the team struggled to keep up, spending at least one hour per day on manual data mapping. Existing tools focused on visualization rather than true data integration, leading to errors and delays. The agency needed a solution that could unify multi-channel data, automate transformations, and ensure reliable, real-time reporting.
Marketing data connector:
SellThru evaluated several options, including Supermetrics, Porter, and Funnel, but chose Coupler.io for its competitive pricing, unlimited data sources and seats, and flexibility to handle complex agency reporting needs. With Coupler.io, they could fully automate onboarding, data mapping, and dashboard setup across clients.
Solution
Coupler.io integrated advertising, analytics, and GA4 data directly into Google Sheets and BI dashboards. Automated data flows eliminated manual mapping, while transformations unified performance metrics across platforms. Within days, SellThru had live dashboards ready for clients, reducing the pressure on account managers.
Results
- Reduced onboarding time from 2 weeks to 2–3 days (5–7x faster)
- Achieved 95%+ reliability in performance tracking
- Automated 35+ real-time dashboards across clients
- Saved 20+ hours/month and 1 hour/day of manual mapping work
Marketing agency reduces client reporting from days to 30 minutes
Company: Social Unit (UK marketing agency)
Challenge: Compiling social media and PPC reports across TikTok, Facebook, Instagram, and Google Ads took 2-3 days per client. Clients constantly requested updates, creating reactive work that pulled the team away from campaign optimization. This mirrors a wider industry issue: 44% of marketers say they struggle with fragmented data across multiple databases, which delays reporting and undermines trust in insights.
Marketing data connector: The agency needed no-code automation that could handle multi-channel reporting without requiring developer resources. Real-time dashboards would reduce client inquiries and improve transparency. They’ve chosen Coupler.io for its no-code setup and ability to automate multi-channel data flows.
Solution
Data from all ad platforms flowed automatically into Google Sheets and Looker Studio dashboards that refreshed throughout the day. Clients received live dashboard access instead of weekly PDF reports.
Results
- Reporting reduced from days to 30 minutes
- 60% fewer client inquiries thanks to transparent dashboards
- More time to optimize campaigns and reduce churn
Reducing manual ETL work with enterprise-grade pipelines
Company: Leading global apparel brand
Challenge
A leading apparel brand had fragmented data across e-commerce, POS, ad platforms, and CRM. BI teams spent huge amounts of time on manual ETL and API maintenance. With marketing stacks growing more complex, the team struggled to unify insights.
Statistics show that 85% of companies use more than 10 technologies in their stack, and over half lack the processes to manage integration. This is a common issue in this industry.
Marketing data connector:
The brand selected Rivery for its enterprise-grade approach to data integration. Its ability to connect 50+ sources, apply transformations, and standardize data into a central warehouse aligned with their need for scalability and reliability.
Solution
Rivery built automated ELT pipelines across all key marketing and business data sources. It applied transformations and standardized outputs, delivering unified data into the company’s warehouse for advanced analytics and reporting.
Results
- 70% reduction in manual data management
- Faster, more reliable insights across teams
- Scaled reporting without heavy engineering effort
This case study highlights Rivery’s strength in enterprise-grade data pipelines.
Standardizing 1,900 ad accounts with attribution automation
Company: Omnicom Media Group Hong Kong
Challenge
Omnicom Media Group Hong Kong managed 1,900 ad accounts across 11 platforms. Analysts spent ~40 hours/week exporting CSVs and fixing dashboards when APIs broke. Their goal was to achieve consistent campaign pacing insights across accounts without the manual overhead.
Marketing data connector:
They chose Windsor.ai for its attribution-first capabilities and automated ETL pipelines, which could unify multi-channel spend and performance data into a single system.
Solution
Windsor.ai integrated data from Amazon Ads, Meta, CRM platforms, and other channels into Google BigQuery. From there, the data was synced to Sheets and BI dashboards, with near real-time updates and a standardized taxonomy.
Results
- 40 hours/week saved
- Sub-2-hour latency for campaign pacing dashboards
- Standardized taxonomy across all 1,900 accounts
Highlights Windsor.ai’s strength in large-scale attribution and data centralization.
Affordable dashboards for small agencies and teams
Challenge
Many small agencies and startups need fast, affordable dashboards without the cost or complexity of enterprise-grade solutions. Their goal is to automate reporting from key ad platforms while staying within budget.
Solution
PowerMyAnalytics and Portermetrics offer budget-friendly connectors that focus on simple data automation for Google Sheets and Looker Studio. Both provide prebuilt connectors for major ad platforms and basic automation features that help smaller teams get started with reporting.
Results
- Quick setup for small teams
- Affordable entry-level pricing
- Limited scalability compared to larger platforms
Solid for basic reporting needs, but not designed for long-term growth.
- Coupler.io → Best overall: versatile, scalable, and ROI-driven across industries.
- Rivery → Best for enterprises with complex pipelines.
- Windsor.ai → Best for attribution and ROI tracking at scale.
- PowerMyAnalytics & Portermetrics → Best for small teams with simple dashboard needs.
How to choose the right marketing data connector
The right connector depends on three key factors: your current stack complexity, your team’s technical resources, and your growth trajectory. Here’s how to evaluate your options:
Step 1: Map your integration requirements
Start by answering these questions:
How many data sources do you need to connect?
- 1-3 platforms (e.g., just Google Ads, GA4, and Sheets) → Built-in BI connectors or budget tools may suffice
- 4-10 platforms spanning ads, CRM, and analytics → Third-party connectors become necessary
- 10+ sources including e-commerce, finance, and operations → You need a comprehensive platform
What destinations matter to your workflow?
- Spreadsheets only → Most tools handle this
- BI dashboards (Looker Studio, Power BI) → Look for native integrations
- Data warehouses → Ensure the tool supports your warehouse (BigQuery, Snowflake, etc.)
- AI analytics tools → Very few connectors support this; it’s a specialized capability
What’s your data refresh requirement?
- Daily updates → Most budget tools provide this
- Hourly updates → Mid-tier platforms required
- 15-minute or real-time → Enterprise-grade or specialized tools only
Step 2: Assess your team’s technical capacity
Non-technical marketing team with no data resources: You need no-code setup, prebuilt templates, and strong support. Avoid tools that require SQL knowledge or data modeling skills.
→ Consider: Coupler.io, PowerMyAnalytics, Portermetrics
Marketing team with light technical support (1-2 technical people): You can handle some configuration but need tools that don’t require constant maintenance or custom code.
→ Consider: Coupler.io, Windsor.ai
Dedicated data engineering or BI team: You can build and maintain complex pipelines, and you need advanced transformation and orchestration capabilities.
→ Consider: Rivery, Coupler.io (for marketing-specific workflows)
Step 3: Project your growth path
Starting small but planning to scale: Choose a tool that can grow with you. Avoid platforms that lock you into limited sources or force migration when you add complexity.
Red flags: Account-based pricing that explodes with scale, hard limits on sources/destinations, lack of data transformation features
Stable, established workflow: If your stack is set and you don’t expect major changes, optimize for cost and simplicity rather than future flexibility.
Rapidly changing or experimental: You need maximum flexibility to connect new platforms quickly as you test channels. Prioritize breadth of sources over depth of features.
Decision matrix: Match your situation to the right tool
| Your Situation | Top Choice | Why |
| Small agency, 3-5 ad platforms, tight budget | Portermetrics | Low cost, fast setup, adequate for basic dashboards |
| Marketing team, 5-10 sources, need automation | Coupler.io | Balances ease of use with growth capacity |
| E-commerce brand tracking ads + sales + web analytics | Coupler.io | Handles diverse data types and destinations |
| Performance team focused on attribution & ROI | Windsor.ai | Attribution modeling is built-in, not an afterthought |
| Enterprise with dedicated data team | Rivery | Built for complex pipelines and transformations |
| Agency managing 20+ clients across all major platforms | Coupler.io | Scales to hundreds of accounts without breaking the bank |
| Experimenting with AI-powered analytics | Coupler.io | Only major connector with AI destination support |
Red flags that signal you need to upgrade your connector:
- You’re manually exporting data because your connector doesn’t support a key platform
- Dashboards break when APIs change and you wait days for fixes
- You’ve hit account or source limits and pricing jumps dramatically
- Your team avoids adding new data sources because setup is too complex
- You can’t combine data from multiple platforms for unified reporting
If you’re experiencing any of these, you’ve outgrown your current tool.
Get started with Coupler.io for free and see how effortless data-driven reporting can be.
Explore over 300 data connectors under one roof with Coupler.io
Get started for free