What is a marketing data pipeline?
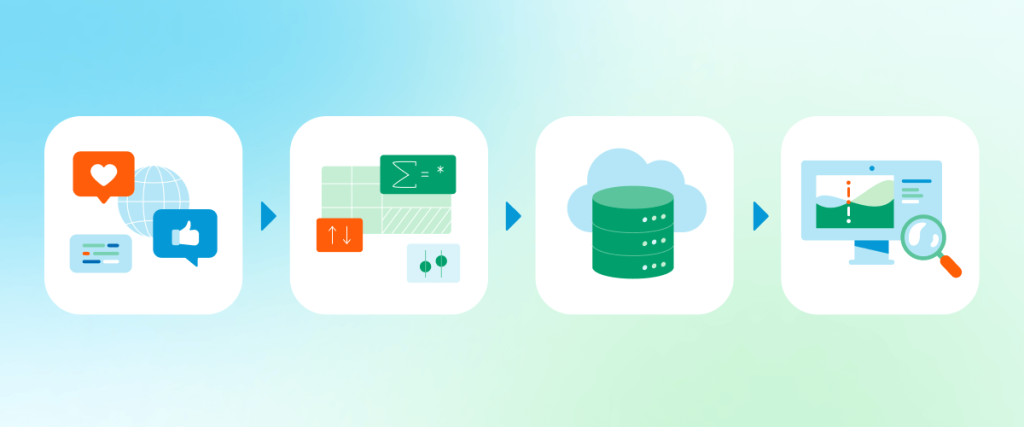
A data pipeline is the managed process of collecting, organizing, and transporting data from a source to a destination. In a marketing context, it typically involves:
- collecting data from various applications (Google Analytics 4, Meta Ads, and HubSpot)
- cleaning and structuring the data
- preserving it
- visualizing the information in a report
- acting on the insights it generates.
Why build a marketing data pipeline?
Marketing data pipelines provide a framework for turning raw data into analysis-ready reports. Their purpose is to streamline data operations and establish a repeatable process for analytics and marketing reporting.
Unlike manual reporting processes which can take hours or takes to complete, data pipelines are automated systems. When data is collected automatically, gets cleaned and organized with a few clicks, and your reports update on a schedule – your team saves hours on data preparation and can make decisions faster.
While not every data task requires a full pipeline, here are common scenarios when building one makes sense:
- Multi-channel reporting. You need reliable weekly/monthly reports that combine data from marketing channels to assess the overall performance of your PPC, social media, or lead generation efforts.

- Customer acquisition analysis. You want to understand the customer journey from initial touchpoints (impressions, ad clicks) to consideration and purchase.

- Connect marketing success to business impact. You need to demonstrate how your marketing investments contribute to revenue growth, and this involves consolidating data from multiple business sources.

Key components of marketing data pipelines
Let’s explore the 4 main components of marketing data pipelines.

1. Data collection
Data collection is the foundation of any marketing data pipeline. Without gathering relevant data from your marketing applications, you can’t create meaningful reports, preserve performance metrics, or make decisions based on the bigger picture.
Collection is guided by your specific analytics goals or business questions. For instance, if your goal is to evaluate the impact of your paid advertising budget across channels – Meta, Google, LinkedIn, TikTok, X – you would need to first collect data from all these applications. P.S. We’ll describe the various methods a little later.
2. Data organization
The next critical step after collecting data is to prepare it for curation and analysis. This involves taking raw data you extracted, such as 6 months’ worth of email campaign information from Mailchimp (subscriber demographics, open rates, bounces, clicks, unsubscribes, etc.), and shaping it into a readable, logical structure.
It may include:
- Sorting the data chronologically and filtering out irrelevant fields (like send times or preview text columns).
- Adding custom metrics, e.g., cost per conversion.
- Performing aggregations, like monthly summaries or audience segment breakdowns.
- Consolidating marketing data from other sources, such as Klaviyo, HubSpot, GA4, etc, when your objective is to create a comprehensive performance report.
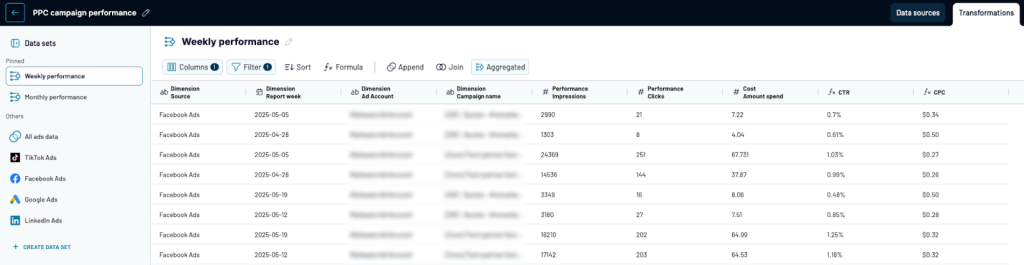
Here are what the different transformation options look like in Coupler.io:
3. Data storage and management
This stage of the pipeline can be optional, depending on your goal for a particular data set. For example, if you want to establish a data flow for email marketing reporting, it’s not always necessary to store this data in an intermediate location before visualization.
However, storing data is important in cases where:
- The platform you are pulling data from only stores historical data for a fixed period (e.g., 18 months), and you want to preserve data for future year-over-year analyses.
- You transformed data, but don’t have plans to visualize or present it in a report just yet.
- You need a location to gather and curate clean data for marketing experiments or machine-learning exercises.
Common storage options include data warehouses like BigQuery, RedShift, and Snowflake, or spreadsheet apps like Google Sheets and Excel.
4. Data delivery and analysis
The final pipeline component is about making data actionable for your team and/or stakeholders. For that, you’ll need access to a reporting destination, such as a BI tool (Tableau, Looker Studio, Power BI, Qlik, etc.), a spreadsheet application (Google Sheets, Microsoft Excel), or emerging AI-powered destinations (Claude, ChatGPT, etc.).
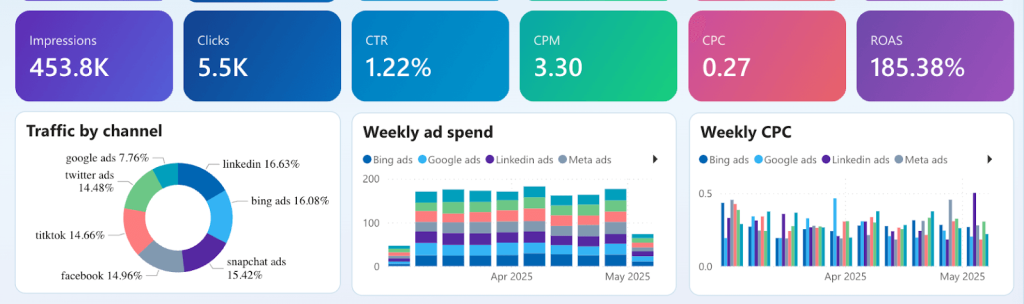
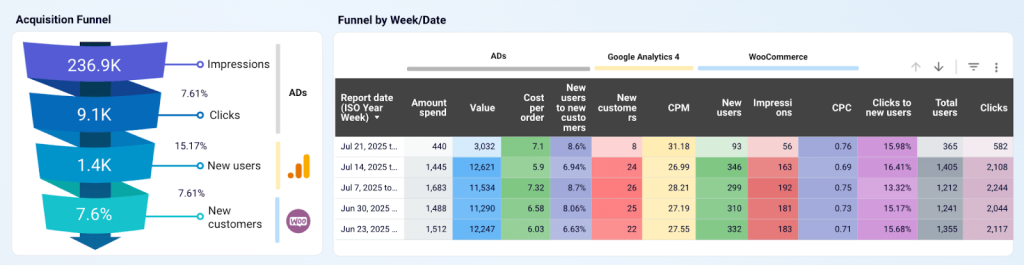
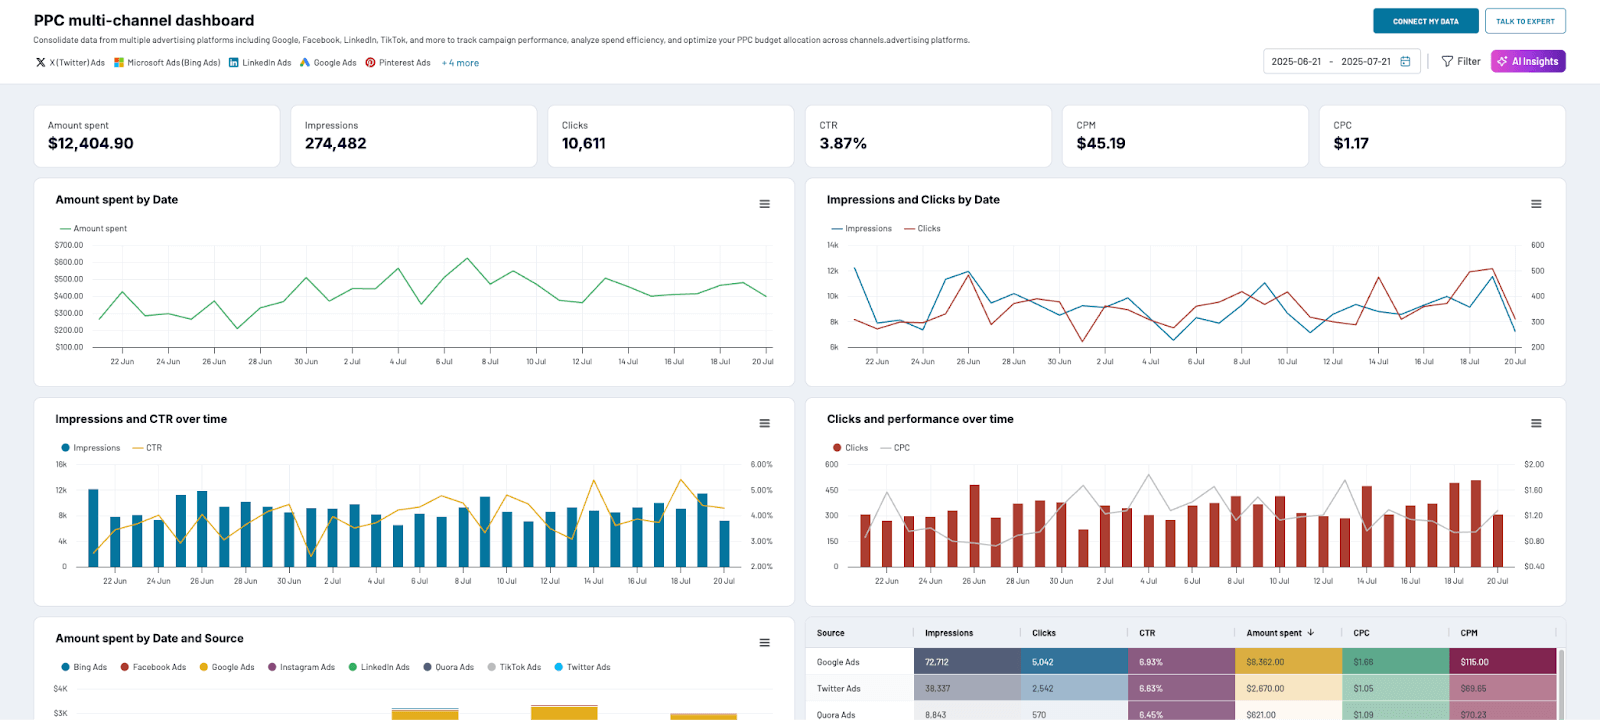
This is where pre-organized data – which lived in rows and columns up until this point – is structured into a report or interpreted automatically. For example, if your ultimate goal was to visualize the marketing funnel analytics for your Shopify store, the finished report may look something like this.
Shopify marketing funnel dashboard

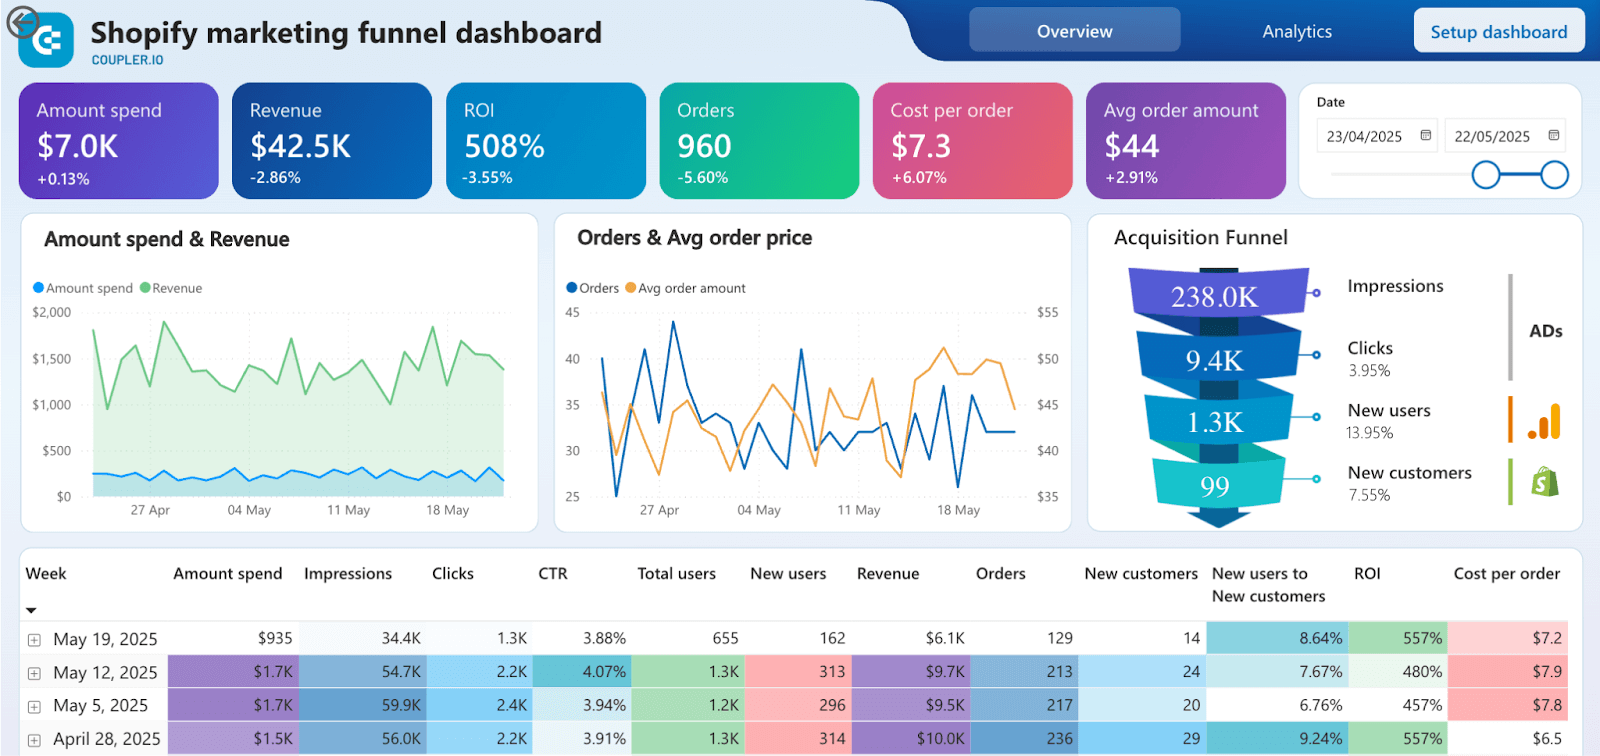
Shopify marketing funnel dashboard
Preview dashboardThe dashboard contains a range of visualizations that make your data easier to analyze, including scorecards, line charts, funnel visual, and an interactive table.
On the other hand, if you integrate your marketing data with AI, you may skip manual dashboard analysis and get straight to insights. For instance, Coupler.io allows you to connect your data flows to AI tools like Claude, where you can chat and ask specific questions through natural language. Meanwhile, dashboard features like AI Insights by Coupler.io automatically analyze your collected data and deliver trends, key findings, and recommendations in seconds.
Regardless of the tool you use for data delivery and visualization, its purpose is to reveal trends, patterns, or anomalies that you can act on to improve your marketing performance.
How to build an efficient marketing data pipeline from scratch
Now that you understand each component and the purpose they serve, let’s go through the step-by-step process of building an efficient marketing data pipeline. While a lot of it hinges on the quality of your data and how it’s collected, other aspects can be automated too.
Step 1: Plan your pipeline structure and requirements
Every marketing data pipeline starts with analytics, reporting, or some kind of business objective. The first step is to identify the problem you are trying to solve. Do you want to prove ROI by connecting campaigns to actual revenue? Better understand which marketing channels attract high-value customers?
To fully define pipeline requirements, you should also ask yourself:
- Which data sources potentially hold the answers to your questions? This will guide your collection efforts from the beginning.
- Will you need to consolidate data from multiple sources? Plan for the complexity of joining data from platforms with different metrics and formatting.
- Who will require access to the final result – marketers, C-level executives, non-technical clients? This will affect your choice of destination, i.e. a basic spreadsheet report may not be appropriate for upper-management presentations.
- How often do you need updated data? Consider whether you will need refreshes daily, weekly, or every other month, and how to automate them.
Step 2: Set up automated data collection from all sources
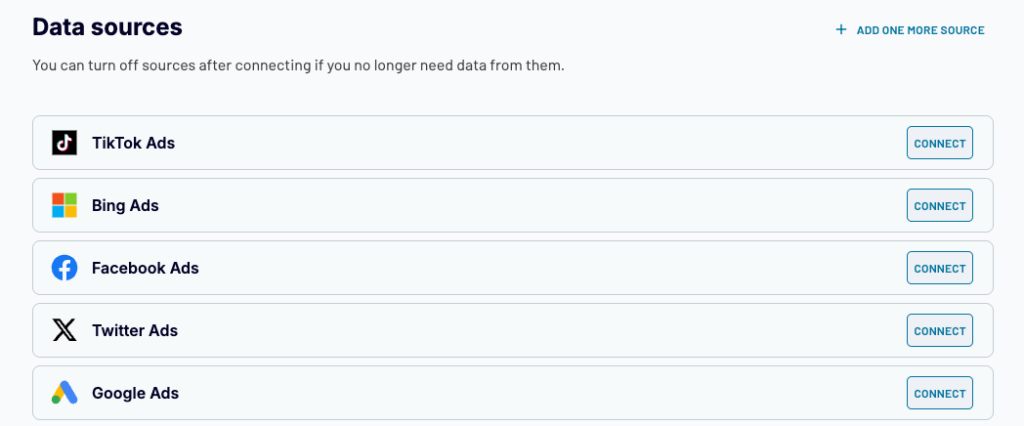
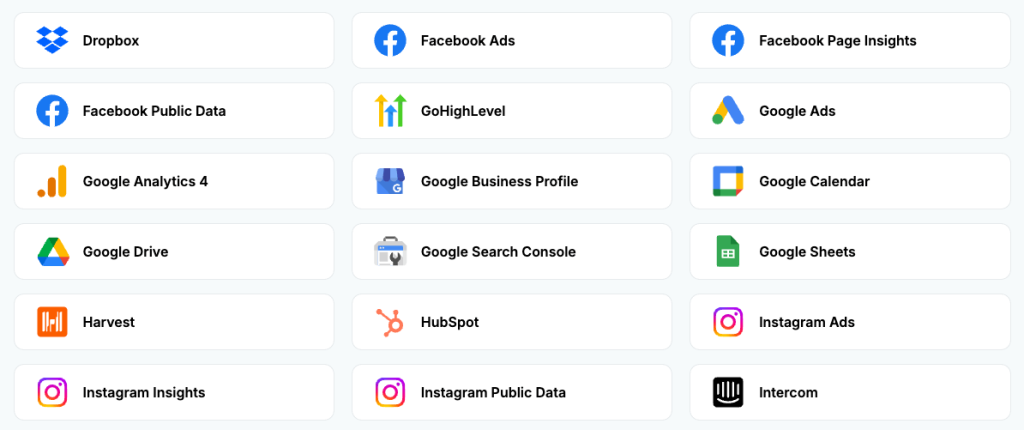
Once you have the general structure outlined, it’s time to gather the necessary data and automate the flow to a chosen destination – spreadsheet, Looker Studio dashboard, etc. For example, here’s how the process looks in Coupler.io when you want to connect data from social media platforms to create a comprehensive report:
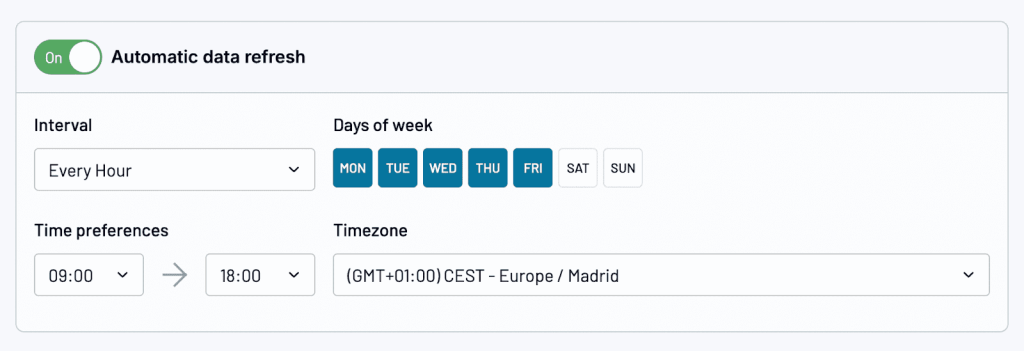
A little later in the data flow set up, you’ll be prompted to create a schedule for automatic data imports. This ensures that your data in your final report is always 100% up-to-date. It can be customized (interval, days of week, times, etc.) and easily toggled on and off.
Step 3: Design data cleaning workflows
The quality of your data determines the insightfulness of your reports. That’s why it’s important to build validation checks, like anomaly detection and transformations that clean and format data, directly into your pipeline.
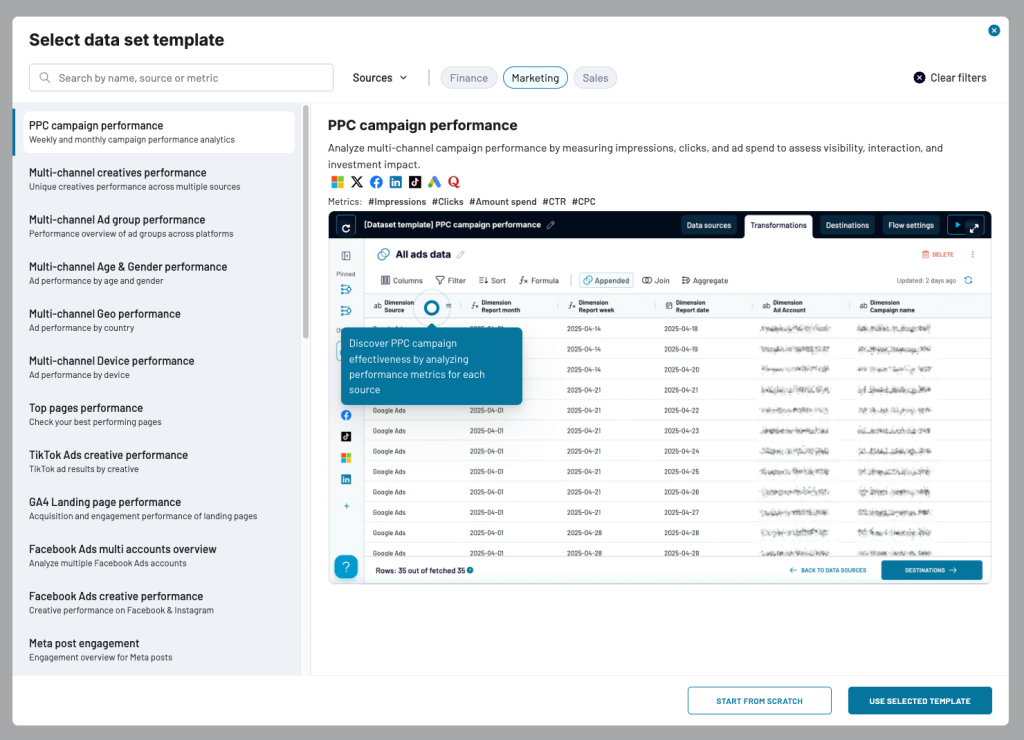
In Coupler.io, you can take advantage of data set templates or transform data right after connecting your sources. The module provides built-in data cleaning and consolidation tools, allowing you to make changes before sending the data to a report. Here’s an overview of the various options:

Step 4: Establish storage and backup systems
Set up a backup system for your transformed marketing data, whether that’s a data warehouse or organized spreadsheets. While you may not need it for every single pipeline, having a central location where your data is stored can protect you from losses and provide flexibility to create multiple reports from the same dataset.
You can create scheduled exports to storage systems like BigQuery, RedShift, PostgreSQL, and spreadsheet apps like Google Sheets and Excel with Coupler.io – the same way you set up a typical data flow.
Step 5: Build dashboards and a system for data delivery
The next step is to create a system for both presenting your data and sharing reports with stakeholders. This involves automating data imports to business intelligence tools, building dashboards to properly visualize your data, and setting up permissions so the right people can access your report.
Creating dashboards or reports from scratch can be extremely time-consuming, especially if you are taking this approach with every new pipeline. To save you time, Coupler.io offers a library of 150+ free dashboard templates for different reporting use cases, from paid ads and multi-channel marketing reporting, to website and lead generation analytics. Find a version compatible with your preferred BI tool:
Set up your dashboard with Coupler.io

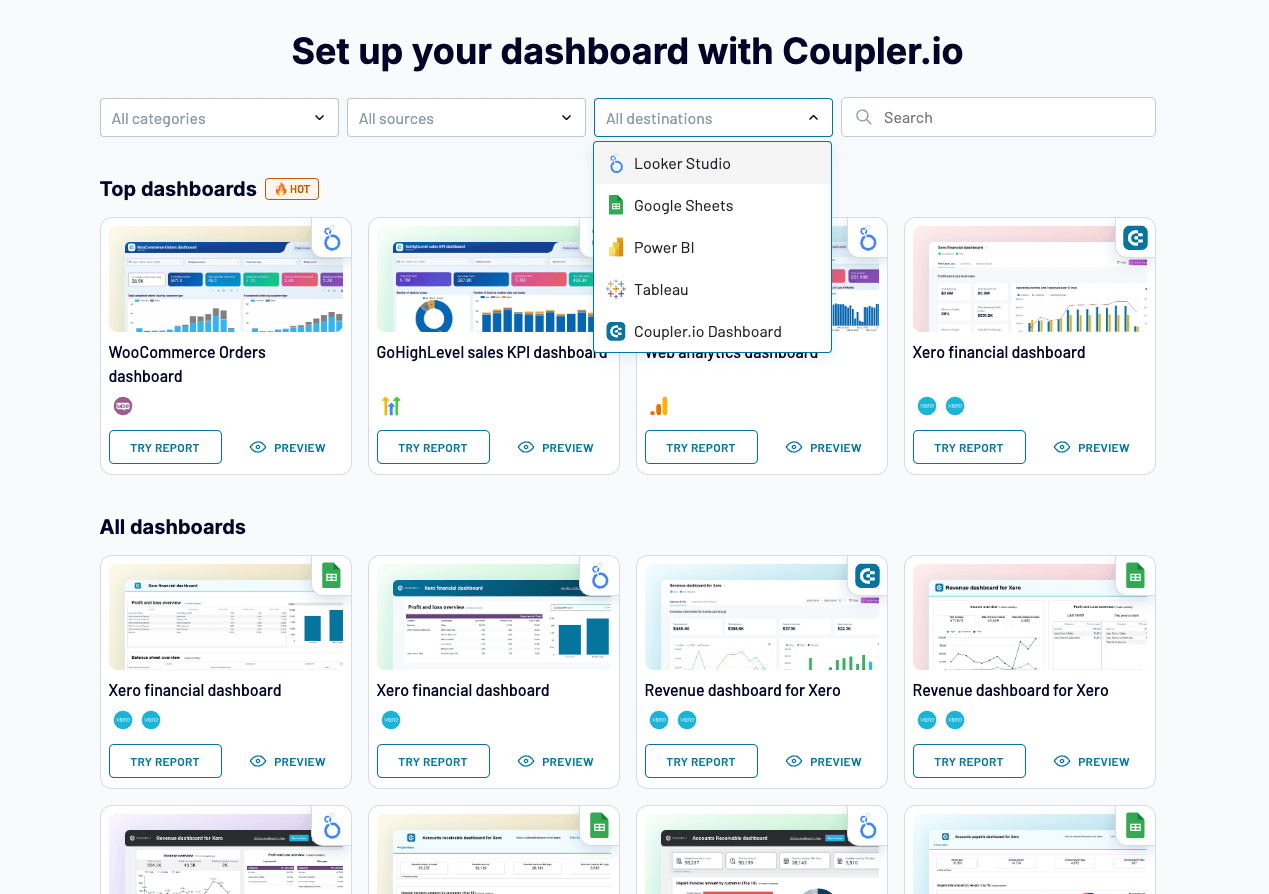
Set up your dashboard with Coupler.io
Try for freeStep 6: Implement monitoring and maintenance procedures
Set up ongoing monitoring to ensure your pipeline runs smoothly and delivers data on the correct schedule. Remember: just because it’s automated doesn’t mean it won’t need occasional fixes.
Configure alerts to be notified when imports fail (Coupler.io does this for you automatically) or when the data in your reports is incomplete or shows unexpected spikes/drops. You may even schedule quarterly reviews of all your pipelines to determine if they still match your marketing/business objectives and reporting needs.
Step 7: Analyze and act on your visualized data
Once your pipeline is operational, the final step is to extract meaningful insights that will guide your marketing decisions. This involves regularly reviewing your dashboards and/or reports to identify trends, performance gaps, and optimization opportunities across campaigns and channels.
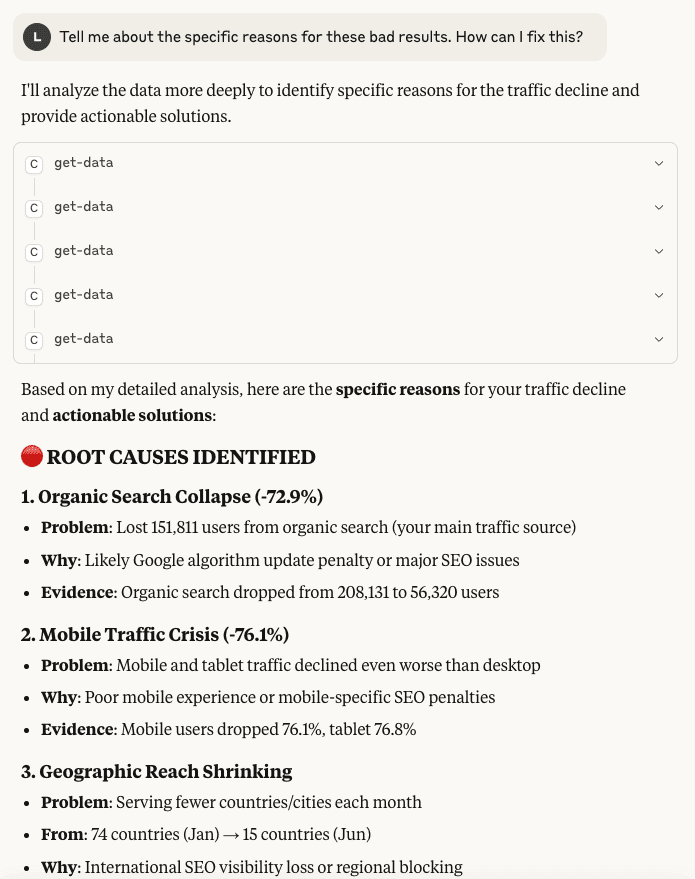
However, manually analyzing data can take hours. To automate this part of the pipeline – and significantly speed up decision-making – you can use specialized AI tools. It only takes a few minutes to create a data flow in Coupler.io and integrate it with Claude or ChatGPT. After that, you can query data flows in a conversational interface to understand the reasons for web traffic decline or other issues. It provides practical solutions that empower you to act right away.

AI-powered dashboards also help you act faster on your visualized data. Features like AI Insights by Coupler.io, available in Coupler.io dashboards, generate instant summaries with the click of a button. It points out key trends and anomalies, as well as detailed recommendations on what to do next. This helps you make decisions 10x more quickly by cutting out the hours typically spent on manual analysis.
It’s crucial not just to create an automated data pipeline, but to use the insights it (eventually) generates to improve your decision-making capacity and optimize your marketing strategy.
Use the AI power for your data reporting and analytics with Coupler.io
Get started for freeTypes of marketing data collection methods
A data pipeline can be built in 7 steps, but its integrity depends on how well you manage and automate data collection. Let’s explore this component in more detail to ensure every single pipeline you create delivers accurate, timely data from the start.
When it comes to gathering data from your marketing tools, you have a few options depending on your team’s needs and available resources.
Manual data collection
The most basic way to collect data from marketing sources is to export files from different platforms. For example, to manually collect data from YouTube Analytics, you would need to choose a report (content, traffic, etc.) and export it as a CSV file or Google Sheet.

This approach makes sense when you only manage a few data sources, generate occasional reports (i.e., simple quarterly breakdowns), and real-time data isn’t a priority. But it has a few significant drawbacks:
- An inefficient process when you need to collect data from multiple sources at the same time, such as 7 different advertising platforms. Export methods vary across tools; some are more complicated than others.
- Manual exports cost your team valuable time (possibly hours) on tasks that can easily be automated.
- To transform your data, you’ll need to rely on features available in external tools (e.g., PowerQuery) or purchase additional software.
- Any data you extract is static at the point of download, so it quickly becomes stale and potentially unreliable.
Ultimately, manual data collection isn’t an approach that will help you build efficient pipelines. Let’s move on to automated methods of collecting data from different sources.
Basic automation with native connectors
Another common way to collect data is with built-in connectors provided by your existing tools. For instance, if you plan to report on blog performance using data from Google Analytics 4 and Google Search Console, you could use Looker Studio’s native connectors to collect data from the apps automatically.

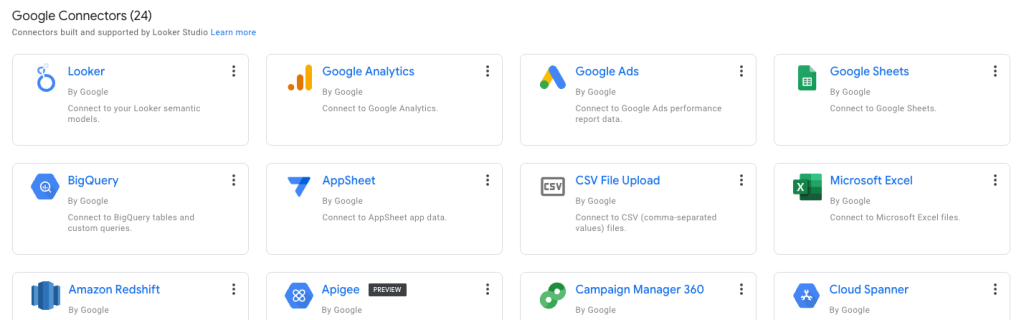
This process is usually straightforward and can be completed in a few minutes, depending on how many sources you connect. The data populates in the destination (e.g., Power BI) and refreshes on a schedule.
The biggest problem with this approach is the limited number of supported data connectors offered by such tools. Additionally, many tools impose limits on the number of sources you can combine in a single report (e.g., max 5 in Looker Studio).
Let’s say your end goal for collecting advertising data from Instagram, LinkedIn, YouTube, and TikTok is to create a cross-channel spreadsheet report in Looker Studio. Since the BI tool doesn’t provide built-in connectors for all of these data sources, you’ll need to use third-party integrations, manual exports/imports, or a separate data collection tool altogether.
So, it only works if you manage a small number of sources that fall within a specific ecosystem: Google, Microsoft, etc. Otherwise, you’ll have to rely on additional software to bridge the gaps – or switch to a more comprehensive solution.
Advanced data collection tools
Last but not least, you have the option to use dedicated tools for data collection and other tasks like transformation and reporting. These solutions make it easy to automate your pipeline and manage the complexities of multi-source integrations.
For example, Coupler.io is a data integration and AI analytics platform that allows you to collect data from over 300 business applications. You can set up automated data flows in minutes without any coding, conduct advanced transformations on the go, and schedule data refreshes on a custom schedule.
To put this in context, let’s say your goal is to build a multi-channel PPC report like we mentioned earlier. With Coupler.io, you can:
- Gather data from Instagram, Google, YouTube, TikTok, etc. simultaneously by connecting your accounts. Data set templates can save you time here and at the next step.

- Organize data by merging columns, filtering by date, and creating weekly/monthly aggregations.
- Connect your preferred tool (e.g., Google Sheets, Power BI) to automatically import the prepared data to a reporting interface.

- Alternatively, use a pre-designed dashboard template to visualize your data instantly.

- Schedule the data in your report to update on a regular basis (e.g., hourly, daily, weekly).

This shows how one tool can handle almost all aspects of pipeline automation. But before you consider a comprehensive solution for data collection and beyond, let’s explore the main criteria to ensure any tool you choose aligns with your specific requirements.
Choosing the right data collection and automation solutions for your needs
Coverage for your marketing sources
It’s more convenient (and less messy) to use a single tool for data collection. You don’t want to be juggling data flows across several platforms or native connectors, as this will only lead to confusion and technical issues in the long run.
Look for tools that cover as many of your marketing and business sources as possible. For instance, Coupler.io lets you connect to a wide range of applications including PPC and social media platforms, CRMs, web analytics tools, SEO tools, and much more.
Technical complexity
Some data collection and ETL tools, like Stitch or Fivetran, have higher learning curves and require more technical expertise to manage effectively. Other tools, such as Coupler.io and Windsor.ai, prioritize ease of use with a no-code interface that gets you up and running quickly.
Choose the solution that matches your teams’ skills, resources, and actual data needs. Unless you’re working with massive data sets that require custom modeling, it’s unlikely you’ll need to invest in enterprise-grade ETL platforms packed with complex transformation features.
Data transformation capabilities
Most marketing data needs some level of cleaning and formatting before it’s useful for analysis. To make your life easier, look for data collection solutions that go beyond basic integration. For instance, Coupler.io provides a dedicated transformations module, so you can make strategic changes before sending the data to a destination.
The best tools provide transformation options such as sorting, filtering, custom calculations, column management, data consolidation (merge columns, append similar data sets), and aggregation (summarization, averages, totals, etc.).
Coupler.io also offers an array of data set templates that come with pre-configured transformations. Instead of handpicking sources, formulating aggregations, or handling data joins yourself, these enhancements are automatically applied. You can choose from lots of options for marketing and sales use cases:

Scalability
Think beyond your current data volume to where you’ll be in 2 or 3 years. If your team continues to grow and your strategy becomes more ambitious, will your chosen tool be able to handle the extra load? Instead of a few automated pipelines for PPC reporting, you could be dealing with dozens of complex data flows consisting of thousands of rows each. In that case, a simple Facebook Ads to Google Sheets importer won’t cut it.
Consider solutions that allow you to manage multiple data flows simultaneously and import high volumes of historical data from marketing platforms.
For example, over the past 5 years Coupler.io has evolved into a versatile tool that scales with your growth. Here’s a quick overview of how the platform has expanded alongside the needs of our customers:
2020-2021: Google Sheets add-on offering 15 source integrations
2022: Web app with 30 sources + 3 destinations
2023: More than 50 sources, new transformations module, and total of 6 destinations
2024: 70+ sources, 11 destinations, and new gallery of 80+ free dashboard templates
2025: Full-scale, AI-enhanced data automation and reporting tool offering 300+ sources, 160+ templates, pre-built data sets, and 11 varied destinations (growing fast!).
Data storage options
Many marketing platforms impose limits on data retention, which can make it impossible to compare performance from different periods (i.e. 2023 vs 2024). To prevent losing access to this data, you’ll need to store it somewhere else, at least temporarily.
Coupler.io implements incremental fetching for several sources. It’s a built-in feature that automatically fetches only new data from your connected source (e.g., GA4) and keeps a record of the rest.
This enables you to preserve data beyond platform retention limits, for instance, Facebook Ads’ 37-month limit. As a result, you can create historical year-over-year comparison reports without investing in more elaborate storage systems.
Reliability and uptime frequency
Your marketing decisions depend on having up-to-date, accurate data. A data automation tool that regularly experiences downtime or performance issues can delay data delivery and damage stakeholder trust in your reporting.
Before committing to a solution, research its track record. Check independent reviews on sites like G2 and Capterra to see how users rate its stability and support responsiveness.
Error handling and data recovery options
Data connections will break – it’s not a matter of if, but when. Your marketing applications can experience unplanned downtime, update or deprecate their APIs, and destinations like Looker Studio can crash unexpectedly.
While you can’t completely avoid these problems, you can minimize their impact with the right tool. Seek out a data collection solution that sends notifications when connection problems occur, offers a built-in error log, and provides resources (knowledge base, video tutorials) to guide you toward a fix.
Compatibility with reporting destinations
Your data collection tool should integrate seamlessly with your preferred destinations. Whether you use Google Sheets, Power BI, Tableau for reporting, or data warehouses like BigQuery for regular storage and backups, ensure the collection tool connects to the proper platform and can deliver data on the schedule you need.
Costs and pricing models
Consider how different pricing models align with your data collection requirements. Some tools charge by usage, others tailor prices to your specific needs, and many use flat monthly/annual rates. Solutions offering tiered plans and free trials usually offer the most flexibility and cost-effectiveness for marketing teams.
Case in point: Coupler.io provides a 7-day free trial, a forever-free plan, and 4 additional subscription options for teams with higher data connection needs (and who want AI-powered insights directly in their dashboards).
Now that we’ve covered the key criteria, here’s a more detailed comparison of popular tools – many of which we’ve already mentioned – that allow you to automate data collection and other pipeline tasks.
| Features | Coupler.io | Supermetrics | Funnel.io | Adverity | Fivetran | Windsor.ai | Stitch |
| Free trial | ✅ 7-day | ✅ 14-day | ✅ Tailored to your needs | ⛔ Demo only | ✅ 14-day | ✅ 30-day | ✅ 14-day |
| All data sources in all plans | ✅ | ⛔ | ⛔ | ⛔ | ⛔ | ⛔ | ⛔ |
| Data union from multiple sources | ✅ | ✅ | ✅ | ✅ | ✅ | ✅ | ✅ |
| Data transformation | Column management Filter Sort Custom calculations Data aggregation Data unification (append & join) | Custom fields Dynamic currency conversion Naming conventions decoding Data blending | Field mapping Data type normalization Automatic currency conversion Data blending | Data mapping Create/edit columns Translation and currency conversion enrichment AI-powered custom scripts Data aggregation | dbt core integration Data aggregation Data blending Data blocking & column hashing Filtering, sorting, etc. | Custom fieldsFilteringData blending | Data mapping Sort Data aggregation Custom calculations Data blending |
| Prebuilt transformation and dataset templates | ✅ | ✅ | ⛔ | ✅ | ✅ | ⛔ | ⛔ |
| Data destinations | BI tools Spreadsheets Databases AI agents | BI tools Spreadsheets | BI tools & spreadsheets Analytics platforms Data warehouses | BI tools and spreadsheets Databases CRMs Social advertising & analytics platforms | Data warehouses Data lakes Databases | BI tools Spreadsheets Data warehouses | Data warehouses Analysis tools |
| Min. refresh frequency | Every 15 min | Every hour | Every hour | Every 15 min | Every 1 min (Enterprise & Business Critical plans only) | Every hour | Every 30 min |
| Dashboard templates | 150+ | 100+ | 19 | ⛔ | ⛔ | 100+ | ⛔ |
| AI capabilities | AI InsightsMCP server | AI-powered custom fieldsQuery Insights | Quick ExploreAI-powered analytics | AI-powered custom fieldsQuery Insights | FivetranChat | Multi-touch attribution modelsBudgetoptimizer | ⛔ |
| Quality of support (Capterra) | 4.9/5 | 3.7/5 | 4.6/5 | 4.5/5 | 4.6/5 | 4.0/5 | 3.5/5 |
| Pricing starts at: | $24 | $29 | Custom | Custom | $500 (usage-based) | $19 | $100 |
How to measure pipeline success and ROI
Automating data collection is half the battle won when it comes to building efficient pipelines. But once you have several pipelines up and running, how do you properly assess their impact on your data workflows and marketing output? And if you’re paying for various tools and systems to manage the pipeline, how can you justify their cost to upper management?
There are a few different ways to measure the pipeline performance. Most revolve around increased team efficiency and improved business outcomes, including:
- Time and labor savings. Document how long marketing reporting took before vs. after implementing an automated pipeline. For example, if it took approximately 15 hours a week previously to clean data, prepare all your reports, and manage integrations – and now it only takes 2 – that’s an 87% time saving every month. This time may be reinvested into strategic work that drives actual business growth.
- To give a real-world example, one of our clients saved 80 hours per month on reporting by automating their data pipeline (for social media and CRM reporting) with Coupler.io.
- Decision speed. Reduced time-to-insight is an important indicator of pipeline success. If it previously took your team several days to get from integrated data → decision, but after automation it only takes a few hours – that’s a major win.
- Cost savings. Despite an initial investment, automated pipelines can help you save money on data operations that once required specialist staff or multiple tool subscriptions. To assess this for yourself, track reduced dependency on data analysts and the size/total cost of your data ops stack. For example, Coupler.io client Fable Foods saved $60K per year on data analytics with an automated pipeline, as it allowed them to cut out the cost of a full-time data analyst.
- Improved project/campaign outcomes. Having access to fresh, reliable data in your dashboards contributes to faster decisions and in turn, better marketing results and higher ROI. To evaluate this impact, track how quickly you can pause underperforming ads, reallocate budgets to top-performing channels, etc. Consider that catching a 20% conversion rate drop within hours instead of days can save hundreds of dollars (each time) in wasted ad spend.
- Reduced manual errors. The probability of human error in manual data entry can be as high as 40%. Since data pipelines eliminate data entry on the reporting side (e.g., copying and pasting incomplete information), you may notice fewer small mistakes that lead to poor decisions or rework. This can potentially save you thousands in labor costs or lost revenue long term.
One common formula to calculate a marketing data pipeline’s return on investment is: ROI = (Monthly Hours Saved × Hourly Rate × 12 - Annual Pipeline Cost) / Annual Pipeline Cost × 100. This should give you a clear estimate of how an automated pipeline saves time and money.
Why marketing data pipelines fail (and how to prevent it)
Let’s look at a few common reasons why marketing pipelines don’t work as expected, and how to avoid these pitfalls altogether:
Trying to automate everything at once
You might feel pressure to automate every aspect of your pipelines right away, from data collection and transformations, to reporting and monitoring systems. But this approach can cause more problems than it solves, especially if you haven’t had enough time to test and tweak your chosen solutions.
How to prevent it
It’s better to start small with a relatively straightforward pipeline (say, connecting Facebook Ads data to Power BI for monthly reporting) and learn from your mistakes. Figure out how to automate data collection in the fewest steps, determine which refresh schedules work best for you, and then apply your knowledge to the next pipeline build.
Over-engineered solutions for basic data integration
You don’t need a pipeline for every data integration, preservation, or visualization scenario. For example, if you want to backup raw TikTok performance data in BigQuery or Google Sheets, there’s usually no need to create a specific, multi-step process. It can be as simple as automating exports on a schedule (which you can do with Coupler.io).
Likewise, data pipelines aren’t always necessary for ad-hoc reporting or quick analyses. If your goal is to investigate a technical SEO issue or generate a brief report for an ad campaign, it often makes sense to skip from data collection to visualization.
How to prevent it
Ask yourself if you really need to perform complex transformations or integrate data from multiple sources. Is real-time data a requirement or a nice-to-have? If you just want to move data from point A to point B once a fortnight, a basic data flow should do the trick.
Data quality treated as an afterthought
Many teams focus on getting data into reports without checking whether the data is accurate and complete. While this might save time in the short term, it can undermine the reliability of your dashboards, lead to poor business decisions, and force you to rebuild everything when issues are discovered.
How to prevent it
Regularly audit the data in your marketing accounts and automate data validation procedures where possible. For example, establish standardized names for marketing metrics to avoid duplication, and set up alerts for when data imports fail or when certain metrics don’t load properly. This will reduce the amount of work you have to do at the transformations stage and improve the overall quality of your reports.
On a closing note, remember: the best pipeline is one that you actually use. You don’t need to build an overly complex flow or think of every edge case before implementing it. Efficient data pipelines can take time to refine and optimize, but the sooner you start, the sooner you’ll save hours each week on manual reporting processes.