Sarah runs three Shopify stores across the US, the UK, and Germany, and Monday mornings look the same every week. She opens the master sheet, and the numbers are already wrong. The UK revenue column is still in GBP. The Amazon rows are blank because the SKU format does not match Shopify’s. Google Ads ROAS looks great until she remembers it counts 30-day conversions, and Meta counts 7. Four platforms, five conflicting numbers, one question: where did we make money last month?
Every additional store multiplies the problem. Multi-location reporting solves it by pulling everything into one place. Below you will find what makes cross-store data so hard to consolidate, what it costs when it stays fragmented, and how to automate the whole process with Coupler.io.


Need help bringing multiple stores into one report?
Book a demo with Coupler.ioWhy multi-location reporting challenges keep ecommerce owners up at night
Running multiple stores, marketplaces, or franchises should be simple – more stores, more revenue, same reporting logic. In practice, the moment you add a second store, you create a data fragmentation problem that grows with each additional platform.
The real bottleneck is not analyzing data itself, but getting comparable location-level data into one place. Let’s go through a few examples that you probably deal with more often than you would like.
Currency mismatch across stores and ad accounts
Your performance data starts fragmented before you even open a spreadsheet. Store A (Shopify US) reports in USD. Store B (Shopify UK) reports in GBP. Store C (Germany) reports in EUR. Your Google Ads account, running campaigns for all three markets, reports in USD, regardless of where the campaign ran. You start with three currencies across four platforms. None of them convert automatically when you pull reports.
Field names that mean the same thing but look completely different
Every platform has its own naming convention for the same data. When you try to match product–level data across sources, this is what you are dealing with:
- Shopify orders export:
Lineitem SKU - Amazon Seller Central All Orders report:
seller-sku - Amazon revenue column:
item-price - Shopify revenue column:
Total - Meta Ads export: Amount
spent - Google Ads export:
Cost
Same metrics, six different names. Any formula that tries to match these sources will fail unless someone manually maps each field before the analysis starts.
Separate ad accounts with inconsistent attribution models
Meta Ads typically defaults to a 7-day click window, while Google Ads often defaults to 30 days. When you look at ROAS figures from these platforms together, you’re not seeing marketing performance but different accounting methods. This misalignment causes inflated conversion numbers. It also hides true profitability by market. You end up optimizing for the wrong channel simply because the math is not aligned.
Different payment processors per region
Stripe handles DTC payments. PayPal covers the German store. Amazon Seller Central has its own payment system for marketplace orders. Each exports transaction data in its own format, with different fee structures and refund logic. To calculate true net revenue for all three, you need to reconcile three separate financial data streams.
Fulfillment costs that vary by market
The shipping costs for the same SKU differ between a UK warehouse and a US 3PL. Fulfillment companies manage your inventory. This means regional shipping rates, local return rates, and packaging needs can vary. Consequently, the same product yields a completely different net margin depending on where the order comes from. “Total revenue across all stores” tells you almost nothing useful. Net margin per store, per product, and per market is what matters.
How to set up and automate multi-location reporting with Coupler.io
While selling across multiple platforms is a lot of work, you cannot limit your expansion to a single location just because of data management. On the other hand, you cannot afford to waste a few hours a week struggling to consolidate data from multiple locations either.
Each of the problems above has the same underlying fix: build a report that brings all the data into one place, in a consistent format, and refreshes it on an automatic schedule. With Coupler.io, you can easily create such multi-location reports.
Coupler.io is a data integration platform with AI analytics support. It’s an all-in-one solution that provides everything you need to create reports for multi-location businesses:
- Collects data from over 400 source apps, such as Shopify, WooCommerce, Google Ads, Meta Ads, Stripe, Google Analytics, and so on.
- Provides features for filtering, blending, aggregating, and organizing data into analysis-ready datasets.
- Supports multiple reporting destinations including Google Sheets, BigQuery, Google Data Studio (formerly Looker Studio), Power BI, and AI tools.
- Keeps your data up-to-date thanks to the automatic data refresh on a custom schedule

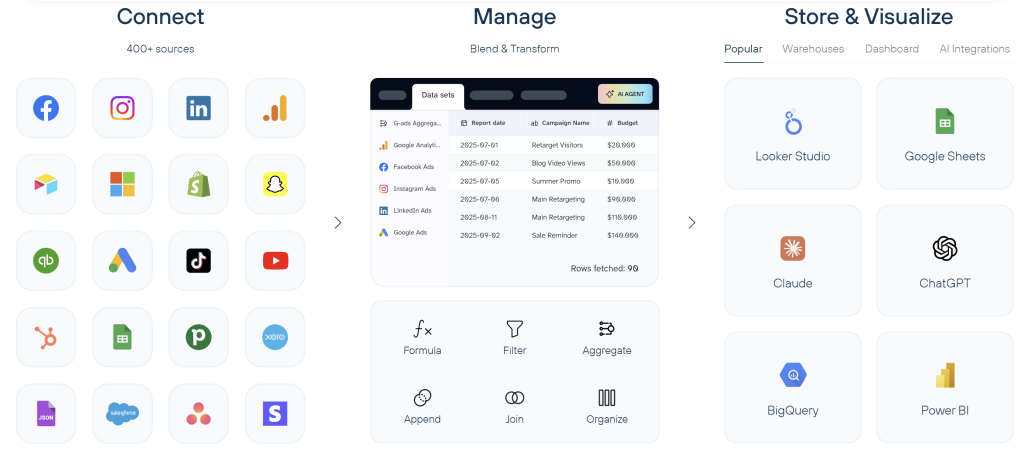
Here is how to set it up for an example scenario: a brand running Shopify US, Shopify UK, and Shopify DE, plus Google Ads, Meta Ads, and Stripe.
If you’re running a WooCommerce store alongside Shopify, or want to bring in GA4 traffic data to see which channels drive store visits, the setup follows the same pattern. Just connect it as another source in the same data flow.
Step 1. Collect ecommerce data in a single pipeline
Open a new data flow in Coupler.io and add each source individually. Every connection uses OAuth, so you authenticate directly with the platform rather than generating or storing API keys. This is the core of multi-location management: instead of logging into six different platforms, you connect to each one once, and Coupler.io keeps the connection alive on its own.
For this scenario, you’ll connect:
- Shopify: Connect your US, UK, and German stores to pull product-level data, including revenue, SKUs, quantities, and fulfillment status, into one stream. Because Coupler.io handles OAuth authentication, you avoid the complexity of managing individual API keys.
- Google Ads & Meta Ads: Consolidate your advertising performance by connecting multiple ad accounts. Since each platform uses different attribution windows (7-day click for Meta, 30-day for Google Ads by default), having them side by side in one dataset makes it easier to compare on the same terms.
- Stripe: Pull Charges and Refunds entities directly to track market-specific return costs alongside your sales volume, without manually aggregating separate files.

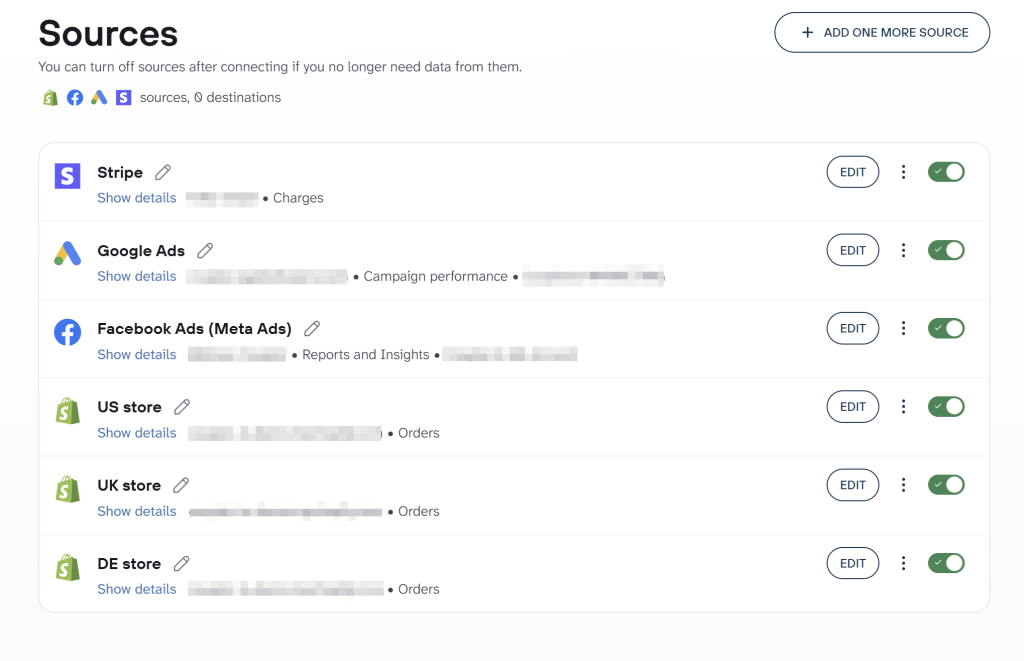
When you open a new location or add a marketplace channel, connecting it to your existing data flow takes minutes. You add a new source, and the rest of the pipeline stays exactly as it was.
Check out connectors for each of the mentioned data sources:
Step 2. Organize and combine data
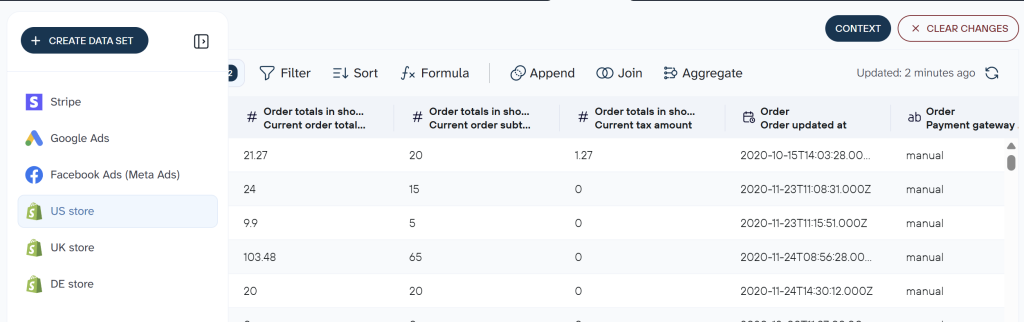
Once your data is connected, Coupler.io helps fix naming issues and structural differences. Three transformations do most of the work:
| What you do | What you gain |
|---|---|
Contextualize data with identifiers – Add custom formula columns, such as a store_region tag, to distinguish between US, UK, and DE datasets. | You retain market visibility even after your data is combined. |
| Unify datasets – Use the Append transformation in Coupler.io to merge your separate order tables into a single dataset. | Columns align across all stores into one clean, filterable table. |
| Standardize formatting – Normalize SKU names by removing locale suffixes or changing separators right in the platform. | Every filter and formula in your final report works without manual intervention. |

Step 3. Load, visualize, and analyze – deliver data where it matters
As data management software, Coupler.io gives you the flexibility to send normalized data to multiple destinations from a single configuration: spreadsheets, data warehouses, BI dashboards, and AI tools. You set each one up once, and every destination refreshes on the same schedule from the same dataset.

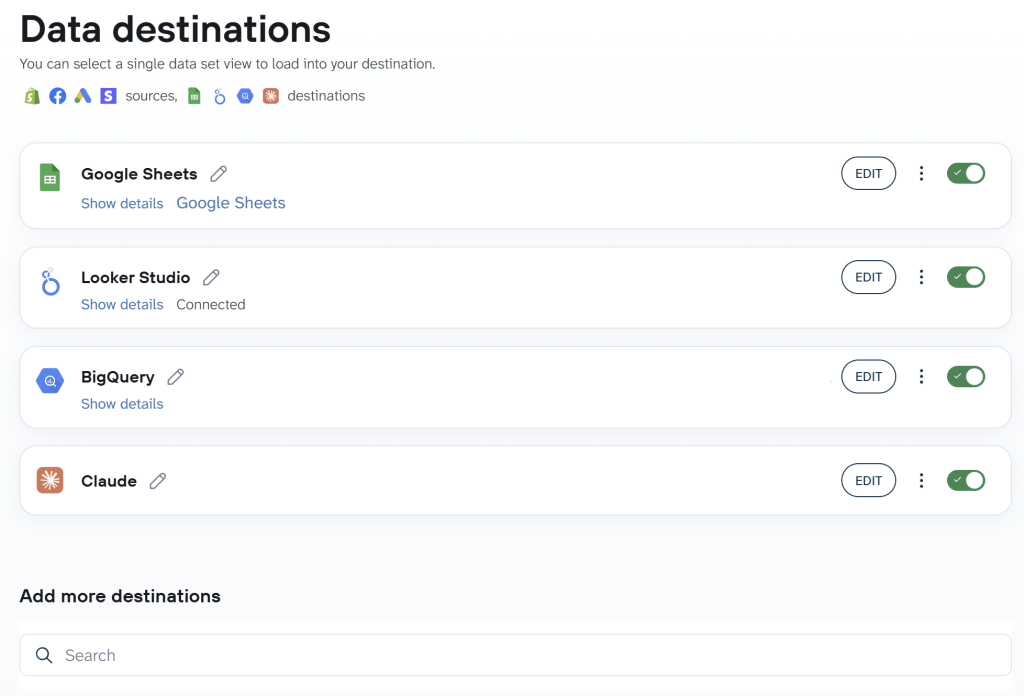
This keeps your local teams aligned, supports data-driven onboarding when a new employee joins, and allows you to work freely with your data in your default toolset.
End the export-and-fix cycle with Coupler.io
Get started for freeFrom a multi-location ecommerce reporting perspective, the following destinations deserve particular attention.
Google Sheets
Ideal for marketing teams needing live data in familiar formats. Coupler.io populates dedicated tabs so your tables and formulas update automatically instead of relying on outdated exports. For a three-store operation, you might keep one tab per store and a summary tab that pulls from all three.
BigQuery
Best suited for high-volume analysis or complex SQL joins. Coupler.io connects straight to your data warehouse. This is where you link Shopify orders with Stripe refunds and calculate net revenue across different markets. If your reporting needs go beyond what Google Sheets can handle, BigQuery is the next step.
Google Data Studio (Looker Studio)
Once your data sits in Google Sheets or BigQuery, you can build cross-store dashboards in Looker Studio that connect directly to those cleaned data sources. Visualize revenue by region, ROAS by market, or refund rates across all territories. Because your data refreshes automatically, the dashboard is ready for review whenever you need it.
Claude
You can also connect the same dataset to Claude through Coupler.io’s AI integrations. The data that feeds your Looker Studio dashboard is the same data Claude analyzes, refreshed on the same schedule. The difference is the interface: instead of reading a chart, you ask a question. Coupler.io’s Analytical Engine runs the calculation and returns processed results to Claude, so you get accurate answers instead of the hallucinations that come from pasting a CSV into an AI tool manually.
This means your reporting stack can cover both structured dashboards and conversational analysis from one data flow, without duplicating any of the setup.
If you want to skip building dashboards from scratch, use Coupler.io’s ecommerce dashboard templates for Google Sheets, Looker Studio, Power BI, and its own in-app dashboards.

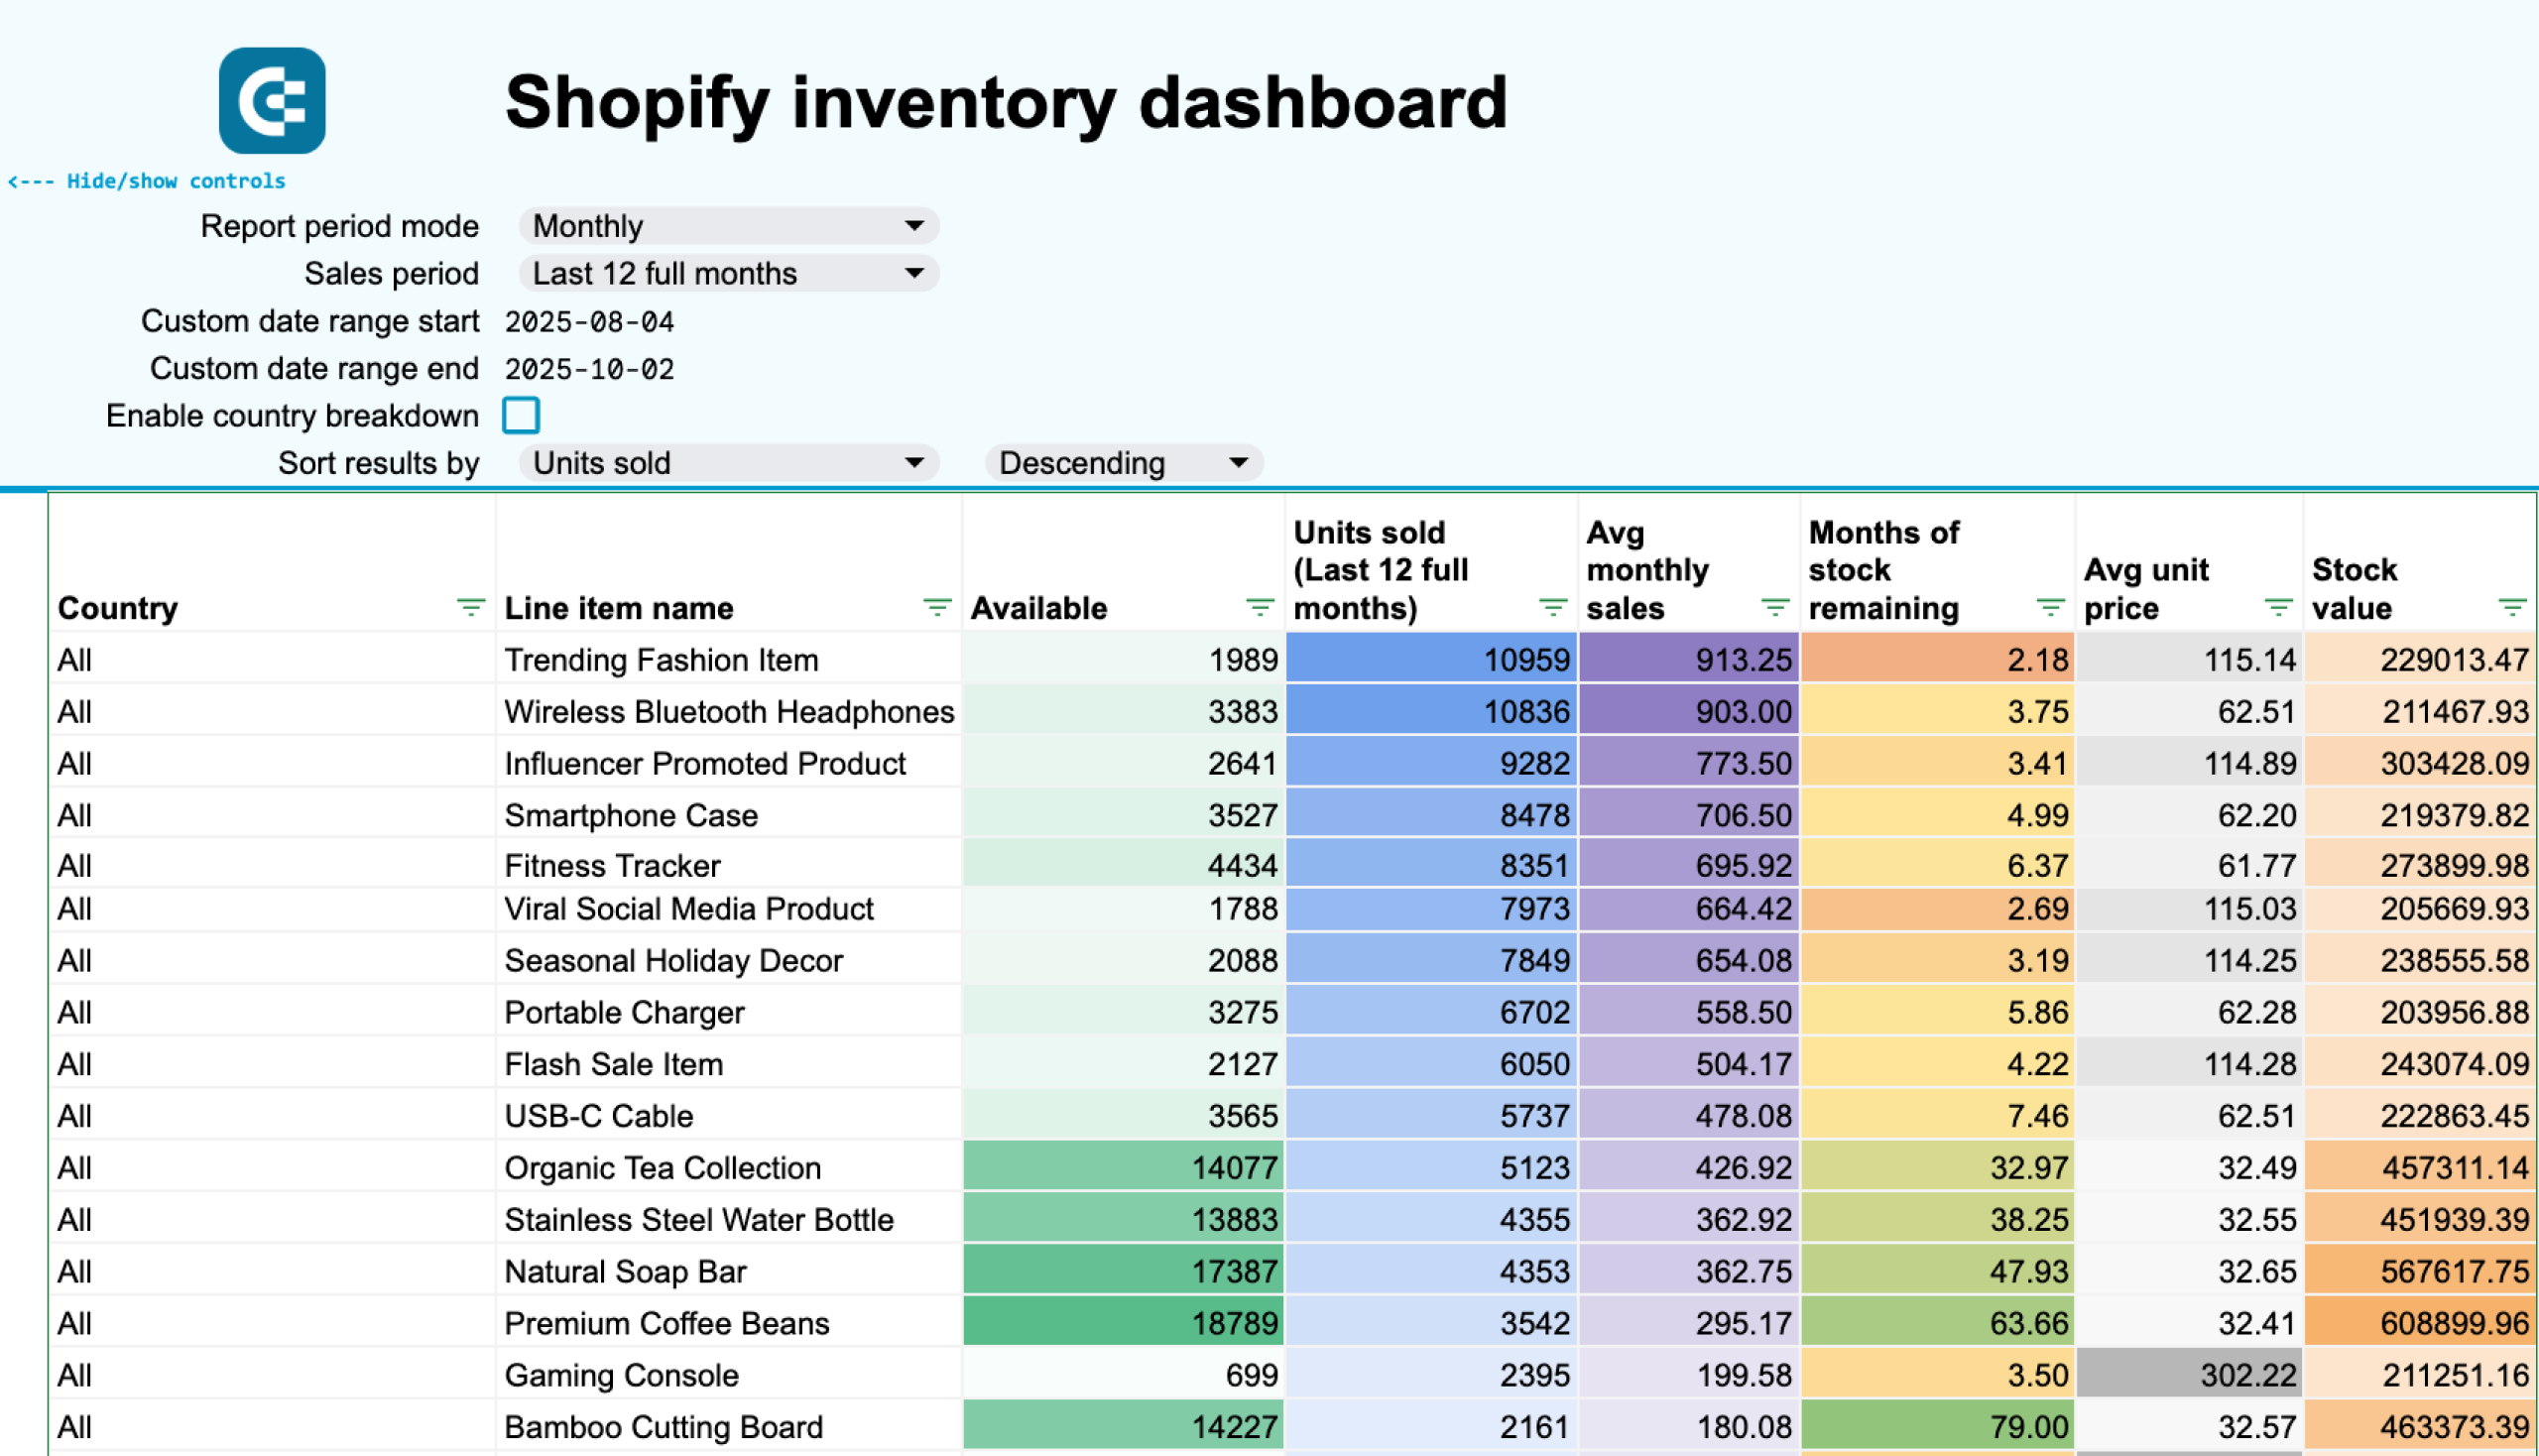
What manual business reporting across multiple locations actually costs you
If Coupler.io solves the consolidation problem, it is worth pointing out what that problem costs when you leave it unsolved. Convenience is the obvious part. But manual reporting also introduces serious financial and operational risk.
Store exports mismatch
For multi-location operations, every platform exports data in its own format. Shopify calls the product identifier Lineitem SKU. Amazon Seller Central calls it seller-sku. Your VLOOKUP (the Google Sheets formula that matches a value in one table against another) is looking for BLK-TEE-L in a column that contains BLK_TEE_L. Hyphen versus underscore. It returns blank for every row, silently, with no error message.
By the time you track down the mismatch, fix it, and re-run the comparison, you have spent two hours on data plumbing instead of analysis. And there is a good chance you have introduced a different error while fixing the first one.
Risk: Decisions made on incomplete product data.
Currency conversion formulas that silently go wrong
You build a cross-store revenue sheet and hardcode today’s EUR/USD rate at 1.08. Six weeks later, it is at 1.03. Nobody updated the formula because nobody owns it. Your store in Germany now looks 5% more profitable than it is. The sheet still looks fine, though; no cell turns red, so budget decisions for next quarter get made based on incorrect numbers.
Risk: Mispriced markets and wrong budget allocation.
Stale performance overview and the management bottleneck
The cross-store dashboard exists because one person built it and maintains it. When they are on holiday, sick, or simply overloaded, the report freezes. The data effectively stops at last month, yet the team keeps using it because the report still looks current. As a result, campaigns get paused, budgets get shifted, and restocking decisions get made based on numbers that no longer reflect reality.
Risk: Operational decisions made on outdated data.
Pulling exports, fixing column names, updating currency rates, chasing whoever last touched the master file. None of this produces a single insight. For a three-store operator doing this manually, that is 15-20 hours a month spent on data plumbing before any real analysis begins.
Risk: Reporting becomes extra work instead of a source of insights. And the multi-location reports you do produce are already outdated by the time someone opens them.
Monitor every store's margins with Coupler.io
Get started for freeWhy native tools do not handle multi-location reporting
Even if you are using Shopify’s multi-store view or Google Ads MCC (Manager account), those tools cover only one platform at a time. You still cannot see Shopify revenue alongside Google Ads spend alongside Stripe refunds in a single view. Native tools offer the single-platform reporting functionality, but they do not handle the cross-platform one. And that’s the reason to include a dedicated multi-location reporting tool in your workflow.
Custom pipeline integrations offer more control, but they require engineering time to build and maintain. When Shopify updates its interface, someone has to fix the pipeline. Many ecommerce teams with three to ten stores lack a dedicated data engineer. This gap is exactly what multi-location reporting software addresses.
Manual reporting works for a single store. At three locations across multiple channels and currencies, it becomes a bottleneck, costing your time, your budget, and your ability to answer the question: which store is profitable?
Key ecommerce metrics for multi-location KPI tracking
Multi-location analytics requires a different metric set than single-store reporting, as the cross-store dimension changes what each number means.
These figures matter most for business reporting across multiple locations. And each one requires consolidated data to be useful.
Revenue and net margin per store
Gross revenue per store is a starting point, not a conclusion. Net margin per store, after ad spend, payment processing fees, fulfillment costs, and returns, is the number that tells you which market is healthy. Your Germany store might show the highest revenue while running the thinnest margin once DHL shipping costs and a higher EU return rate are factored in. You cannot see that without combining Shopify, Stripe, and Meta Ads data in the same view.
Customer acquisition cost by channel and region
CAC from Meta Ads in the UK versus Google Ads in the US can differ dramatically, even for the same product. Tracking CAC per store per channel tells you which acquisition channel is profitable in each market and not just which looks cheapest in isolation. These cross-location insights are lost when you analyze each platform separately.
Return on ad spend by market
A 3.2x ROAS on your US social media campaigns and 1.8x on your UK campaigns is not a budget reallocation decision on its own. You need average order value and fulfillment cost per market before that comparison means anything. ROAS only matters when it’s compared to margin data from the same market. This is one of the clearest multi-location reporting benefits, and a strong argument for centralized multi-location reporting in general: the number does not change, but its meaning does when you see what surrounds it.
Inventory velocity per location
Which SKUs are moving fastest in which market? If a black tee sells out in 10 days in the US and sits for 45 days in Germany, that is a restocking and forecasting signal. You can catch it early with consolidated data. Without it, the German stockout becomes a surprise.
Refund and return rate comparison
Return rates differ by market. EU consumer protection laws lead to higher return rates compared to US markets. Reports for multi-location businesses showing return rates by store help identify product-market fit issues, sizing problems, or customer expectation gaps per region. A 12% return rate in Germany and a 4% return rate in the US for the same SKU is a signal worth investigating before you scale ad spend in that market.
Customer lifetime value by acquisition source per store
Customers from Google Shopping in the US and those from influencer campaigns in the UK might have different lifetime values. LTV by acquisition source is only visible when you connect ad data, order history, and customer data in one place. It is also the metric most likely to change your channel strategy once you see it.
After you get your data into BigQuery or Google Sheets using Coupler.io, you can easily connect it to an AI tool for conversational analysis. There’s no extra engineering needed.
Coupler.io connects your data to Claude, ChatGPT, and other AI tools through its AI integrations. The setup is the same data flow you have already built; just add an AI tool as an additional destination alongside Looker Studio or Power BI.
What makes this different from pasting a CSV into an AI tool directly is the architecture behind it. When you ask a question, Coupler.io’s Analytical Engine runs the calculation against your full, current dataset and returns verified results to the AI. The AI interprets the findings without hallucination. It does not guess at the numbers but receives processed, accurate results and explains what they mean.

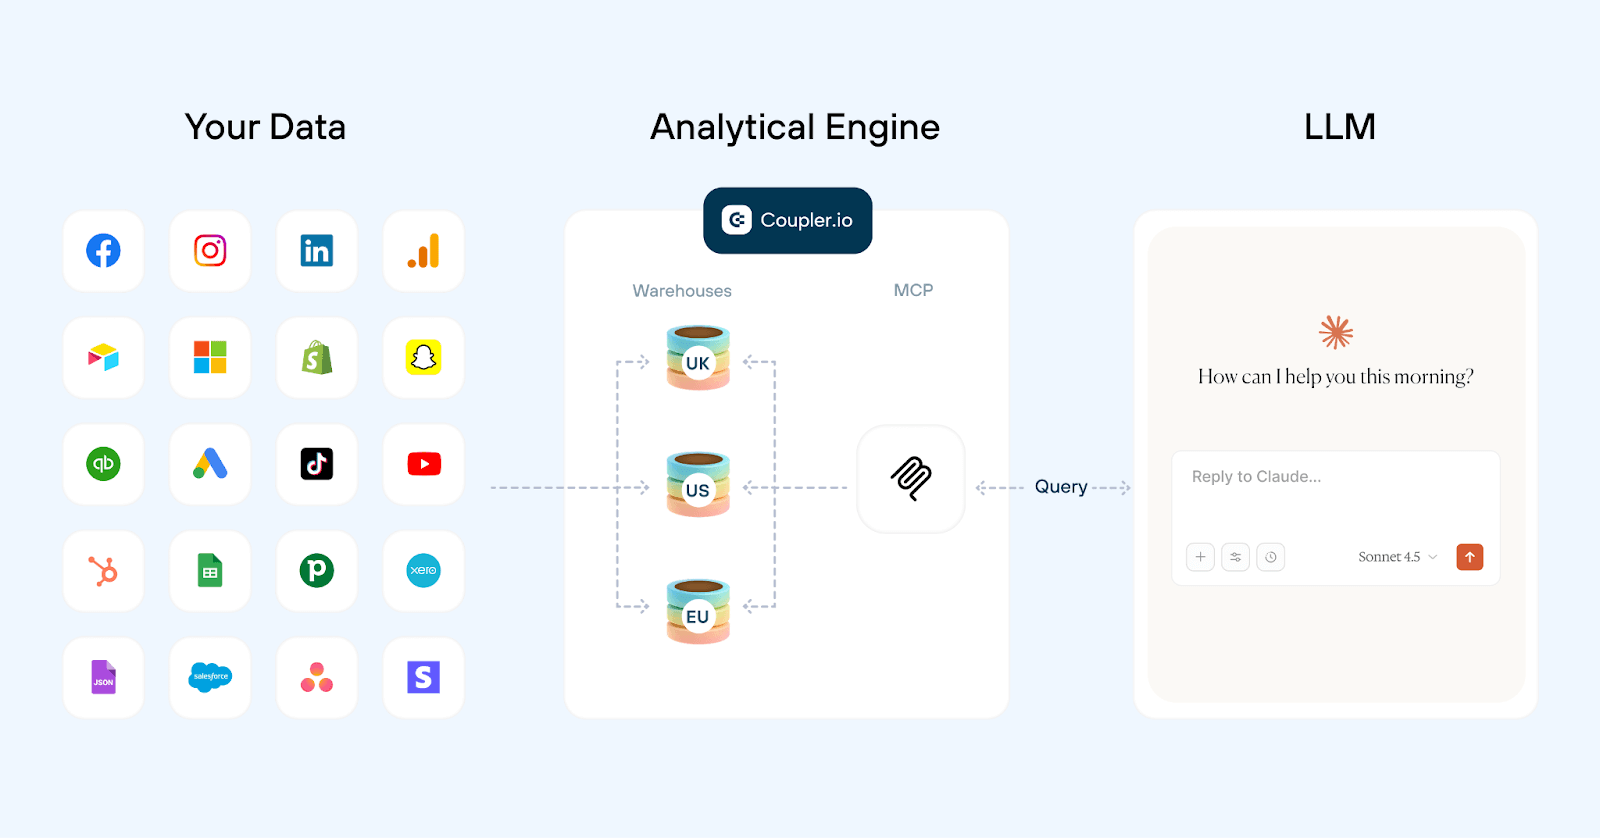
As an ecommerce owner running a multi-location brand, you can ask questions like:
- “
Compare Black Friday revenue, AOV, and ROAS across all three stores year-over-year.“ - “
Which region has the fastest inventory turnover for our outerwear category this quarter?“ - “
Which store has the highest return rate on products acquired through Meta Ads?“
These are not questions you could answer in a few seconds from a manual spreadsheet, but with consolidated, current data connected to Claude or ChatGPT, they are just a matter of asking.

Let Coupler.io make your data work for you instead of letting manual reporting become the work itself
If you are running multi-store ecommerce and still pulling exports manually, you are probably wasting a few hours a week on this.
During that time, you could just set up your first store on Coupler.io. The difference is that you will only have to do it once. Start with your two highest-revenue stores and one ad source. Once that is running, you can scale to the rest.
Stop spending Monday morning reconciling spreadsheets and start using the time for the decisions those spreadsheets are supposed to support.
Get started with Coupler.io for free – no credit card details required.
Get started for free