Yesterday, your Pinterest campaign CTR jumped to 2.8%. Saves climbed, CPC dropped. You doubled the budget. A week later, conversions barely moved. You optimized engagement and cost efficiency, but these metrics did not deserve action to drive revenue.
This is the most common trap in Pinterest Ads analytics. The platform gives you plenty of data, but most of it describes activity inside Pinterest, not marketing impact. Read on to explore a framework for telling the difference and knowing which numbers are worth acting on.
Pinterest Ads Analytics: Native vs custom solutions
The right approach to analyze Pinterest Ads performance depends on the decision you’re trying to make.
Pinterest gives you several ways to look at performance data, but each answers a different type of question. In practice, advertisers rely on two main options:
- Native analytics inside Pinterest Ads Manager
- Custom reporting in spreadsheets or BI tools
Both use the same Pinterest Ads campaign data. The difference lies in how much context you get from it.
Native Pinterest Ads analytics is the fastest starting point. Inside Pinterest Ads Manager, you get everything you need for day-to-day campaign optimization: CTR shifts, pin clicks, outbound clicks, impressions, and engagement.
Native Pinterest Ads analytics works best for operational decisions:
- Which ad group needs adjustments?
- Which creative stopped generating clicks?
- Did engagement drop after changing the audience?
The limitation: Native Pinterest ad reporting shows what happens inside Pinterest, not how the channel contributes to your broader digital marketing performance. Once you need to compare Pinterest Ads against other platforms or measure ROAS across channels, the platform reaches its ceiling.
Custom analytics reporting moves Pinterest Ads data outside the platform into spreadsheets, BI tools, or analytics dashboards. You get custom reports to track Pinterest Ads results alongside Google Analytics, TikTok Ads, ecommerce revenue, and other sources. Instead of evaluating one platform at a time, you start seeing how Pinterest fits into your overall marketing strategy.
Coupler.io handles this by automating data flows from Pinterest Ads. You can create live analytics reports in Google Sheets, design dashboards in Looker Studio or Power BI, or even analyze your Pinterest Ads in AI. Because Coupler.io connects to 400+ data sources, you can build cross-channel reports that combine Pinterest Ads with other ad platforms, ecommerce tools, or financial data in a single dashboard.
In addition to all the above, you can use ready-made dashboard templates to start analyzing Pinterest ads metrics in minutes without building reports from scratch.
Automate Pinterest Ads analytics and reporting with Coupler.io
Get started for freeCustom Pinterest Ads reporting with Coupler.io
Pinterest Ads Manager presents data through predefined views. With custom Pinterest Ads reporting in Coupler.io, you restructure that data around the questions your business actually needs to answer.
Create live dashboards in spreadsheets and BI tools
No need to download CSV files and rebuild Pinterest Ads reports every week. Simply connect your Pinterest Ads account to Coupler.io, which will automatically refresh data in your custom report in Google Sheets or Looker Studio.

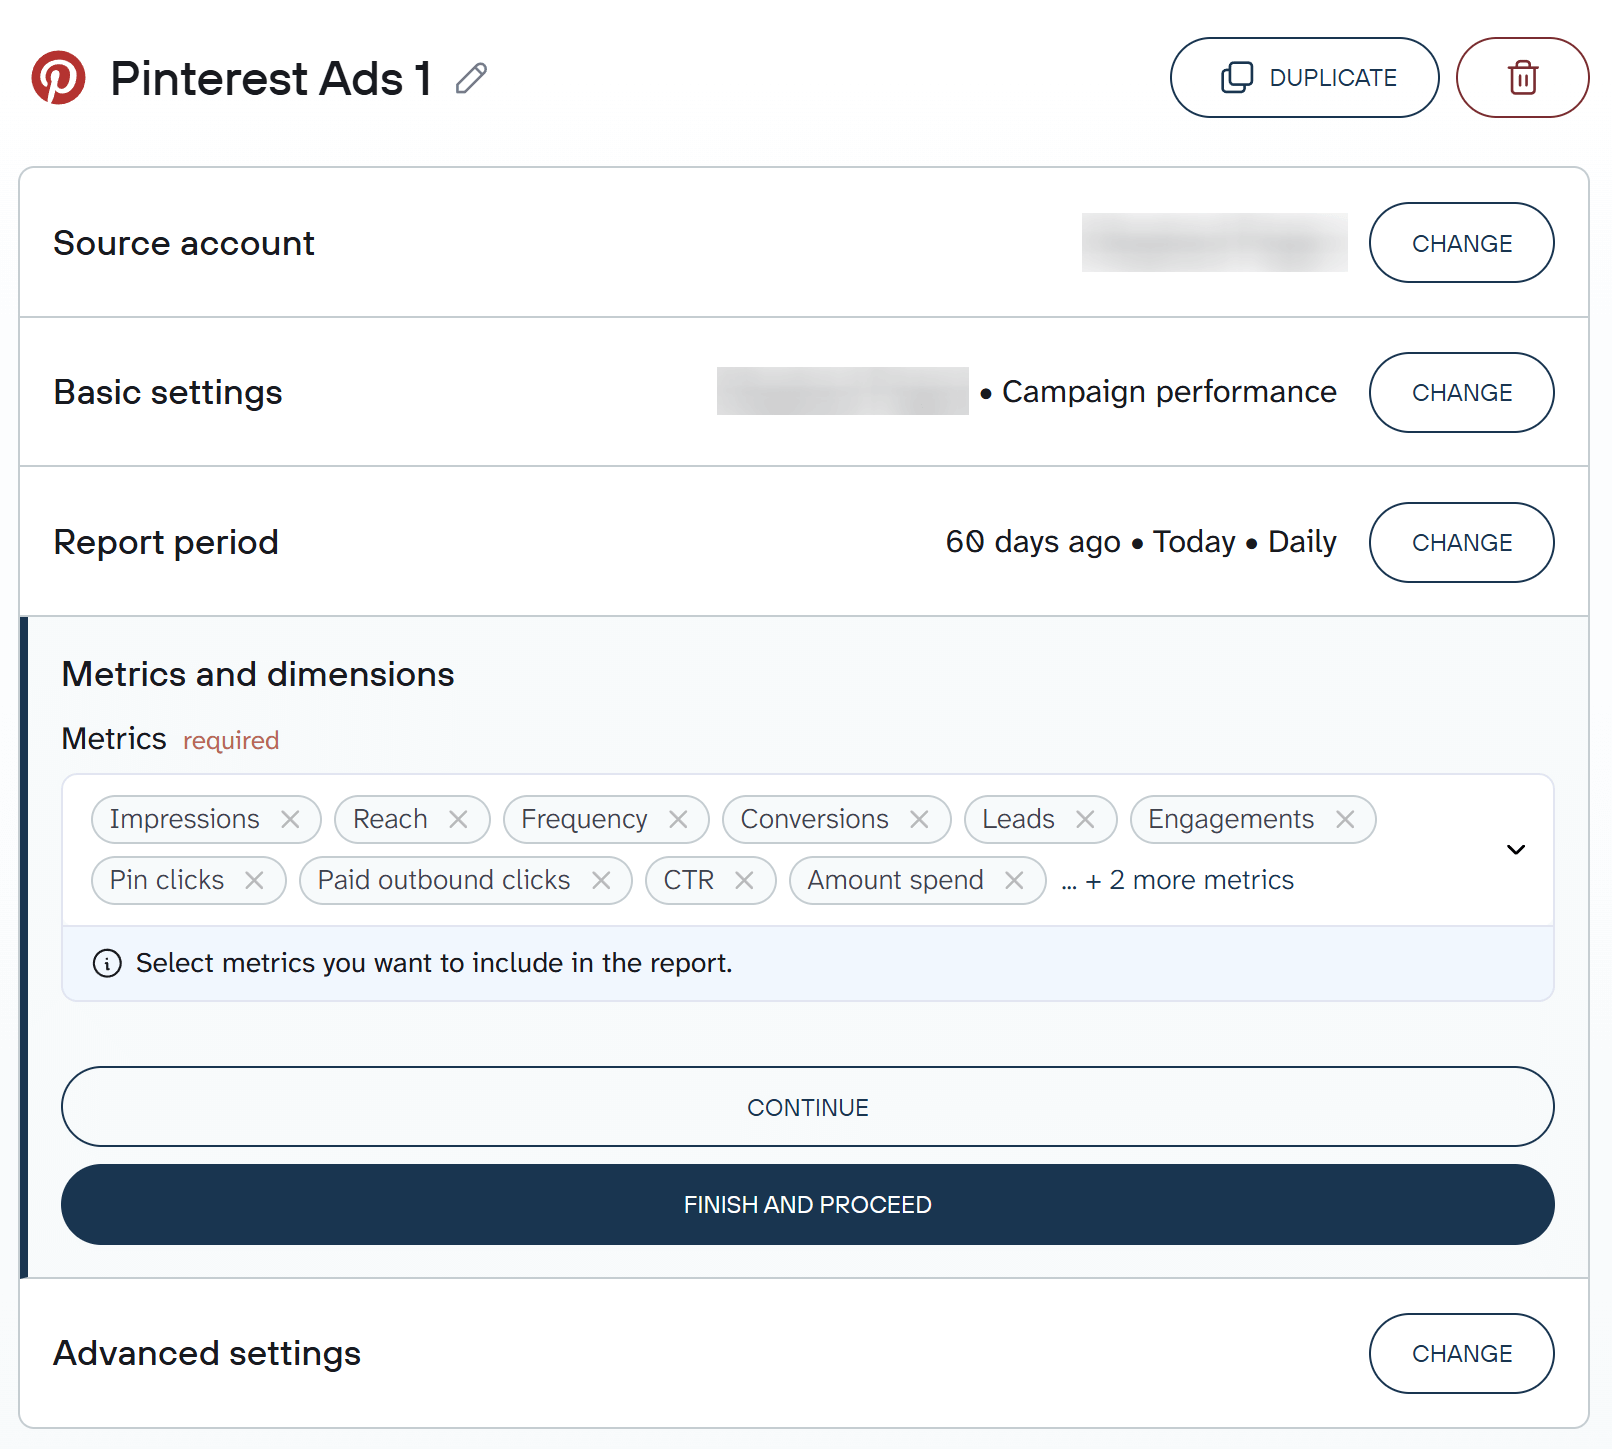
Key metrics like Pinterest ads impressions, clicks, CTR, CPC, conversions, CPA, and ROAS update on a schedule you control, from every day to every 15 minutes.
Your dashboard becomes a live reporting environment. You open it, and the latest performance data is already there.
Try out the Pinterest Ads connector right away for free. Choose the desired reporting tool or destination in the form below and click Proceed. Sign up for free with no credit card required and create your first data flow.

See Pinterest performance in the context of your entire marketing strategy
If you run Pinterest Ads, you’re almost certainly running campaigns on Meta, Google Ads, or TikTok too, while tracking site activity in Google Analytics. Each platform reports inside its own dashboard.
- Pinterest shows pin clicks, saves, and outbound clicks.
- Google Analytics shows sessions and landing page engagement.
- Meta reports impressions, CPC, and conversions.
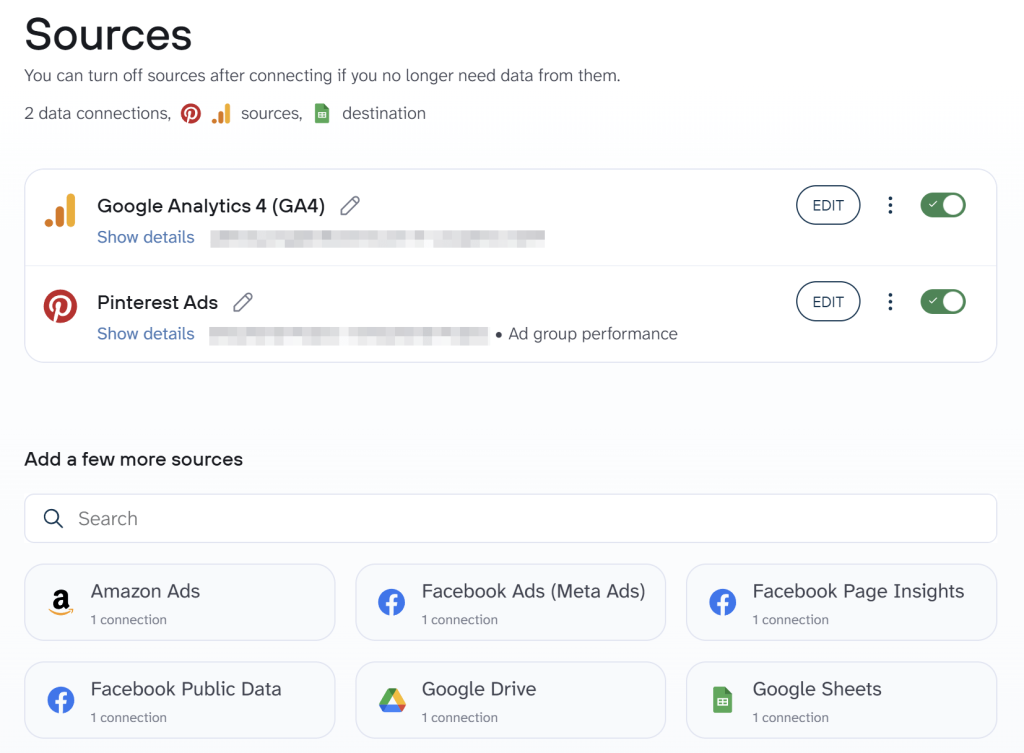
The customer journey sits somewhere between those tools. Coupler.io brings data from Pinterest Ads and 400+ other sources into one dataset. There are two options for this:
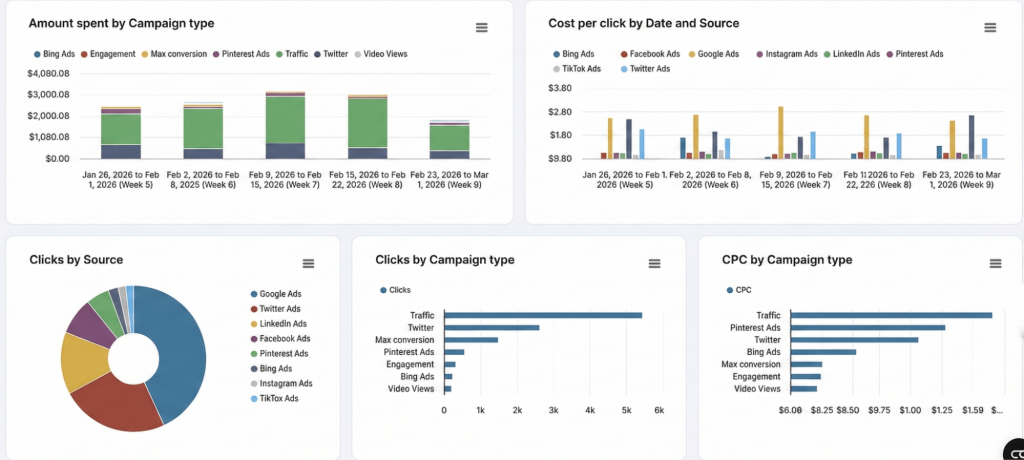
Append merges campaign data from different platforms into one table. Each row represents a campaign with shared metrics like impressions, clicks, CTR, CPC, and spend aligned automatically. You open one table and immediately compare how Pinterest campaigns perform against Meta, Google Ads, or TikTok. Or turn this data into charts for better insights, like this:

Join connects datasets on a shared field to reveal what happens after the click. For example, you can combine Pinterest Ads data with Google Analytics sessions to see how Pinterest traffic behaves once it reaches your landing page.

Coupler.io processes and transforms data before it reaches your BI tool. This matters because native blending in tools like Looker Studio is prone to timeout errors on complex cross-platform dashboards. The heavy lifting happens upstream, so your dashboard loads cleanly.
Analyze Pinterest Ads data with AI
Most people review Pinterest Ads analytics the same way: open the dashboard, scroll through metrics, export a report, and compare numbers manually.
You don’t actually want to check CTR or outbound clicks in isolation. You want to know:
- Why did CPA increase this month?
- Which Pinterest ad campaign generated the highest ROAS last quarter?
- Which ad group drives outbound clicks but does not convert?
- Which audiences show declining CTR?
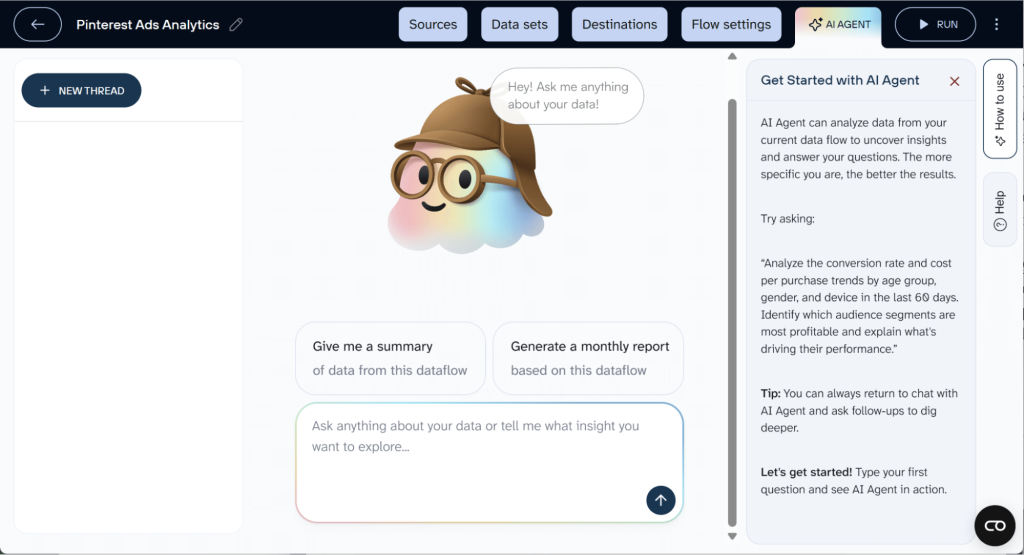
With Coupler.io, you ask the question directly using the built-in AI Agent. It translates your question into a structured query, runs the calculation through Coupler.io’s analytical engine, and returns results based on your actual performance data.
The built-in AI Agent analyzes the dataset connected to your account. When you ask a question, the system translates it into a structured query, runs the calculation through Coupler.io’s analytical engine, and returns results based on your actual performance data.

You can also connect your Pinterest Ads data to Claude, ChatGPT, or other AI tools through Coupler.io AI integrations if you prefer working outside the platform.
Create scalable client reports
Reporting complexity increases quickly when you manage more than one Pinterest Ads account. Each account produces its own reports, naming conventions, and date ranges. A simple performance overview turns into a pile of spreadsheets stitched together every week. And 73% of marketers say clients request weekly ad hoc reports on top of that.
Coupler.io pulls data from multiple Pinterest business accounts into a single structured dataset. Campaign data from different accounts follows the same schema, refresh schedule, and metric definitions. You build one standardized dashboard that tracks performance across clients or brands, and updates itself.

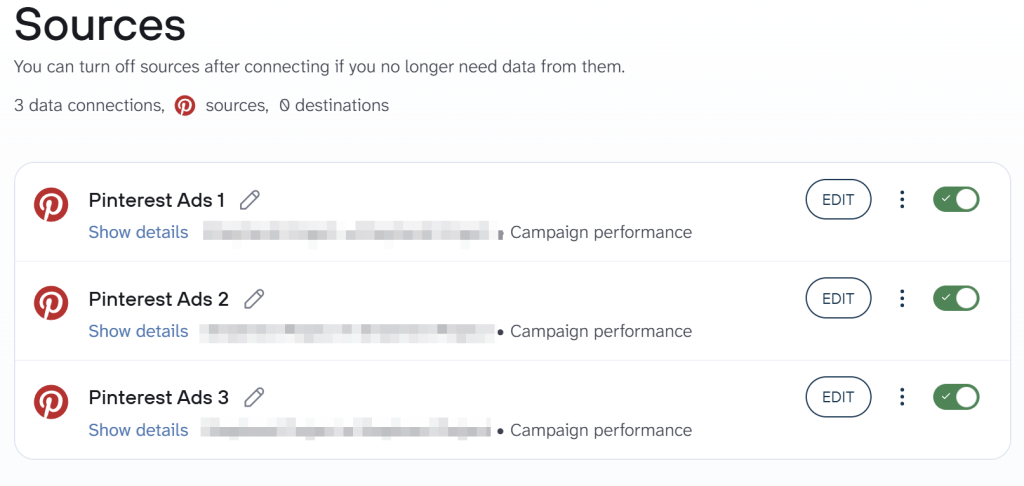
Reporting stops being a weekly production task. Teams focus on interpreting data and optimizing campaigns instead of assembling reports.
Analyze Pinterest Ads data with Coupler.io
Get started for freeReady-to-use Pinterest Ads dashboards for a better overview
If you want deeper insight without building reports from scratch, ready-made Pinterest Ads dashboards are the fastest path. Here are three templates from Coupler.io to measure Pinterest Ads performance.
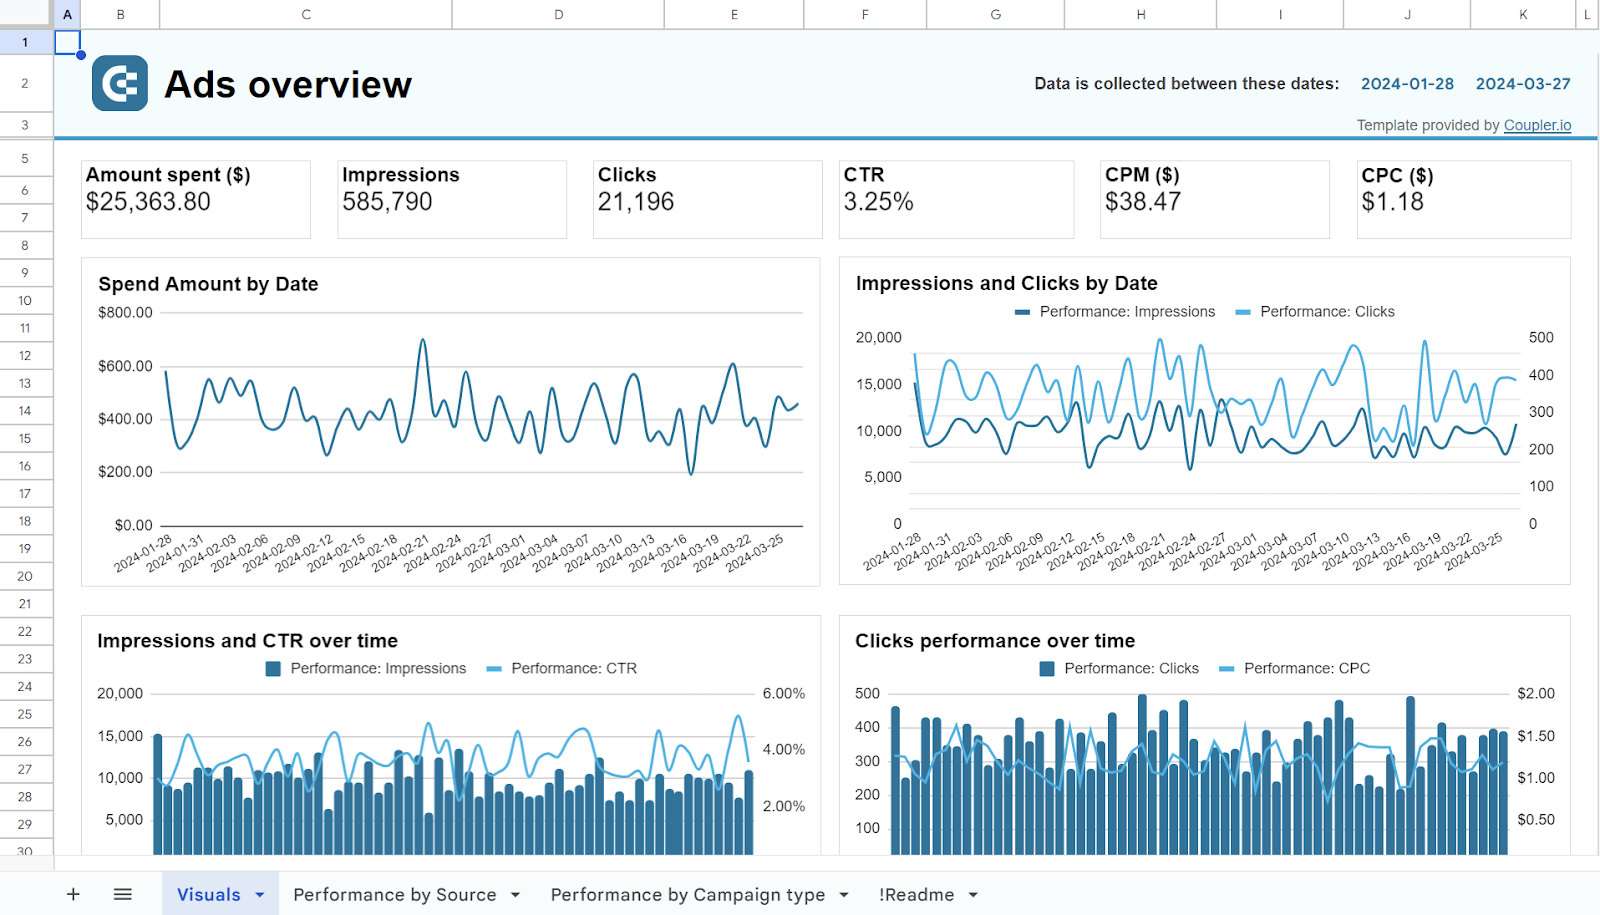
1. Pinterest Ads dashboard
This dashboard answers a simple question: Are my Pinterest ad campaigns improving or deteriorating?
It provides a clear overview of campaign health by showing your core performance metrics in one place. You can see impressions, number of clicks, CTR, CPC, conversions, and engagement signals such as saves and repins. Instead of navigating several tables in Pinterest Ads Manager, you immediately see how visibility, engagement, and cost efficiency evolve across your campaigns.

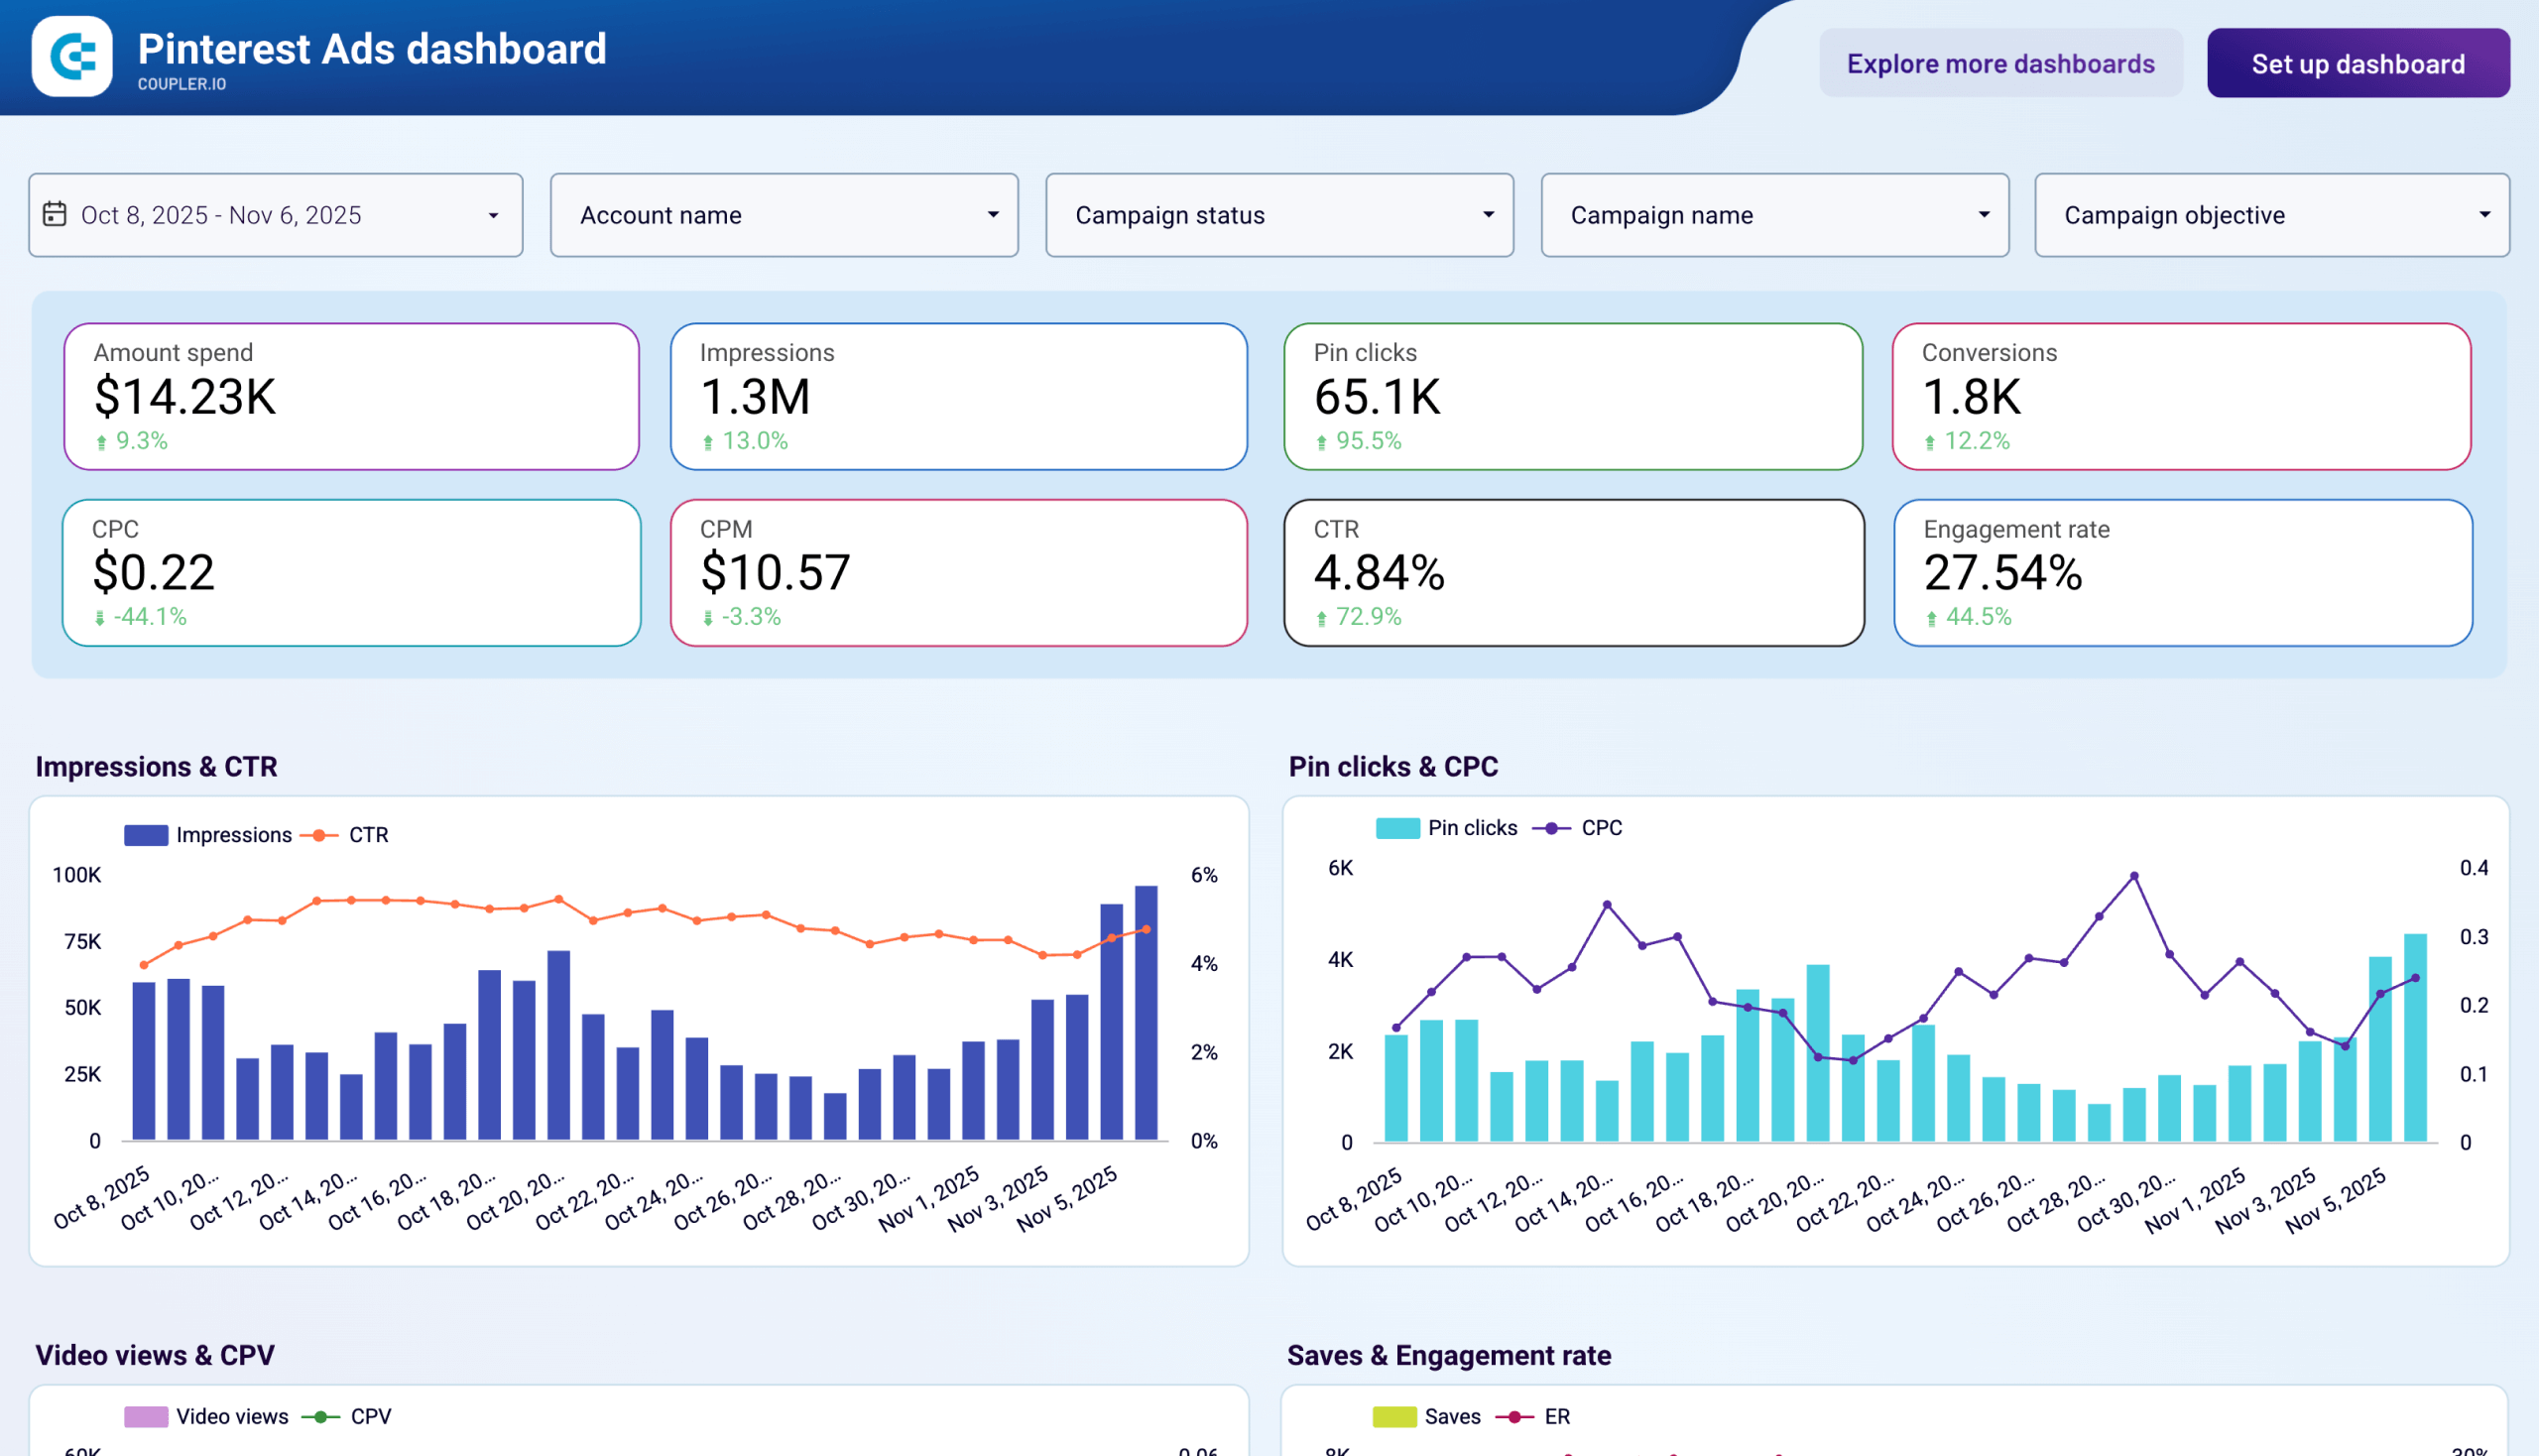
The dashboard is particularly useful when checking weekly performance. It quickly reveals which campaigns generate the most pin clicks, which creatives drive strong Pinterest Ads engagement metrics, and whether traffic costs are increasing.
Because it’s a ready-made Looker Studio template, setup takes only a few minutes. You connect your Pinterest business account, and Coupler.io automatically loads your Pinterest Ads data into the dashboard and keeps it updated.
2. Pinterest Ads monthly dashboard
Daily metrics help you optimize campaigns, but monthly reporting reveals something more important: long-term performance trends.
This dashboard aggregates campaign performance by month, making it easier to evaluate how your Pinterest ad campaigns evolve over time. Instead of focusing on daily fluctuations, you can analyze whether impressions grow consistently, whether CTR improves as creatives mature, and how return on ad spend (ROAS) develops as campaigns scale.
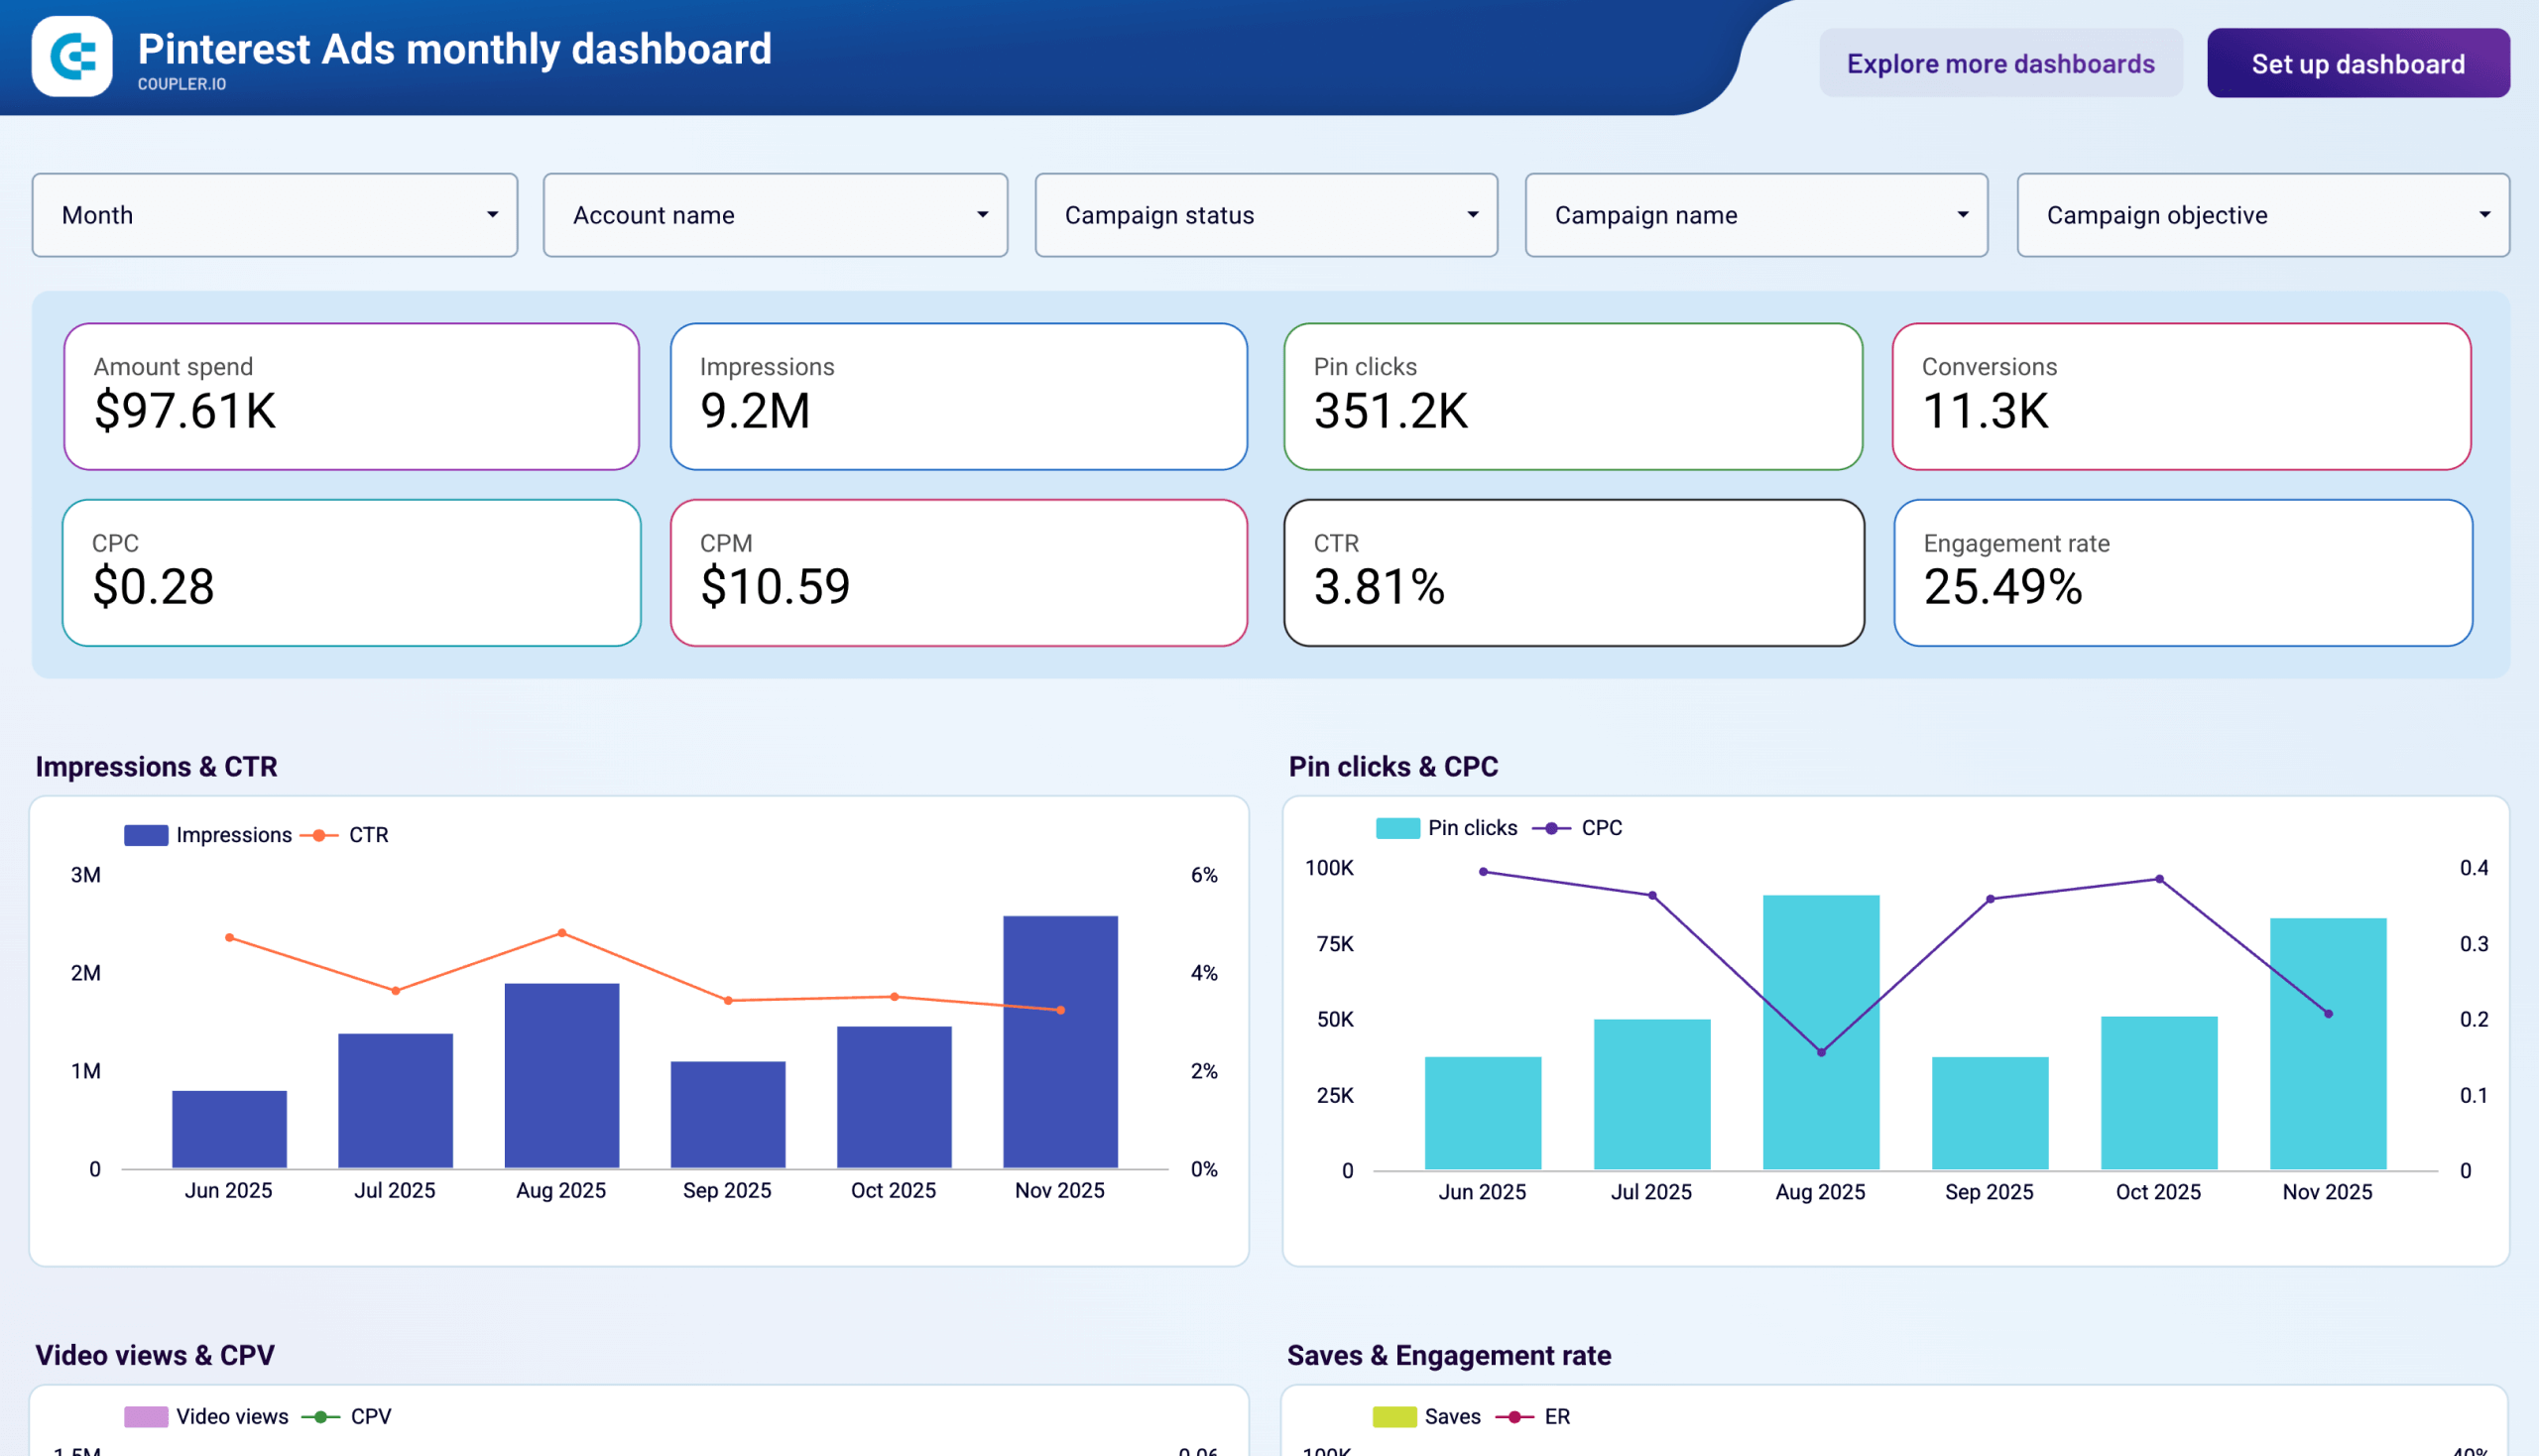
It’s the view you want to track Pinterest Ads performance with leadership or planning budgets for the next quarter. It helps me see whether increased spend actually leads to more conversions, whether engagement metrics improve month over month, and which campaigns consistently deliver results.
Like the previous example, this dashboard is a Looker Studio template that connects directly to your Pinterest Ads account through Coupler.io and updates automatically.
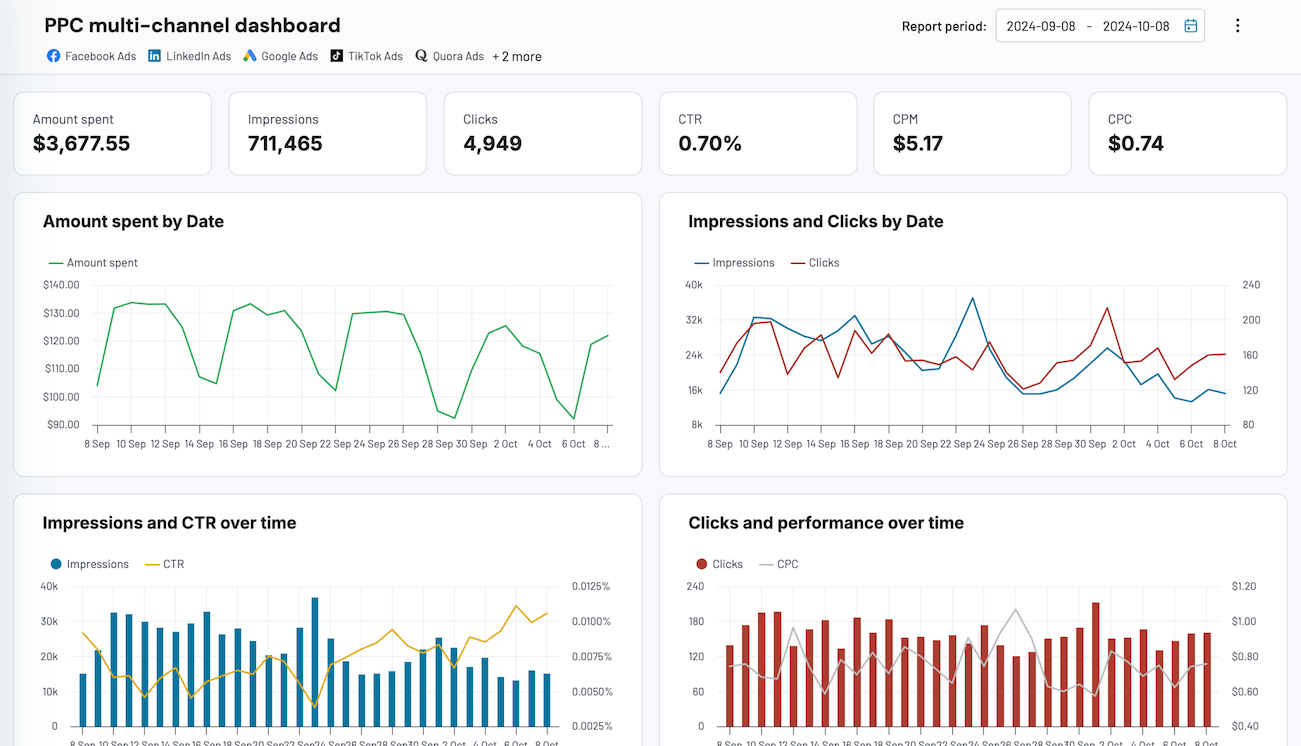
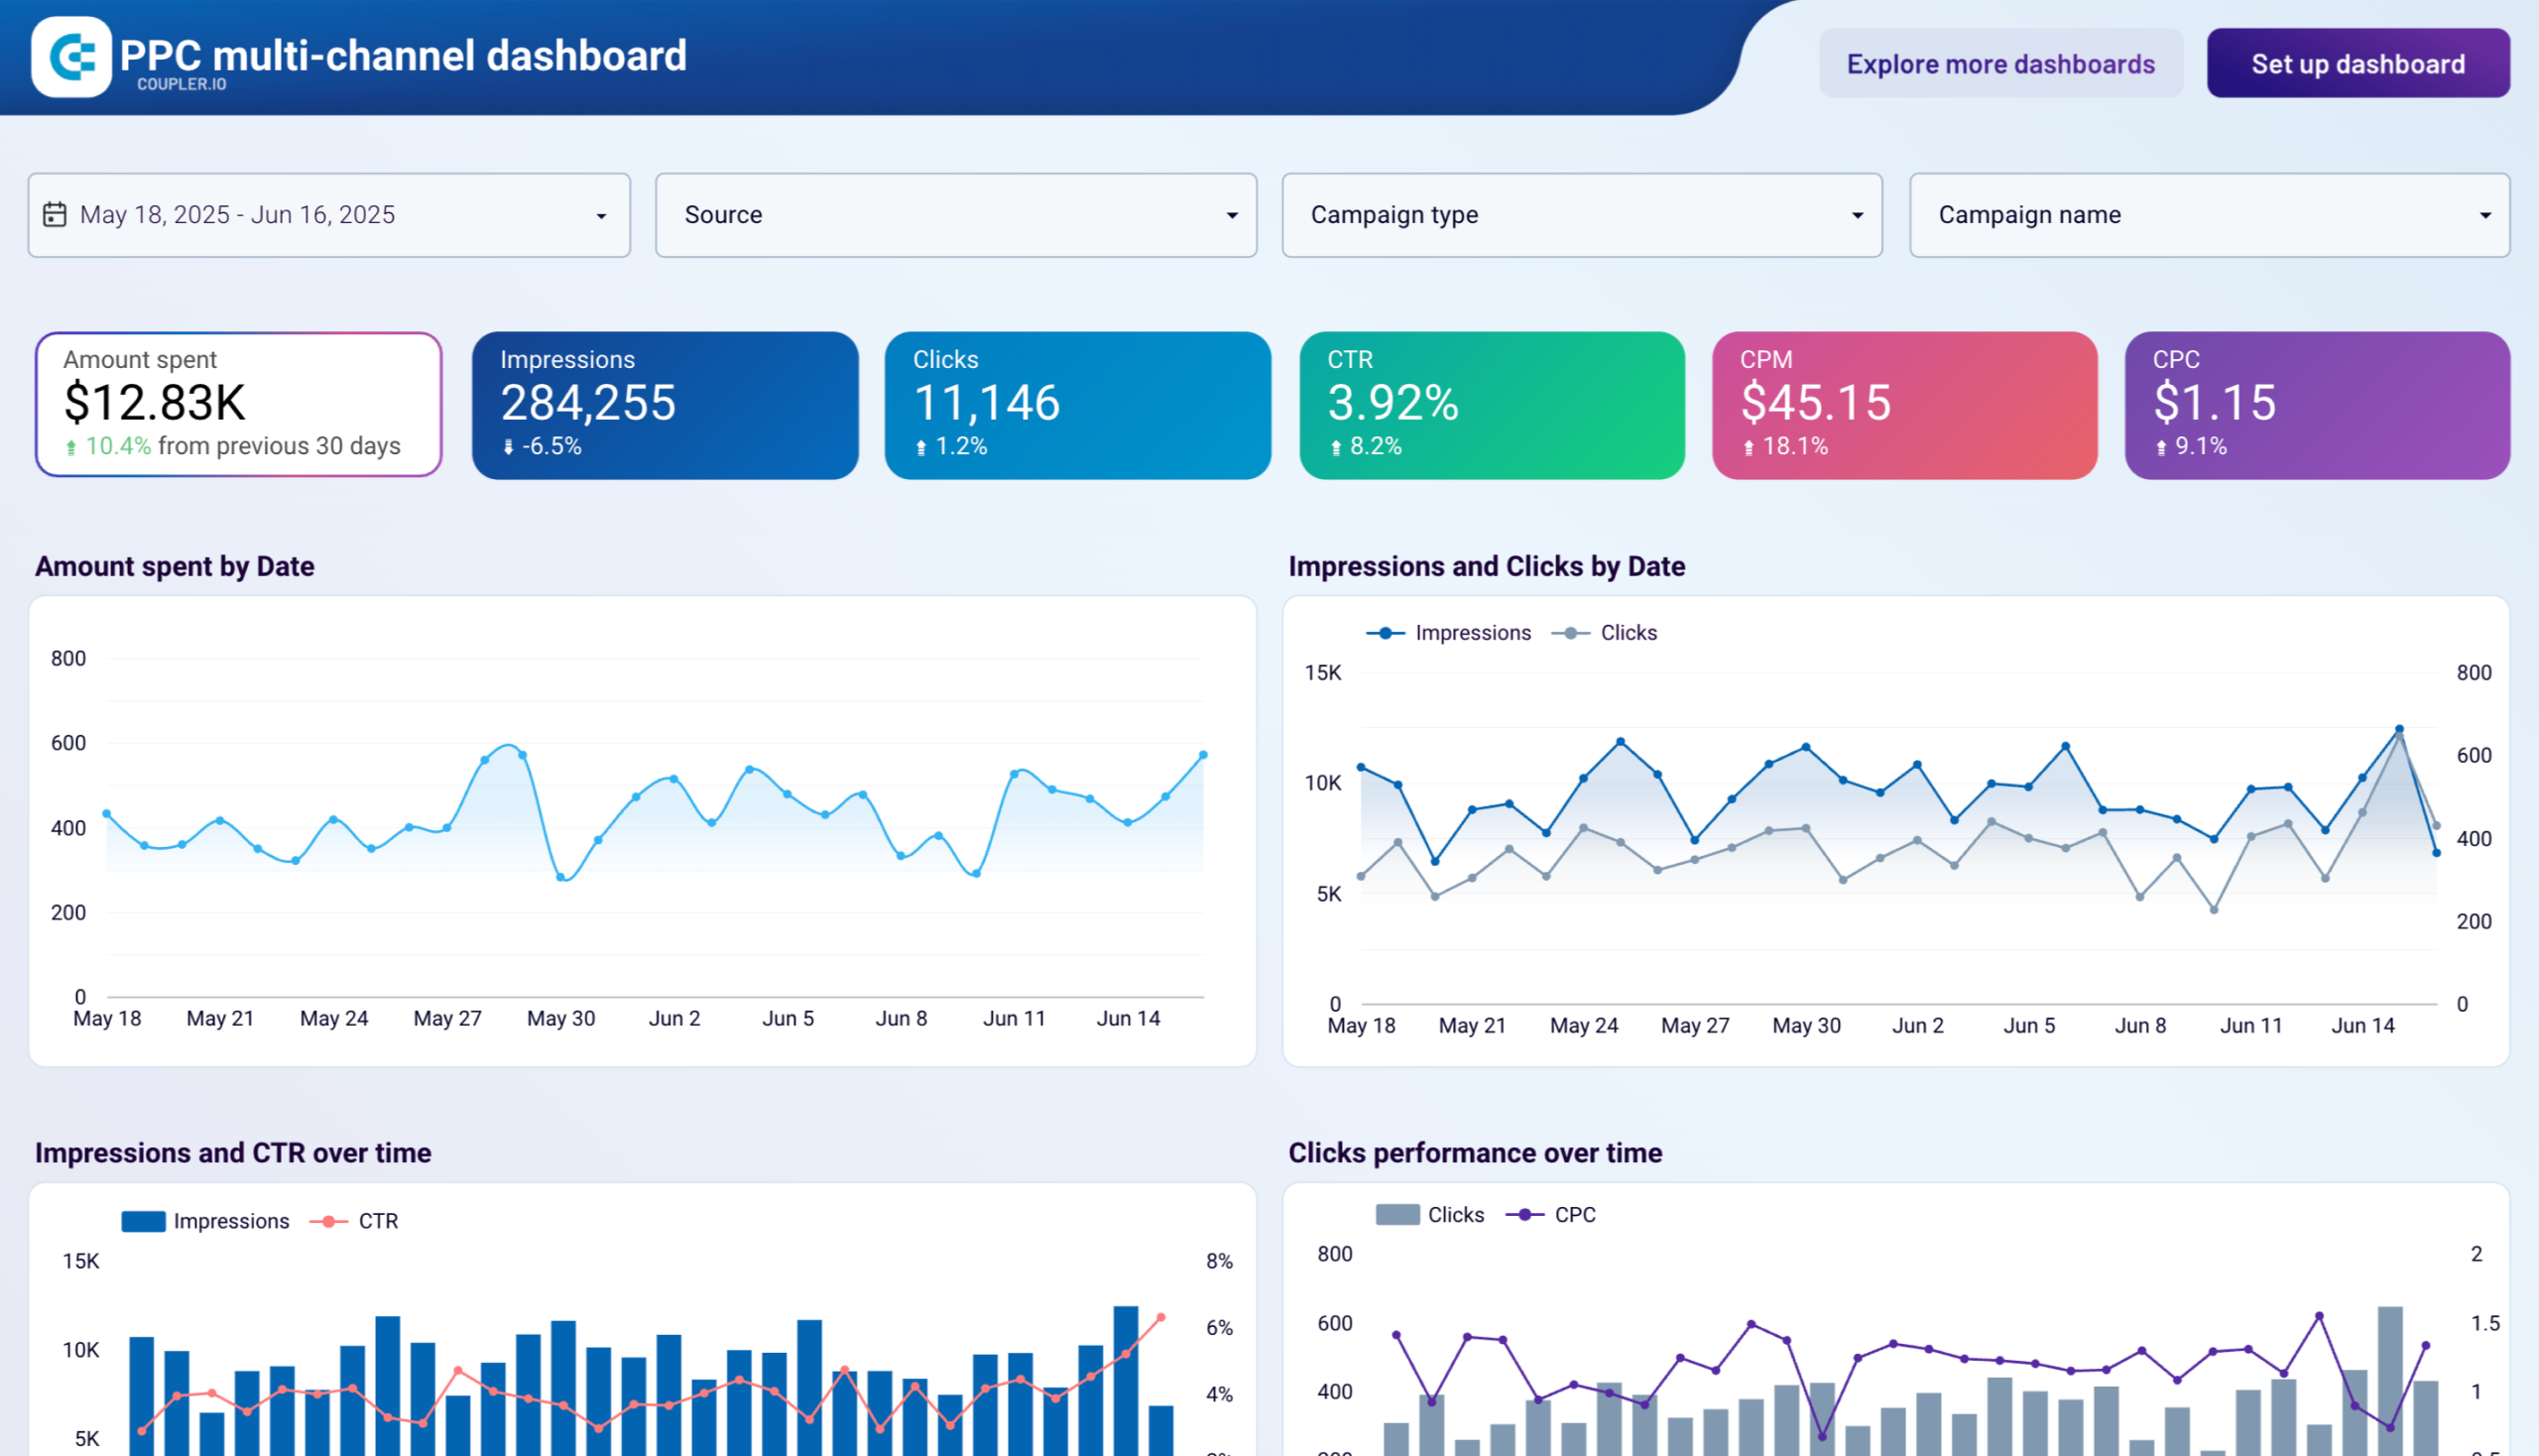
3. PPC multi-channel dashboard
Pinterest Ads rarely operate alone in a social media advertising strategy.
Most brands run campaigns across several platforms (Pinterest, Google Ads, Meta, or TikTok), each generating its own performance data. Reviewing those dashboards separately makes it difficult to understand which platform actually drives results.
This multi-channel PPC dashboard solves that problem by bringing campaign data from multiple advertising platforms into one reporting view.


Instead of evaluating Pinterest in isolation, you compare metrics such as impressions, number of clicks, CTR, CPC, and conversions across platforms. This quickly reveals which channels drive the most outbound clicks, which campaigns generate the strongest ROAS, and where budget adjustments might improve overall performance.
I find this dashboard helpful when deciding where to allocate budget across channels. It immediately shows whether Pinterest drives efficient traffic compared with Meta or Google, and whether Pinterest ad campaigns contribute meaningfully to the overall acquisition strategy.
Coupler.io provides this dashboard directly inside the platform as well as a template in Google . Once you connect your advertising accounts, the data updates automatically, giving you a unified view of your PPC performance without switching between ad managers.

PPC multi-channel dashboard
Consolidate data from multiple advertising platforms including Google, Facebook, LinkedIn, TikTok, and more to track campaign performance, analyze spend efficiency, and optimize your PPC budget allocation across channels.


PPC multi-channel dashboard in Google Sheets
Use a PPC dashboard designed for Google Sheets to track the performance of your campaigns across multiple advertising platforms.
PPC multi-channel dashboard in Looker Studio
Get a comprehensive PPC reporting tool to track the performance of your campaigns launched at multiple advertising platforms.


PPC multi-channel dashboard in Power BI
Use a Power BI PPC dashboard for tracking and analyzing your advertising campaigns across multiple platforms.

PPC multi-channel dashboard in Tableau
Track and analyze the performance of your advertising campaigns across various platforms using a one-stop PPC dashboard in Tableau
How to analyze performance with Pinterest Ads Manager
Most advertisers start their analysis inside Pinterest Ads Manager. It’s the fastest way to understand what’s happening with your campaigns and spot problems early.
I usually open Ads Manager when I want to answer operational questions such as:
- Which Pinterest ad campaigns are losing momentum?
- Which creatives stopped generating pin clicks?
- Did CTR drop after changing targeting?
- Are outbound clicks translating into conversions?
Pinterest’s native analytics does a good job of showing these performance signals. But it’s important to treat it as a campaign optimization tool, not a full marketing analytics platform.
Here’s how I usually navigate the Pinterest Ads reporting environment:
Analytics Overview
Start here for a quick snapshot of performance across your selected date range. Scan for early warning signals: impressions rising while outbound clicks stay flat, engagement suddenly dropping, or a spike caused by a new creative.

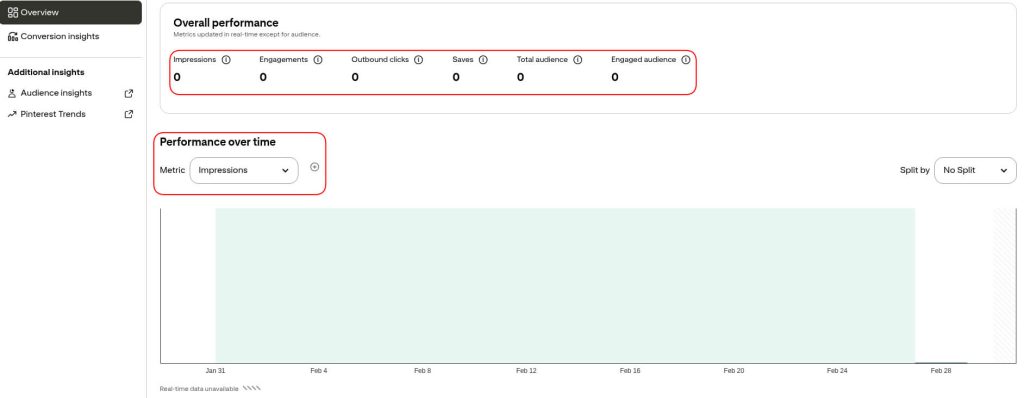
The Top Pins section shows which promoted Pins generate the most impressions, engagement, or clicks. If something works there, it’s usually a good candidate to scale in your campaigns.
Ad Reporting for deeper campaign analysis
This is where you break performance down. Pinterest Ads lets you analyze results at five levels: campaigns, ad groups, product groups, ads, and keywords.
Start at the campaign level to compare overall efficiency — impressions, CTR, pin clicks, CPC, and outbound clicks. This shows which campaigns deserve more budget and which ones are losing traction.

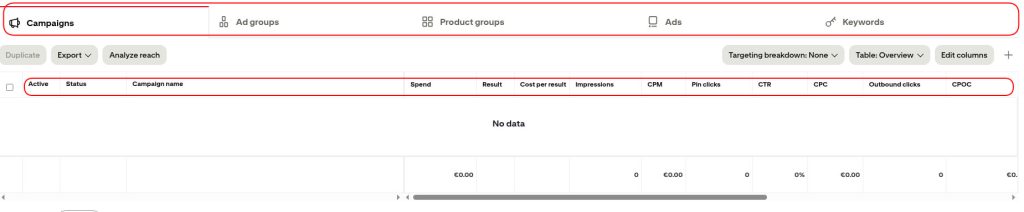
Then move to the ad group level to understand targeting performance. If CTR drops or CPC rises, this is usually where the issue becomes clear.
Check the ads level to compare individual creatives. This is where it becomes obvious which images, video Pins, or calls-to-action actually drive engagement and traffic.
For e-commerce campaigns, review product group performance to see which product categories generate the strongest return on ad spend (ROAS).
Custom ads reports
When the built-in views aren’t enough, Custom Ads Reports let you combine multiple metrics into one report at the campaign, ad group, or ad level. For example, you might track impressions, pin clicks, video views, and conversions for a specific campaign across a custom date range.

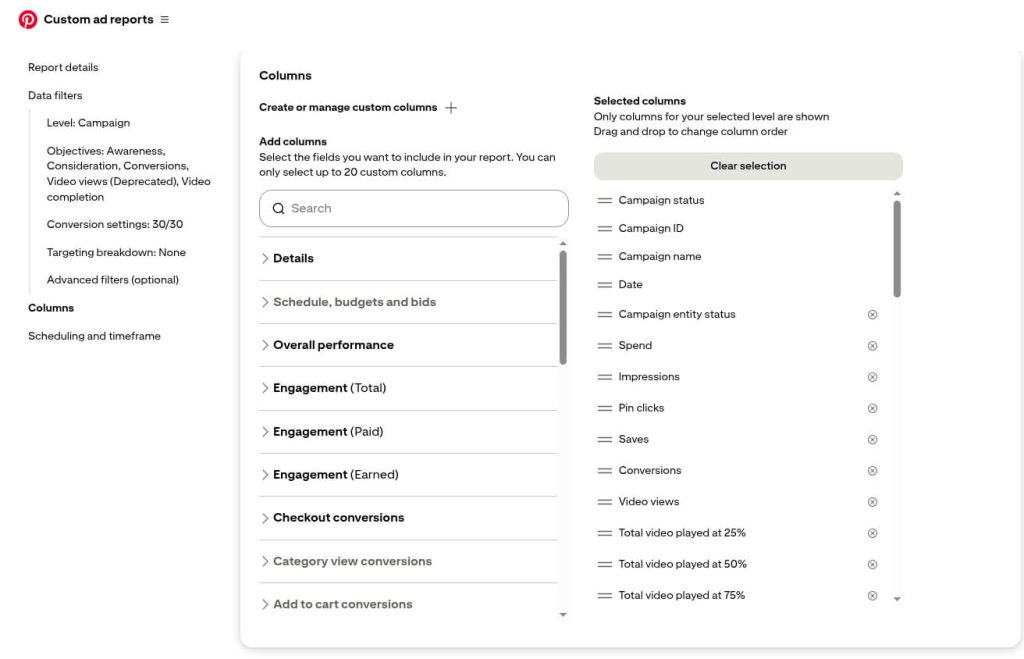
These reports make it easier to analyze Pinterest Ads data without exporting it immediately.
But even with these options, native reporting still focuses on what happens inside Pinterest. Once you need cross-channel insights or deeper Pinterest Ads performance analysis, the data needs to move outside the platform.
Limitations of the native Pinterest Ads Manager
Pinterest Ads Manager is strong for tactical optimization inside the platform. However, its analytical scope remains confined to Pinterest.
You see activity, not always impact
A campaign shows strong engagement metrics. Saves increase, repins climb, and CTR improves.
But traffic on your landing page barely changes.
Pinterest’s native analytics focuses heavily on platform interactions. Metrics like saves, closeups, and total engagements signal interest, but they don’t always translate into driving traffic or revenue. Without connecting Pinterest data to Google Analytics or your e-commerce platform, it’s difficult to know whether those interactions actually contribute to your business goals.
Data lives inside Pinterest
Pinterest often runs alongside Google Ads, Meta, or TikTok as part of a broader social media and digital marketing strategy.
Pinterest Ads Manager doesn’t show how these channels work together.
You can analyze impressions, number of clicks, CTR, and return on ad spend (ROAS) for Pinterest campaigns, but you cannot compare them with other channels in the same view. Calculating blended CPA, total paid media spend, or cross-channel ROAS requires exporting Pinterest Ads data and combining it with other datasets.
Reporting quickly becomes spreadsheet work
As campaigns scale, reporting inside Pinterest often turns into a repetitive workflow.
Teams download CSV reports, adjust the date range, merge campaign exports, and rebuild charts in spreadsheets. For agencies or teams managing multiple Pinterest business accounts, that process repeats every week.
That’s where many teams change their workflow. Instead of exporting reports manually, they connect their Pinterest Ads account to a BI or data visualization platform using a tool like Coupler.io. This way, analysis starts with fresh data instead of file exports.
Native dashboards only go so far
Pinterest Ads Manager relies on predefined tables and column views. You can adjust filters or add metrics, but building fully tailored dashboards is difficult.
For example, you might want one view that shows pin clicks, outbound clicks, video views, conversions, and ROAS across several campaigns and ad groups. You might also want to combine those metrics with Google Analytics sessions or ecommerce revenue.
Native reporting simply wasn’t designed for that type of analysis. It’s built to help you optimize Pinterest ad campaigns, not to serve as a complete marketing analytics environment.
Once those questions appear, most teams move their reporting outside the platform.
Most important Pinterest Ads KPIs to monitor
When reviewing Pinterest performance, focus on the metrics that explain three things: visibility, engagement, and business results.
The table below shows the most important metrics, what they reveal about campaign performance, and the common mistakes to avoid when interpreting them:
| Metric | What it tells you | What it doesn’t tell you |
| Impressions | How often your ad appears in Pinterest feeds or search results. Falling impressions often indicate bid pressure, audience restrictions, or budget limits. | High impressions alone don’t mean success. If CTR or outbound clicks remain low, the campaign generates visibility without real engagement. |
| Pin clicks | Whether the creative captures attention and encourages interaction. | Pin clicks don’t necessarily mean users visit your website. Some users interact with the Pin but never leave Pinterest. |
| Outbound clicks | The number of users who actually leave Pinterest and visit your landing page. The strongest indicator of traffic generated by Pinterest Ads. | Traffic alone doesn’t guarantee success. If conversions stay low, the problem likely sits on the landing page or product offer. |
| CTR (Click-through rate) | How relevant your creative and targeting are. Declining CTR signals ad fatigue, weak messaging, or audience mismatch. | CTR varies by format and placement. Video Pins and shopping creatives often behave differently from standard Pins. |
| Saves (Repins) | Product interest or visual appeal. Saves often signal intent to revisit later — a behavior unique to Pinterest’s discovery-driven model. | Saves reflect discovery behavior typical of Pinterest. They don’t always translate into immediate purchases. |
| CPC (Cost per click) | Auction competition and traffic acquisition efficiency. Rising CPC without proportional CTR improvement signals declining relevance or growing competition. | Average CPC can hide inefficient campaigns if some ad groups generate significantly more expensive clicks. |
| CPM (Cost per thousand impressions) | The cost of reaching audiences at scale. Rising CPM often signals stronger competition or narrower targeting. | Lower CPM doesn’t automatically mean better performance if impressions come from less relevant audiences. |
| Conversions | Whether campaigns drive actual business actions — purchases, sign-ups, leads — measured through the Pinterest tag. | Conversion numbers depend entirely on accurate tracking. If the Pinterest tag or event configuration breaks, results become misleading. |
| ROAS (Return on ad spend) | Revenue generated for every dollar spent. Connects campaign performance to real business results. | ROAS often ignores longer purchase journeys or repeat purchases, which can underestimate Pinterest’s contribution to revenue. |
The most useful insights rarely come from a single metric. A few patterns appear frequently in Pinterest Ads data:
- High impressions + low CTR → creative relevance problem
- High CTR + low conversions → landing page or offer friction
- Rising CPC + stable CTR → increasing auction competition
- Strong saves + weak outbound clicks → visual interest but weak calls-to-action
Native vs custom Pinterest Ads reporting
Pinterest Ads Manager answers one question extremely well: how are my campaigns performing inside Pinterest?
For day-to-day optimization, native Pinterest analytics works perfectly.
But marketing decisions rarely stop at one platform. The moment you ask “which channel drives the best ROAS?” or “where should we increase budget next month?” the native dashboard runs out of answers.
Native reporting helps you optimize campaigns.
Custom reporting helps you understand marketing performance.
The teams that scale Pinterest marketing successfully don’t choose one or the other. They use both: Pinterest Ads Manager for fast campaign diagnostics, and Coupler.io for custom Pinterest Ads analytics to automate reporting, compare channels, and make smarter budget decisions.