Looker Studio allows you to turn your Shopify data into visual dashboards that answer key questions: Which products drive revenue? Where do customers drop off? Are your ads profitable? Below are the best Shopify Looker Studio templates to analyze your store without building reports from scratch.
Our pick of the best Shopify Looker Studio templates
Here are templates to quickly and easily create Looker Studio reports for Shopify stores.
1. Shopify inventory dashboard template by Coupler.io
The Shopify inventory dashboard template is designed to help you optimize your stock management, identify high-velocity products, and streamline inventory to prevent costly stockouts and overstock.

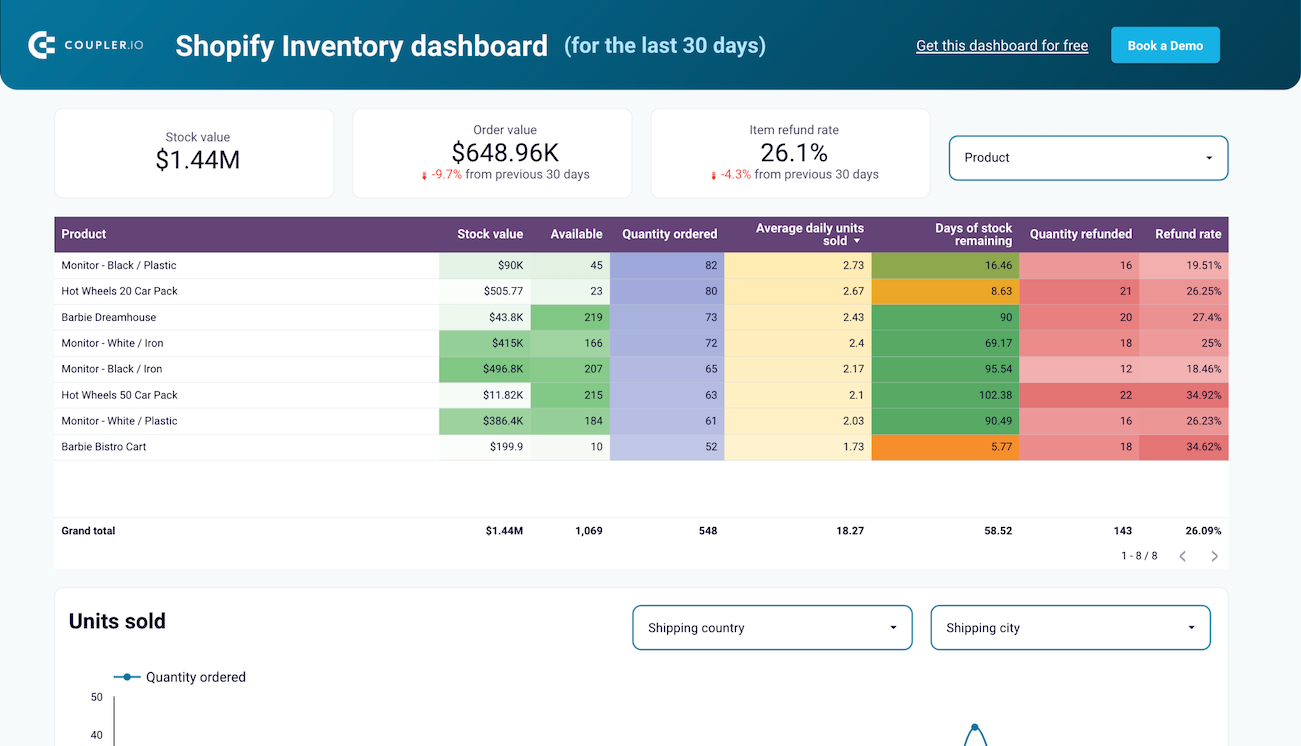
Furthermore, the template offers granular filtering by both country and city. You have the option to apply these geographic filters to units sold, multi-location inventory data, stock availability, and return quantity rates.
If you ship products from multiple locations, this Shopify inventory template for Looker Studio empowers you to keep tabs on stock availability across various locations.
Key insights offered
- Visibility into stock value, items on hand, and days of stock remaining
- Detailed breakdown of which products are driving revenue
- Identification of dead stock
- Visual indication of which products need replenishing
Key metrics displayed
- Stock value, order value, and return quantity rate (overall and individual products)
- Daily units sold by shipping country and city
- Return quantity rate by country and city
- Stock availability by location
All Shopify dashboards by Coupler.io have a built-in Shopify data connector. To get started, you just have to connect your Shopify account. It’ll automate data transfers and keep your dashboard live with real-time inventory updates automatically.
2. Shopify orders dashboard template by Coupler.io
The Shopify orders dashboard template assists you in understanding your store’s financial performance. You can track key metrics, such as total sales, orders, average order value, and customers.
What’s more, use this template to analyze custom acquisition channels and geographical distribution to make informed business decisions.

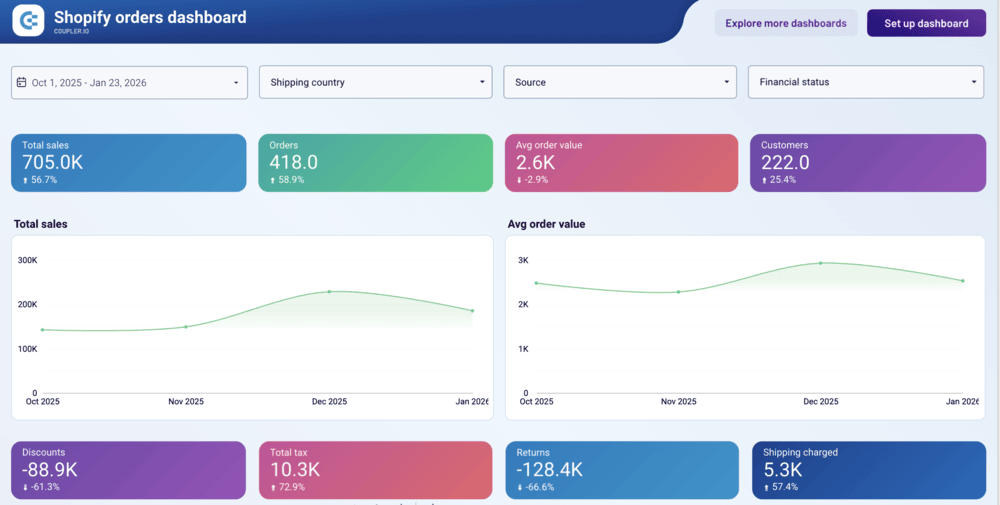
Key insights offered
- A quick snapshot of vital financial metrics, such as total sales, orders, average order value, and customers
- Information on financial deductions and costs, including discounts, total tax, returns, and shipping charges
- Breakdown of revenue by acquisition channel to help you know the most profitable stream
- Geographical performance overview for regional market analysis
Key metrics displayed
- Total sales, orders, average order value, and customers
- Discounts, total tax, returns, and shipping charges
- Sales by source, shipping country, and shipping city
This template has a built-in Coupler.io connector. You have to connect your Shopify account to populate the dashboard with your data in just a few minutes.
3. Shopify marketing funnel analytics dashboard template by Coupler.io
If you run ad campaigns to attract customers, use this marketing dashboard template to get a unified view of your entire customer acquisition journey.
Whether you are running PPC on Google or scaling on TikTok and LinkedIn, this template simplifies multi-channel attribution. So it becomes easy to evaluate the true ROI of your spend.

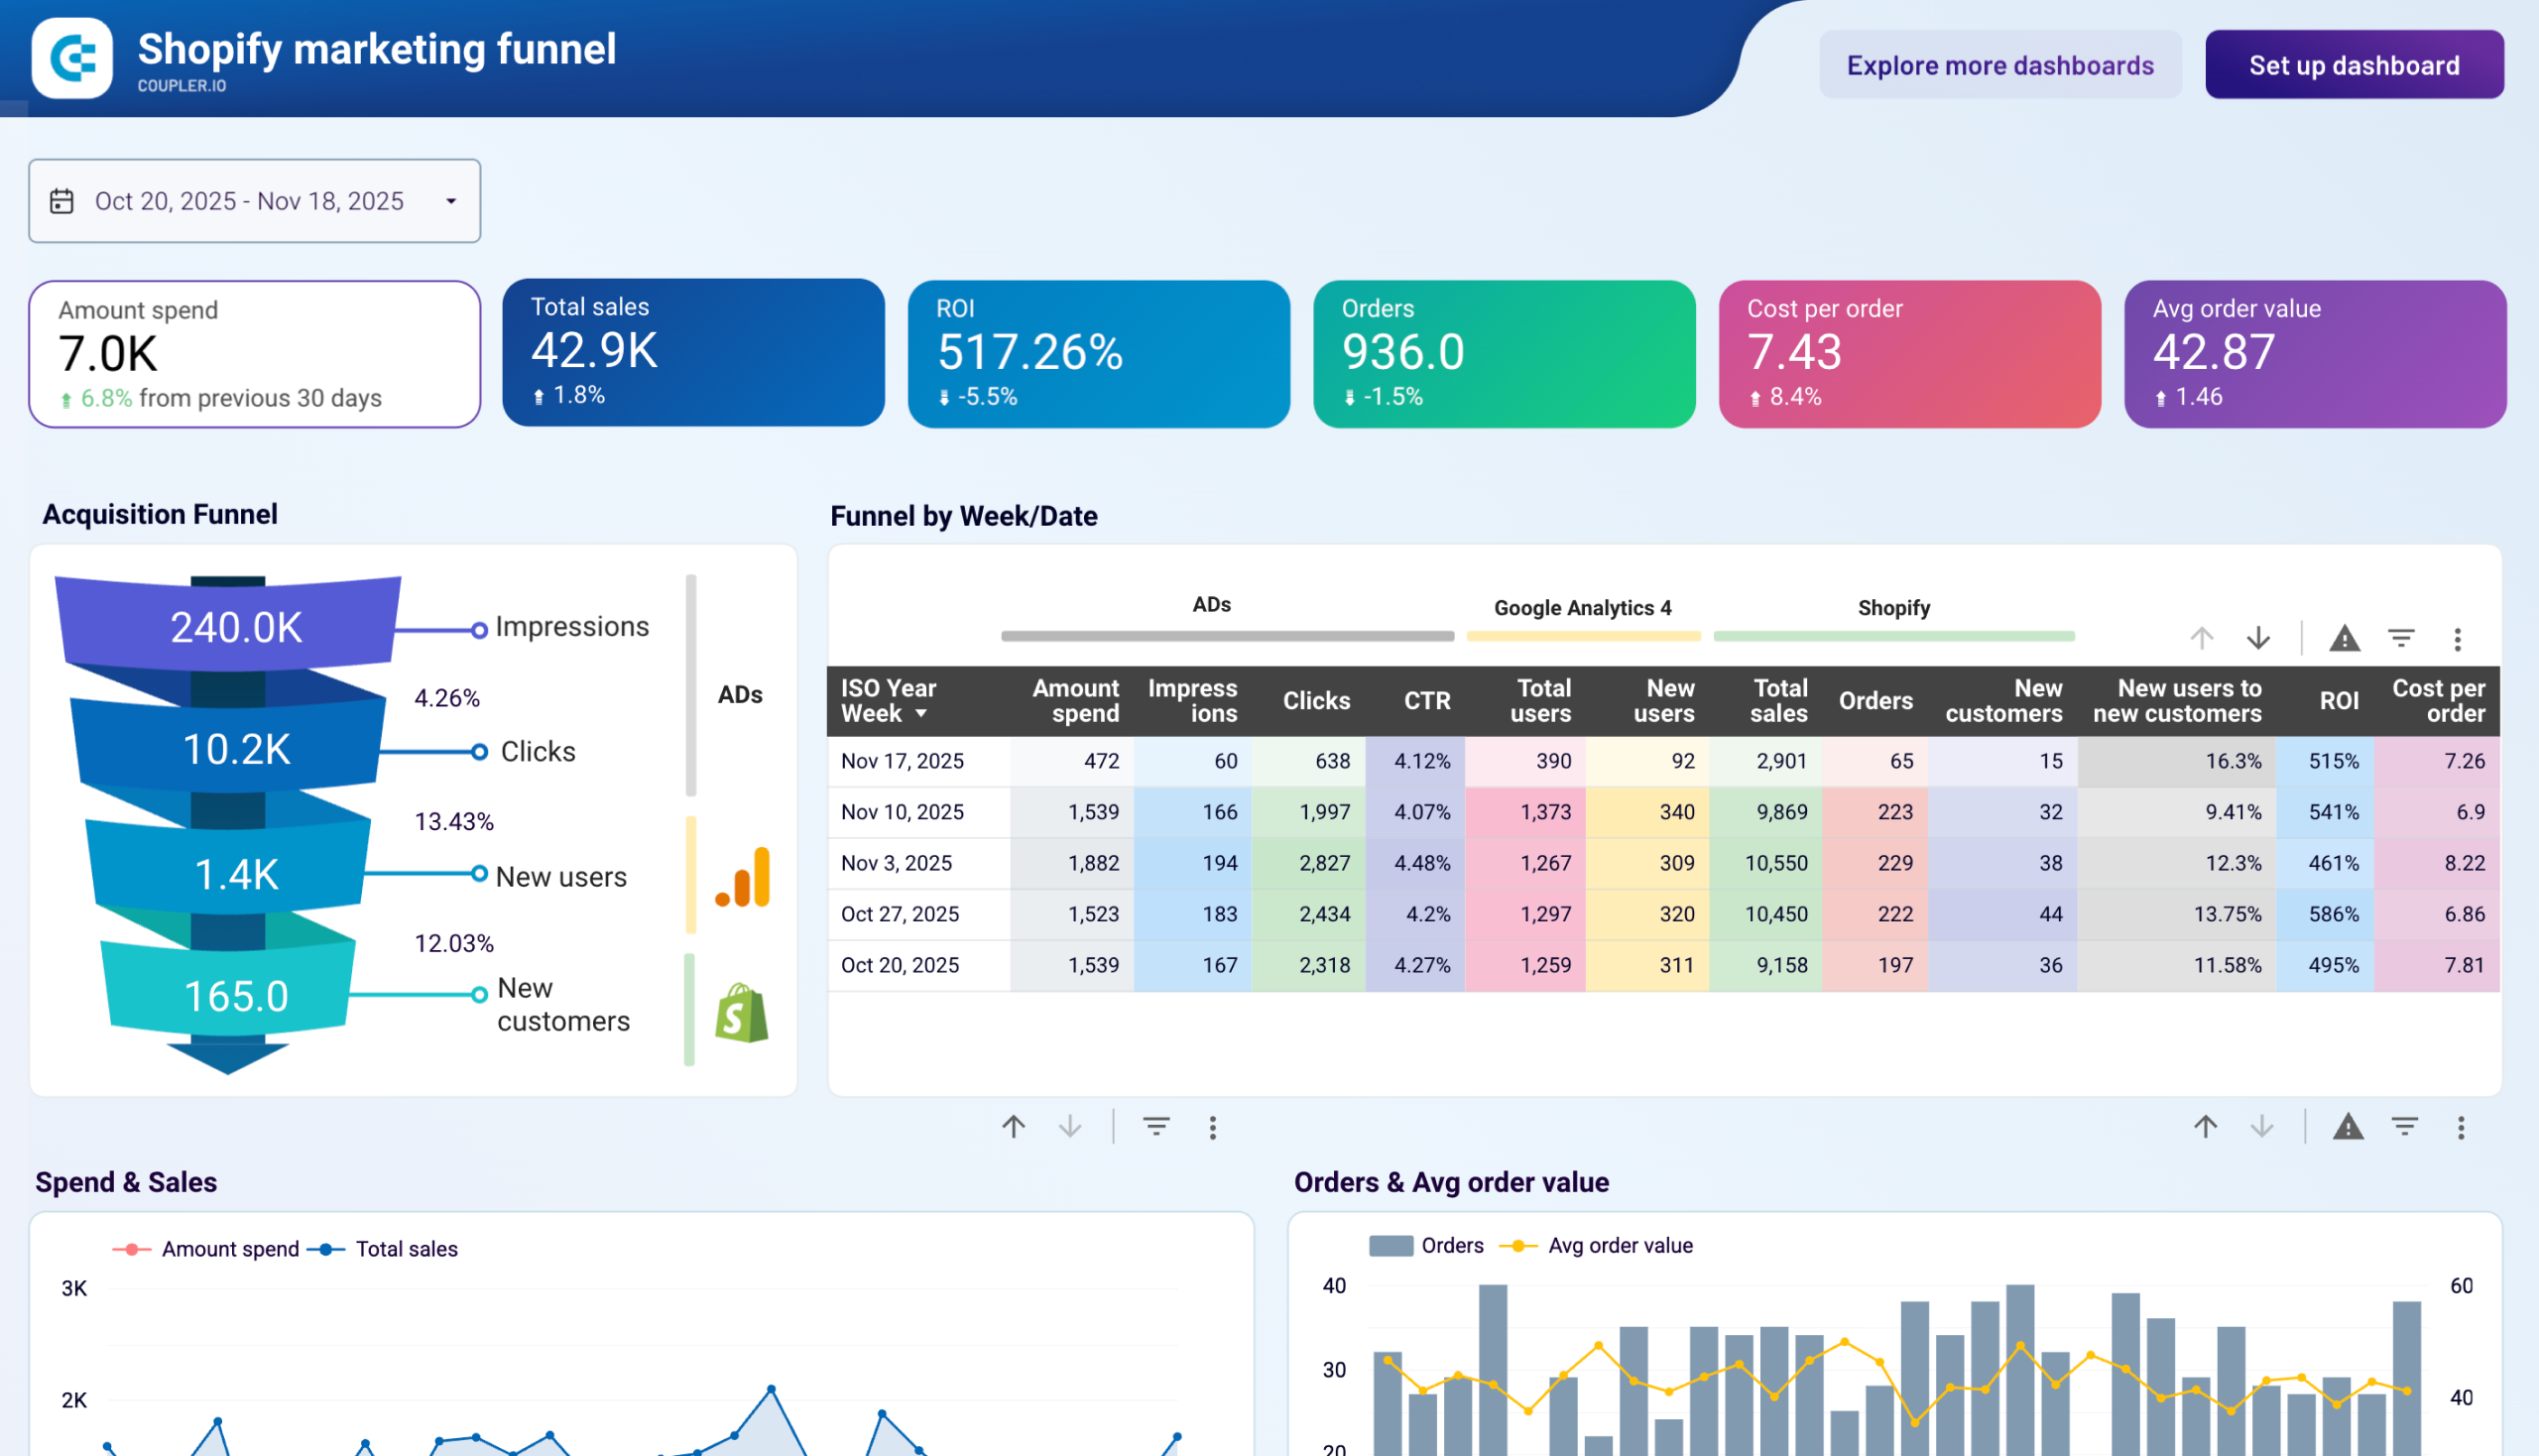
Key insights offered
- Snapshot of your overall ad performance, such as amount spent, total sales, ROI, orders, and cost per order
- Acquisition funnel overview, including ad impressions, clicks, new users, and new customers
- Detailed breakdown of performance metrics by combining data from ads, Google Analytics (GA) 4, and Shopify
- The direct impact of marketing investment on the total revenue over time
- Ad cost efficiency by monitoring the cost of reach and engagement
Key metrics displayed
- Spend and efficiency: Amount spent, CPM, CPC, and cost per order
- Revenue and value: Total sales, orders, average order value, and ROI
- Traffic and engagement: Impressions, clicks, and CTR
- Audience and growth: Total users, new users, new customers
This template comes with a built-in Coupler.io connector. To get started, you just have to authorize your ad account and Shopify. The dashboard will visualize your Shopify data in a few minutes.
4. Shopify store traffic dashboard template by Coupler.io
Unlike previous Looker Studio templates to analyze Shopify data, this dashboard provides insights into how organic search intent correlates with your store’s traffic and conversions. So, it’s based on the combination of data sources: Shopify + Google Analytics 4.
In a single view, you get to see total sessions, views, add-to-cart, checkouts, total users, purchases, average order value, quantity per order, and more.
Furthermore, the template provides a breakdown of traffic sources. This shows which source or medium drives traffic to your store, enabling better traffic-optimization planning.

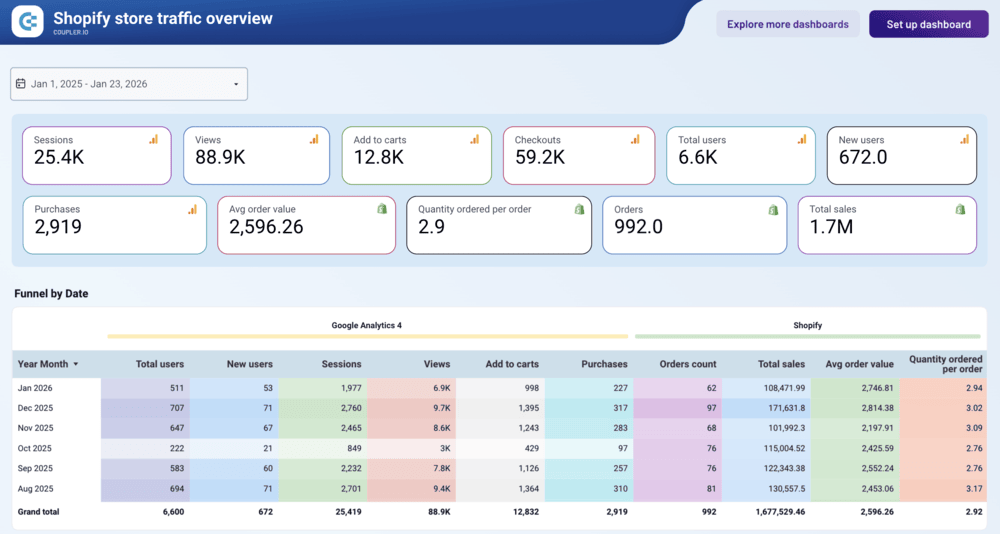
Key insights offered
- Executive performance summary from sessions, views (traffic) down to add-to-cart, checkouts, and finally total sales and orders
- Overview of where drop-offs occur month-over-month by combining GA4 and Shopify sales data
- Products and supplier performance
- Sales and users trends
- Geographic representation to show where orders are coming from
Key metrics displayed
- Traffic Metrics: Sessions, views, total users, new users, and session source/medium
- Engagement Metrics: Add-to-cart, checkouts, and quantity ordered per order
- Sales Metrics: Purchases, orders, total sales, average order value (AOV), and order count
- Inventory & Geo Metrics: Net items sold, suppliers by quantity sold, and country
This template is equipped with a Coupler.io connector. To start using it, you need to authenticate your Shopify and GA 4 accounts.
5. Klaviyo email campaign performance dashboard template for Shopify store by Coupler.io
If you use Klaviyo for email marketing on your Shopify store, this dashboard template makes tracking marketing performance effortless.
It gives you the ability to segment your audience to see exactly which emails drive retention and repeat purchases simply by seeing emails sent, opened, orders placed, and sales generated during the last 30 days.
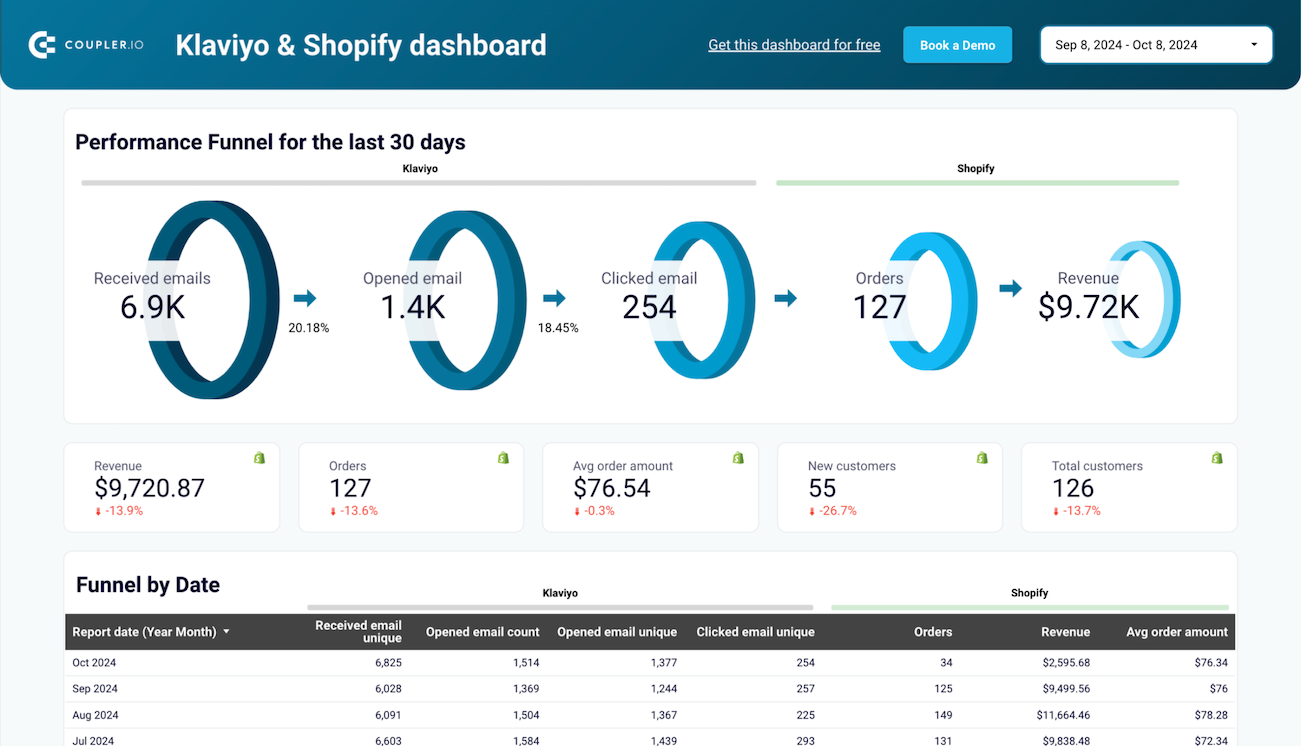
What’s more, the Klaviyo email campaign performance dashboard template provides full visibility into email funnel performance from previous months. You also get to know the average order value for each month.
In addition, the template makes it easy to dive into the performance of all your Klaviyo campaigns. For easy understanding, it organizes campaign performance into two categories: positive engagement and negative engagement.
Key insights offered
- A detailed table breaking down funnel performance by month
- Top-selling items by net sales, and selling items breakdown to see exactly which products email subscribers are purchasing
- Charts that plot clicks vs. total sales and orders vs. average order value to visualize how engagement impacts revenue over time
- A bar chart visualizing weekly email performance to monitor short-term fluctuations in reach and engagement
- A deep dive into individual campaigns, categorizing data into positive engagement (opens, clicks) and negative engagement (bounces, spam)
Key metrics displayed
- Email engagement metrics: received, opened, clicked emails, open rate, click rate, and click-through rate
- Sales and conversion metrics: orders, total sales, average order value, net sales, net items sold
- Customer metrics: total customers and new customers
- Deliverability & health metrics: Clicked email unique, bounced email unique, marked email as spam, spam rate, and bounce rate
Since this template includes a built-in Coupler.io connector, getting started is quite easy. You just have to connect to Shopify and Klaviyo data. It will automatically populate the dashboard with relevant numbers.
6. Mailchimp email campaign performance dashboard template for Shopify store by Coupler.io
The Mailchimp email campaign performance dashboard template merges email marketing data with sales results. As a result, you get a unified view of your e-commerce performance.
You can track the full customer journey, from sending an email to a recipient buying a product. This helps you see how Mailchimp campaigns drive revenue and identify top-selling products.
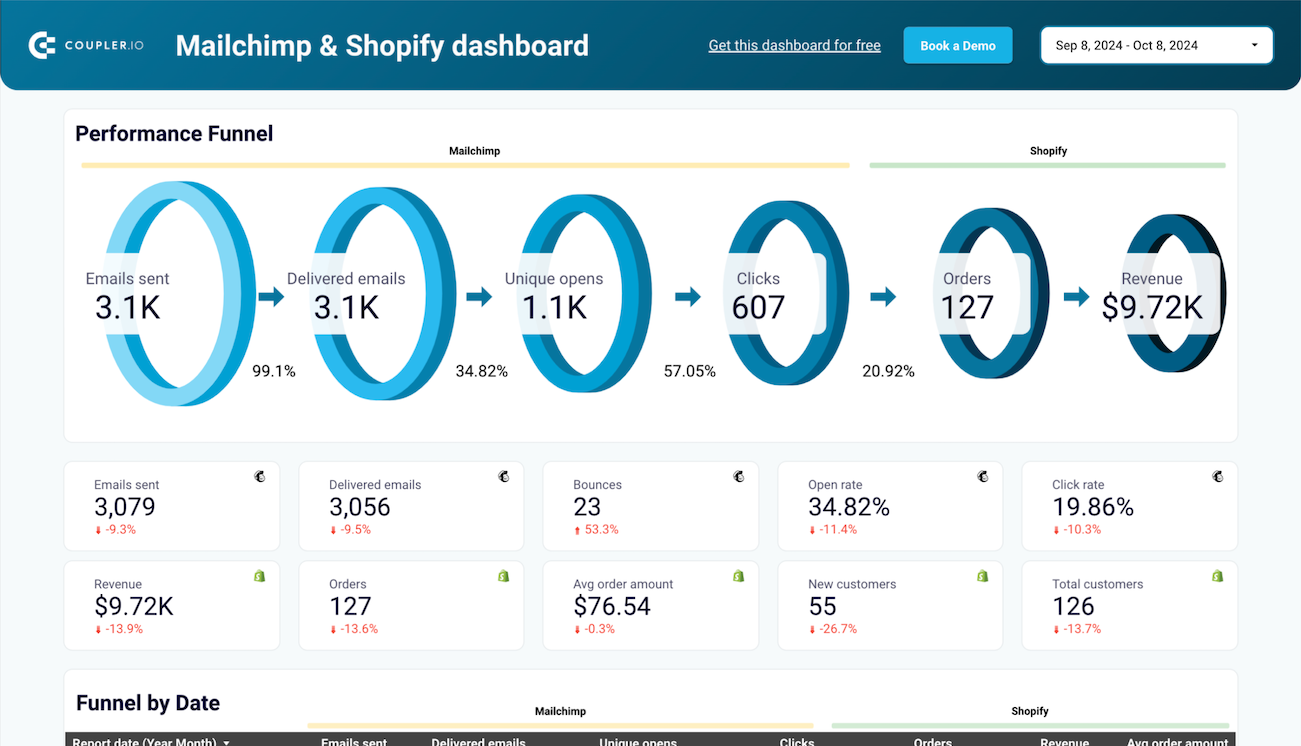
Key insights offered
- End-to-end performance funnel tracking from emails sent to total sales
- Snapshot of growth trends such as open rates, top-selling items, average order value, and clicks vs total sales
- Correlation between email engagement and revenue generation
- Details of the top-selling products by revenue and a breakdown of selling items to assist you in aligning your future email campaigns
- A granular breakdown of individual campaign performance, including unique opens and total revenue attributed to specific sends
- Historical monthly data for seasonality analysis across both email engagement and sales generated
Key metrics displayed
- Email performance: Emails sent, delivered, opens, clicks, open rate, click rate, bounce, unsubscribe, and spam
- Shopify sales: Sales, orders, AOV, net sales, items sold
- Growth: New customers, total customers, and revenue per campaign
The template includes a pre-built Coupler.io connector; you just need to authenticate your Mailchimp and Shopify accounts to start visualizing your data.
7. Shopify overview dashboard template by Two Minute Reports
As the name suggests, the Shopify overview dashboard template by Two Minute Reports provides a high-level view of your store’s performance.
It lets you monitor crucial KPIs, including customer purchasing behavior, sales trends over time, and granular details regarding specific orders and product performance.
You also get the option to see the highest orders with customer name and sales by product, empowering you to make strategic marketing decisions.

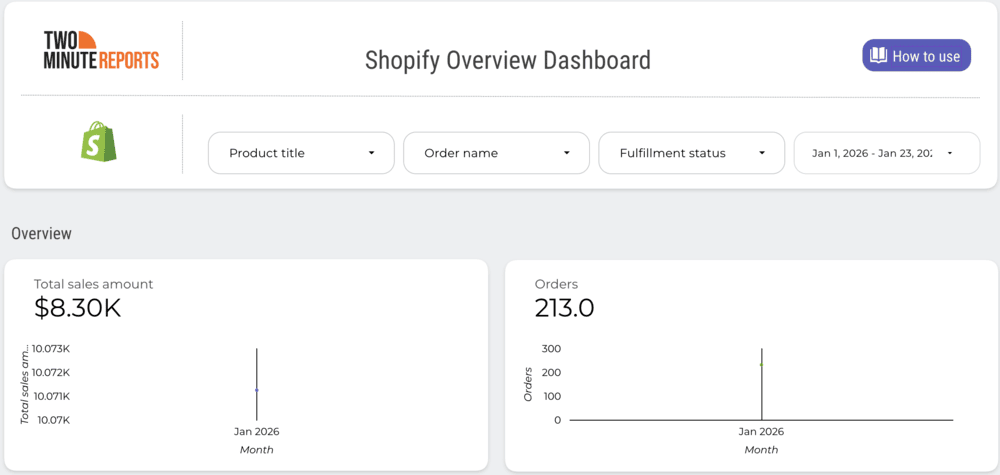
Key insights offered
- The top section offers an immediate health check of your store, showing total sales, orders, customer count, and average order value
- Overview of top customers, which provides identification of key accounts
- Weekly sales and sales by product information
- Geographical sales data
- Detailed order reports with product title, discount, and tax
Key metrics displayed
- Total sales amount
- Orders
- Customer count
- Average order value
- Highest orders with customer name
- Discount amount, tax amount, and shipping amount
You will need to authorize your Two Minute Reports account and Shopify account to start populating this template with your data.
8. Dropshipping report template by Porter Metrics
With the Dropshipping report template by Porter Metrics, you can monitor your eCommerce store’s performance without getting bogged down by numbers.
The template compiles data from platforms like Google Analytics 4, Google Ads, SEO, Amazon Seller Central, and Facebook Ads into a single source of truth.
As a result, you gain valuable insights into your digital marketing efforts by monitoring channel performance across platforms in a single view. This allows you to make informed decisions for better business and marketing growth.

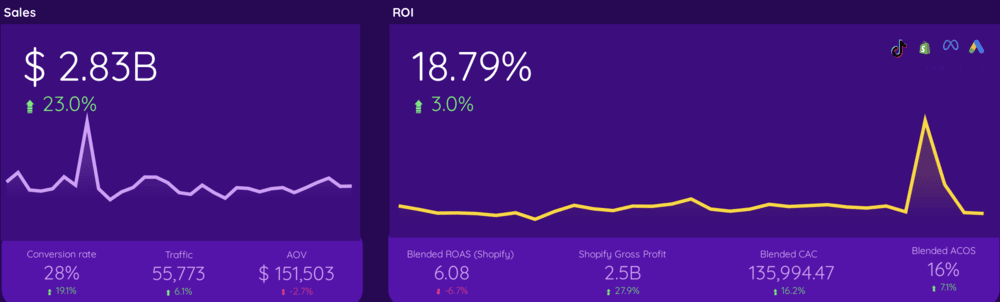
Key insights offered
- A snapshot of the overall performance of your store, including total sales, ROI, conversion rate, customers, and orders
- Comparison of ad efficiency across various marketing platforms
- Performance of email marketing campaigns (Klaviyo)
- Social media growth and engagement
- Performance of different acquisition channels
- Product and landing pages’ performance
- Visualization of returning and first-time buyers
- Audience demographics
Key metrics displayed
- Total sales and ROI
- Total customers and orders
- Blended return on ad spend (ROAS)
- Blended customer acquisition cost (CAC)
- Average order value
- Sessions
- Ad spend, clicks, and impressions
- New followers and engagement on social media
To start using this template, you need to authenticate Porter Metrics, Shopify, GA 4, and other relevant accounts.
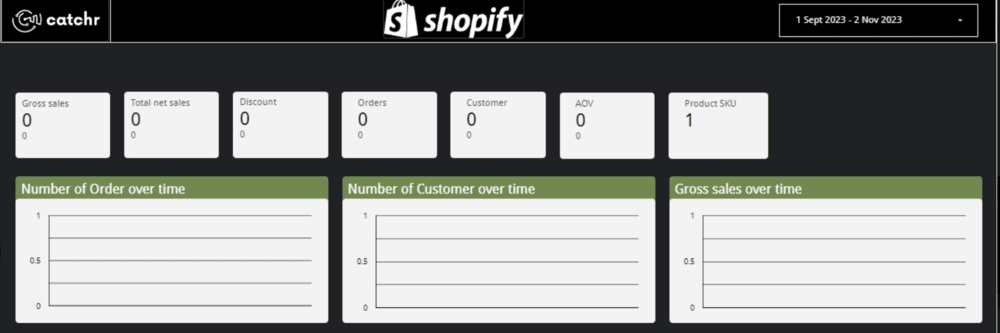
9. Shopify overview dashboard template by Catchr
The Shopify overview dashboard template by Catchr lets you take a quick overview of your Shopify store.
It provides a snapshot of your gross sales, net sales, orders, average order value, and number of products sold.
What’s more, the template allows you to check the number of orders, customers, and gross sales over time. This data is critical for improving your sales and marketing strategies.

Key insights offered
- Gross sales and net sales comparison can reveal revenue lost to returns or cancellations
- Determining if promotional events are driving profitable growth or reducing margins by tracking discounts and sales
- Bottom-line health of your store by tracking net sales
- Purchasing power of your average customer
- Comparing orders with total products shows whether customers buy one item per order or add multiple products to their carts
Key metrics displayed
- Orders
- Customers
- Total number of products
- Gross sales
- Discount
- Net sales
- Average order value (AOV)
Setting up this template is easy. Click Get this template and connect your sources using Catchr. The template fills with your data and refreshes automatically to keep it up to date.
10. Shopify dashboard template by Windsor.ai
Visualize your Shopify store data in just a few clicks with the Shopify dashboard template by Windsor.ai.
The template lets you get a quick overview of how your eCommerce business is performing, who your top customers are, and the average order value.
You also have the flexibility to integrate other channels or your analytics data with your Shopify data to understand how these channels impact your store’s growth.

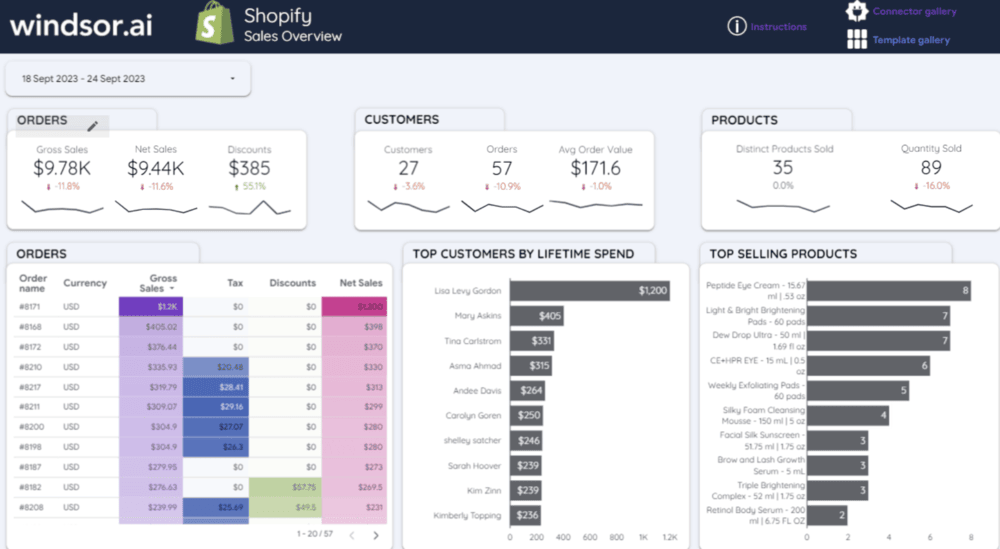
Key insights offered
- Shopify store sales performance over time
- Total number of unique customers during the specified period to understand audience reach
- Identification of the top customers
- Average spend per transaction to evaluate pricing and upselling effectiveness
- Products driving peak volume and revenue to optimize inventory and marketing focus
Key metrics displayed
- Gross sales, net sales, and discounts
- Number of customers, orders, and average order value
- Distinct products sold
- Top customers by lifetime spend
- Top-selling products
- Tax, discount, and net sales order-wise
To start using this template, simply open the link and create a copy. From there, select CREATE NEW DATA SOURCE, find the Shopify by Windsor.ai community connector, and authenticate it to begin populating your dashboard with live data.
How to use Shopify templates for Looker Studio
The exact process to set up a Shopify report template for Looker Studio can vary from one data connector to another.
However, the core steps remain the same: create a data connector account, authorize relevant accounts, connect to the source, and generate reports.
Here are the steps to use the top Shopify Looker Studio templates by Coupler.io.

Step 1: Open the template, and click Get this Dashboard for free. Set up the Shopify connector by authorizing Shopify and other relevant accounts (e.g., for a Klaviyo dashboard, authorize both Shopify and Klaviyo). You can do so by clicking Connect.

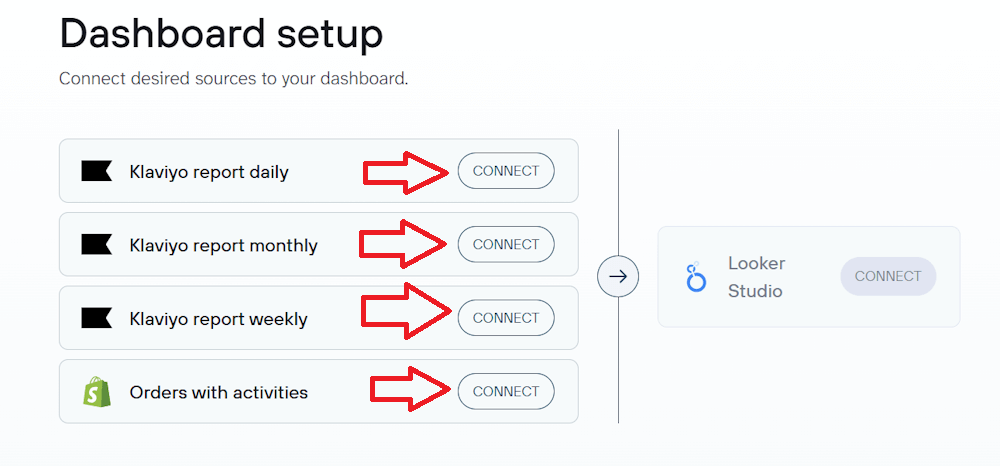
Important: Use the same email address for both Coupler.io and Looker Studio.
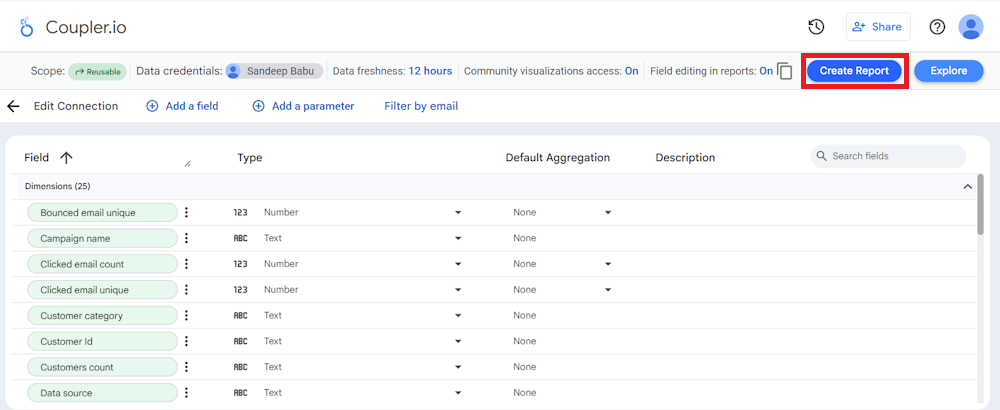
Step 2: Once you have authorized relevant accounts, click Connect to generate the Looker Studio data source.

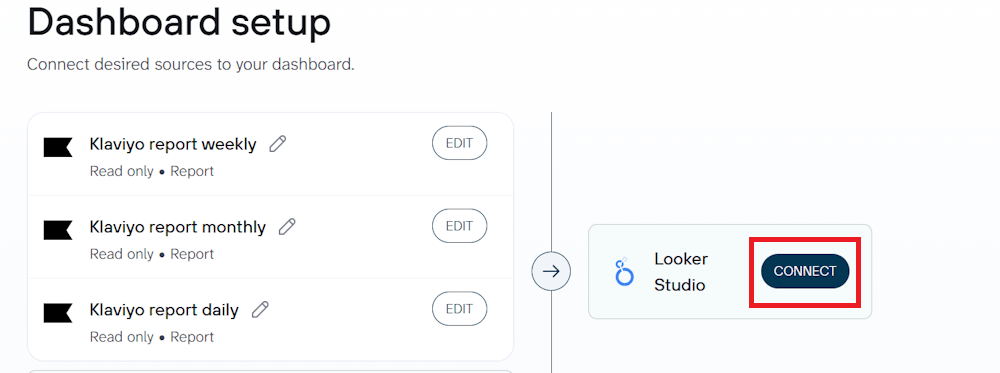
Step 3: Rename the data source (e.g., “Shopify Sales Report”) and fix the metric formats. Ensure sales are set to Currency, rates to Percent, and counts to Numbers.
Make sure the Use report template for new reports checkbox is enabled.

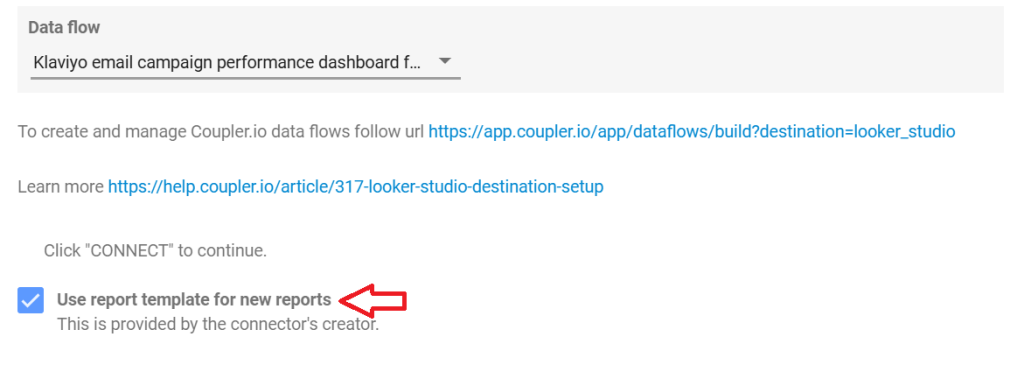
Step 4: Click Create Report to load the dashboard. Once the report opens, you’re able to customize the design, colors, and widgets as needed.

Use Shopify dashboard templates by Coupler.io
Get started for freeTemplate vs custom report for Shopify in Looker Studio
After exploring the top Shopify Looker Studio template, it’s natural to face a choice: a pre-built template or a custom report.
Since the pre-built Shopify templates are plug-and-play solutions, anyone can start using them in just a few minutes.
But they can fall short if your tracking requirements go beyond standard metrics, such as gross sales, AOV, and conversion rates.
You should use templates when:
- You have to quickly track the standard metrics, such as gross sales, AOV, traffic sources, and conversion rates. Templates already have these metrics pre-configured
- You’re new to Looker Studio and aren’t comfortable with data blending, calculated fields, or visualization settings. Ready-made templates handle the technical heavy lifting for you
- You don’t want to spend money. Most templates are free or come included with the connector’s subscriptions
You should use a custom report when:
- You have to track niche KPIs, such as complex profit-margin calculations per bundle or multi-currency reconciliation
- You need to blend data from distinct platforms, such as Shopify + ERP + CRM + Offline Sales, which is not possible with pre-built data dashboards
- You require total visual control in reporting to ensure strict adherence to corporate design guidelines, fonts, and layouts
- You need complex logic and filtering that is beyond the scope of pre-built dashboards
While custom reports support complex needs, pre-built templates effectively handle most standard metrics.
For most Shopify owners, templates provide the essential insights needed to track performance and drive growth. They offer a professional reporting solution without the time and effort required to build one from scratch.