Two reporting tools can look alike and even serve the same agencies, yet work very differently day to day. Whatagraph is built around branded client delivery, while Databox is built around goals and targets. The choice usually comes down to who reads your reports and how the bill grows as you add clients.
Building the same monthly client report in both tools shows where the effort and cost go. Both keep that report inside their own app, which raises a fair question: does the data need to live there at all? Coupler.io takes the other route and sends the same numbers to wherever each audience already reads them, so it’s part of the comparison too.
Key takeaways
- Branded client portals are where Whatagraph earns its $812 a month.
- Databox fits teams tracking goals, with a free plan and paid plans from $71 a month.
- At 12 clients, Databox costs about 40% of Whatagraph’s price, white-labeling included. Whatagraph’s extra buys portals and templates that update every report.
- On AI, Whatagraph’s agents can fix what they find, while Databox charges credits for every AI task.
- For numbers in Google Sheets or Data Studio, Coupler.io’s Pro plan covers up to 50 accounts for $199 a month, Coupler AI included.
Whatagraph vs Databox key differences
If you only check two rows, make them billing unit and getting data out. They decide how the bill grows and whether clients can see numbers outside the tool.
| Whatagraph | Databox | |
|---|---|---|
| Built for | Agencies and multi-location brands | SMB marketing, sales, and ops teams; agencies |
| Entry price | From $812/mo, billed annually | Free; paid from $71/mo, billed annually |
| Trial | Demo only | 14 days, no card |
| Billing unit | 1 credit per connected account | Users, data sources, and AI credits per plan |
| Data sources | 60+ native connectors, custom APIs via Smart Sources | 130+ integrations, including warehouses |
| Refresh | Scheduled report refresh every 4 or 12 hours, or daily (beta), plus manual refresh | Daily on Free, hourly on paid plans |
| Getting data out | PDF, Excel, CSV, links, emails; Looker transfer on Prime, BigQuery as a Prime add-on | CSV on Team plans, PDF snapshots, links, embeds |
| AI | Whatagraph IQ, IQ Agents, MCP | Genie, routines, MCP |
| Security | GDPR, EU data processing | SOC 2, GDPR, CCPA |
One monthly client report built in Whatagraph vs Databox
An agency with 12 clients sends each one a monthly report on Google Ads, Meta Ads, and GA4. That’s 36 connected accounts to set up in each tool.
In Whatagraph
- Connect the 36 accounts. Each uses one credit, and Max starts at 50 credits.
- Build one report from a template and link it to the other 11 clients, so a layout change updates all 12.
- Blend Google Ads and Meta into one paid media table in Data Hub, and let Whatagraph IQ draft the summary.
- Schedule a branded PDF email for the first of each month, or give clients a portal login.
Between reports, the Pacing and Triage agents audit account health and diagnose broken widgets or connections. Max starts at $812 a month, billed annually, with unlimited users.
In Databox
- Choose the Agency plan, which gives each client its own account, and add account packs.
- Connect three sources per client and start from a template.
- Add a blended cost-per-session metric in the metric builder, and set a monthly goal per client.
- Schedule a PDF snapshot of each dashboard by email or Slack.
Agency costs $79 a month on annual billing and includes 4 client accounts, 20 data sources, and 300 AI credits. Each extra account pack adds one client account, five data sources, and 50 AI credits for $20 a month. Twelve clients need eight packs, which brings the bill to $239 a month with 60 data sources, enough for all 36. White-labeling adds $80, for a total of $319 a month.
Agencies usually price their work per client, so the chart shows each bill that way, plus a third option for clients happy with a Google Sheet or Data Studio report.
Coupler.io is a reporting automation platform for business teams. It automatically collects and blends data from 400+ apps and keeps it up to date for your reports and AI. Its Pro plan covers all 36 accounts:

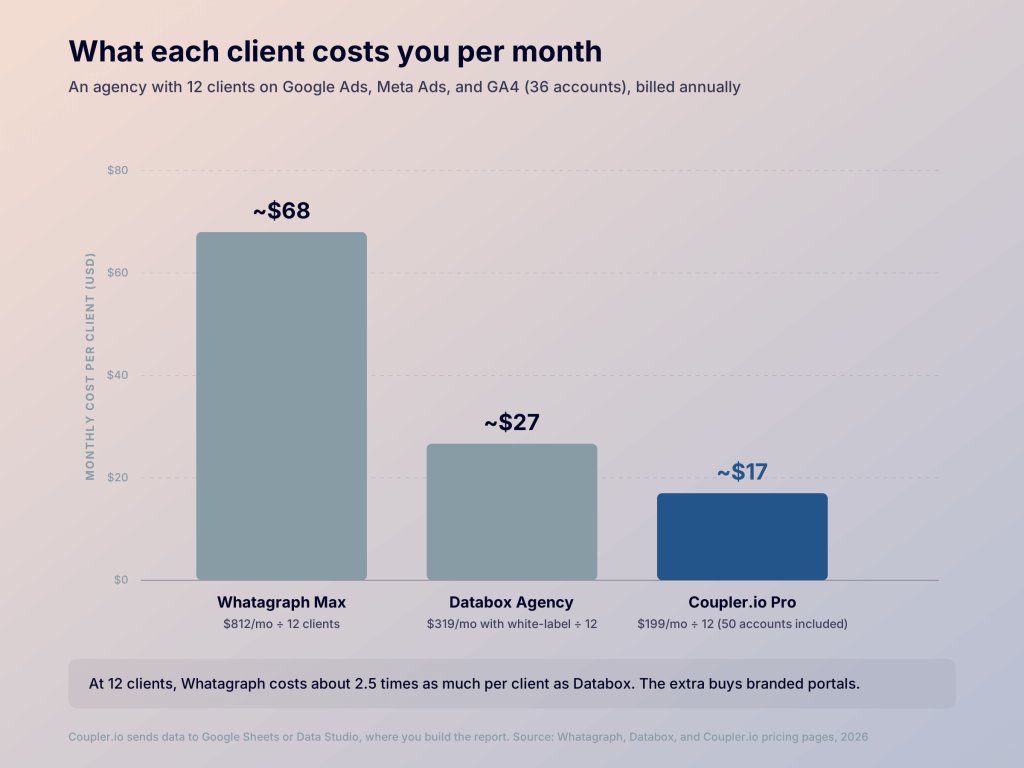
For a dozen clients, then, the Databox bill is about 40% of Whatagraph’s, while Whatagraph gives you more client-facing polish. This guide to scaling client reporting has more ways to cut the monthly workload.
What clients see in Whatagraph vs Databox reports
Whatagraph treats each client as a user. Clients get a portal login with only their own data under your branding, and scheduled reports arrive as branded PDF emails. A custom report domain is only on Prime, where the pricing table lists it as an add-on.
Databox treats each client as a viewer. You share dashboards through a link or embed, or send snapshots by email or Slack, and white-labeling costs $80 a month extra.
Audience and use cases for Whatagraph vs Databox
Both tools serve agencies, but their strengths point to different kinds of reporting.
Whatagraph: for agencies reporting to many clients
Whatagraph is a marketing intelligence platform that unifies cross-channel data for reporting, monitoring, and analysis, with AI agents.
It makes the most sense when the report itself is what you deliver, like branded monthly PDFs for paid media clients or location-level reports for a franchise. If your clients rarely open their reports, much of that polish goes unused.
Databox: for reporting against goals
Databox is an analytics platform that combines performance data and business context for reporting, analysis, and AI agents.
Databox earns its place when reports drive decisions inside a team, like a sales lead checking pipeline against the quarterly target. Smaller agencies use it too, through the Agency plan, when clients are happy with a shared dashboard.
Two questions get you to a starting point: who reads your reports, and what they need from them. Coupler.io fits anywhere in the tree if you’d rather keep the numbers in your own tools:

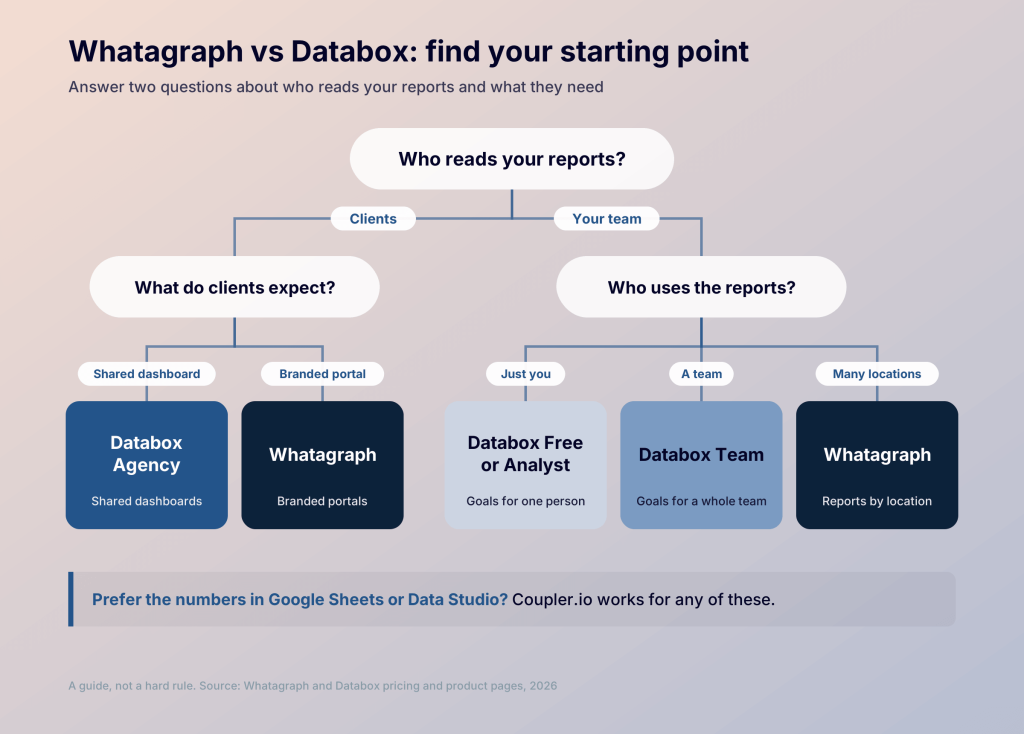
If most of your reports go to clients, start with a Whatagraph demo. If you mainly track goals, or run a smaller agency, start with a Databox trial.
Where key features differ in Whatagraph vs Databox
Both tools cover the basics. These are the features most likely to tip the choice.
If you update many client reports at once
Whatagraph’s linked templates push one layout change to every client report, so 30 clients take one edit instead of 30. If you lean toward Databox, test how a template change carries across client accounts.
If clients spend in different currencies
Whatagraph’s Data Hub converts currencies before data reaches a report, so a client running ads in euros and pounds sees one total. Databox’s metric builder calculates across sources without SQL, but check whether it covers currency conversion.
If you report against targets
Databox shows each metric against its goal and forecasts where it will land, so you can answer “are we on track?” before the month ends. OKRs cost $14 a month extra and fiscal calendars $160, so add those to your quote if you need them. Whatagraph’s Overview tracks targets and spend limits across clients, with email or Slack alerts, but it doesn’t forecast.
Whatagraph vs Databox data sources, from ad platforms to warehouses
If your reports pull in sales or finance data, this part may decide it for you, since Databox reaches much further beyond marketing.
Whatagraph lists 60+ native connectors on its homepage, though other pages say 55+ or 50+. Google Sheets, BigQuery, and Smart Sources custom API connectors cover the rest.
On the Databox side, the integrations page claims 130+, though its library filter shows 107. Coverage reaches into sales and finance apps and warehouses such as Snowflake, with a REST API builder for gaps.
Before you choose, list every source your reports need and check it against both catalogs.
If some are missing from both, Coupler.io covers 400+ apps on every plan, including CRMs like HubSpot and ecommerce apps like Shopify.
Destinations and exports in Databox vs Whatagraph
Both tools keep reports inside their own app, so getting raw data out is limited.
Reports leave Whatagraph through a client portal or branded PDF emails, and you can export PDF, Excel, or CSV files. Prime adds a Looker transfer, and the pricing table lists BigQuery transfer as a Prime add-on.
Dashboards leave Databox through links and embeds, or as PDF and image snapshots by email or Slack. Team plans can export datasets as CSV, but there’s no direct path to a BI tool.
Both also run an MCP server that works with Claude and ChatGPT, so you can query the data from an AI chat. If clients or analysts ask for raw numbers, check the export options on the plan you’re quoted.
What AI agents do in Whatagraph vs Databox
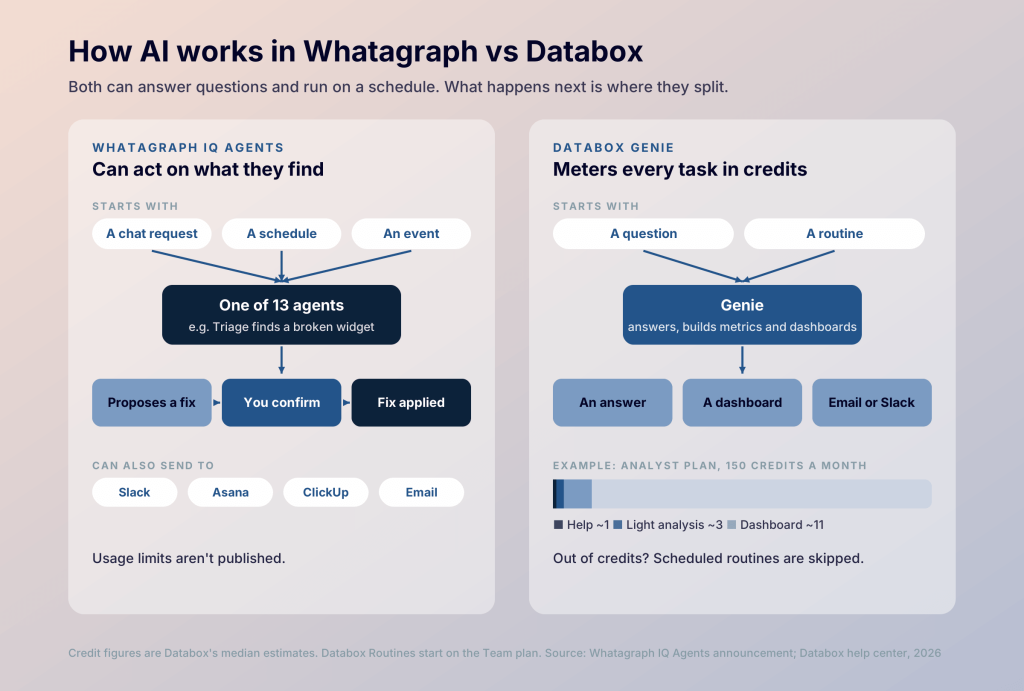
Both tools now let you ask AI questions and put AI tasks on a schedule. The difference is what the AI can do once it finds something, and how you pay for it:

Whatagraph: agents that can act on what they find
Whatagraph IQ writes report summaries on all plans. IQ Agents add 13 pre-made agents you can chat with, schedule, or trigger when something happens, like a connection breaking. Triage diagnoses broken widgets and connections, then applies a fix only after you confirm. Sweep makes the same edit across many reports, and agents can post to Slack or create tasks in Asana.
Databox: an analyst that runs on credits
Genie, the Databox AI analyst, answers questions and builds metrics and dashboards on every plan, Free included. From Team up, Routines run the same tasks on a schedule and send results by email or Slack. Every task uses monthly credits that don’t roll over.
Databox estimates about 1 credit for a help question, 3 for light analysis, and 11 for a dashboard or deep analysis. On Analyst’s 150 credits, that’s about 14 dashboards a month. When credits run out, routines are skipped, and top-ups cost $200.
If you want AI that fixes what it finds, Whatagraph is further along. For answers and scheduled summaries, Databox covers it, as long as you watch the credit balance.
Whatagraph vs Databox pricing and how each bill grows
Whatagraph publishes a starting price for Max, but your quote comes from a sales call. Databox lists every plan and add-on, so you can work out the bill yourself. Prices assume annual billing.
The tools count different things. A Whatagraph credit is one connected data account. Databox counts data sources, like one Google Ads account or GA4 property, and Agency packs add sources and AI credits with each client. Coupler.io counts connected source accounts.
| Plan | Price (annual billing) | Users | Data sources | AI |
|---|---|---|---|---|
| Whatagraph Max | From $812/mo | Unlimited | 50 credits, 1 per source | IQ and IQ Agents |
| Whatagraph Prime | Custom | Custom | Custom | IQ Agents |
| Databox Free | $0 | 1 | 3 | 50 credits |
| Databox Analyst | $71/mo | 1 | 5 | 150 credits |
| Databox Team Core | $199/mo | 3 | 10 | 500 credits |
| Databox Team Scale | Not listed | 10 | 30 | 1,000 credits |
| Databox Agency | From $79/mo (4 client accounts), + $20 per extra account pack | Unlimited | 20 | 300 credits |
Prices checked November 2026.
Every connected data account uses one Whatagraph credit, and you can buy extras up to the next plan’s threshold. There’s no monthly billing, free plan, or trial.
On Databox, each plan caps sources and AI credits, among other limits. Add-ons include white-labeling for $80 a month and AI top-ups for $200.
Each bill grows differently as you add clients:
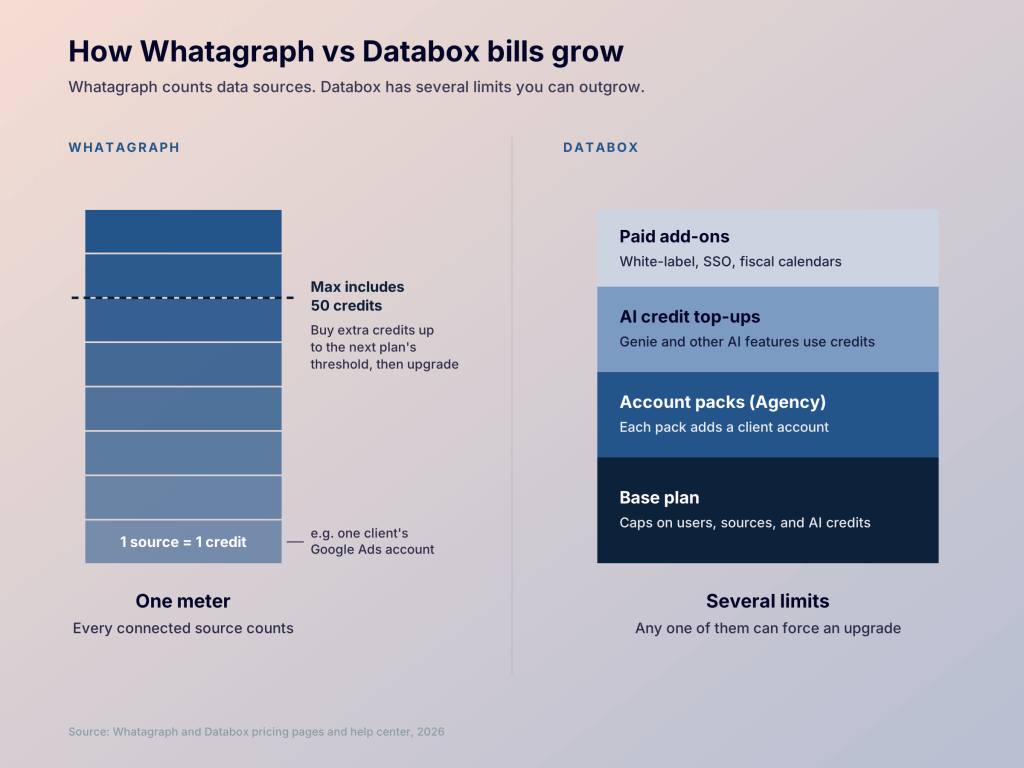
Whatagraph’s bill moves with one number, connected accounts. On Databox, any cap can force an upgrade, and five sources on Analyst run out fast, so count sources before you pick a plan.
Coupler.io also prices by connected accounts, with all 400+ apps on every plan. Paid plans start at $24 a month for 3 accounts, and the 12-client setup above fits on Pro at $199, Coupler AI included. Compare plans on the pricing page.


Automate client reports without paying per seat
Book a demoSecurity & stability in Databox vs Whatagraph for EU and US teams
EU data processing on Google Cloud and AWS, under GDPR, is Whatagraph’s main security plus. Its site shows an ISO 27001 badge, so ask for the certificate if clients need it. SAML SSO is a Prime add-on.
Databox hosts data on AWS in the US and holds a SOC 2 report, with GDPR and CCPA compliance. SSO comes with a $40-a-month security add-on, and a public status page lists past incidents.
For EU agencies with GDPR-sensitive clients, the EU hosting helps. For US buyers who ask for SOC 2, Databox clears that bar.
Ease of use and support in Databox vs Whatagraph
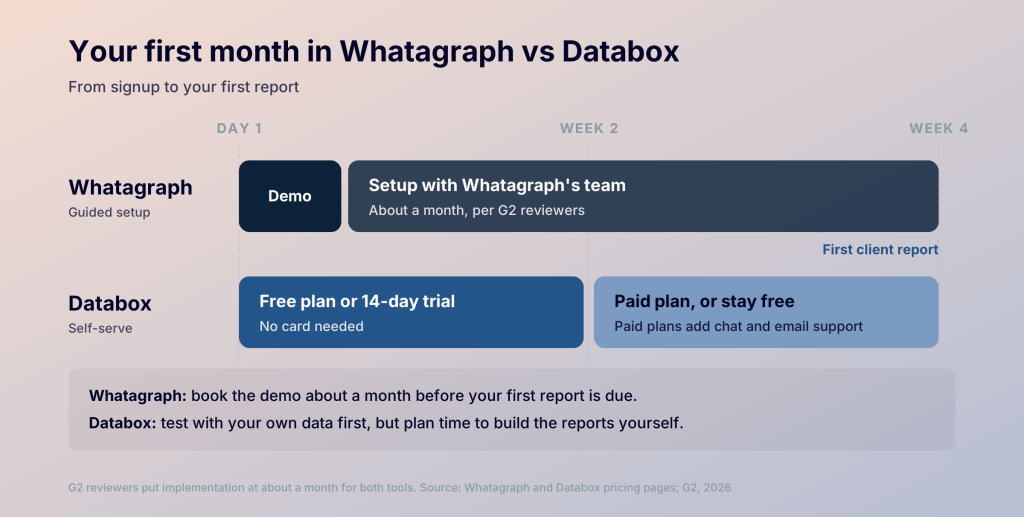
G2 reviewers rate ease of use at 8.9 for Whatagraph and 8.7 for Databox, and put implementation at about a month for both. Every Whatagraph plan starts with a demo and a guided setup, so book it well before your first client report is due. Both plans include live chat and a dedicated customer success manager.
With Databox, you can open a free account or a 14-day trial without a card. Paid plans add chat and email support, and annual plans renew automatically, so set a reminder.
In practice, that difference shapes your first month:

Questions to ask in a Whatagraph vs Databox trial or demo
Neither pricing page answers everything. Ask these before you sign:
- How many Whatagraph credits will my accounts use at renewal, and what do extra credits cost?
- Are the custom report domain and BigQuery transfer included in Prime, or paid add-ons?
- Which Databox cap will I hit first as clients grow, whether sources, users, or AI credits?
- How many Genie credits do my usual tasks use, and what happens when they run out?
Get the answers in writing before you commit to a year.
Where Coupler.io fits in the Whatagraph vs Databox decision
Whatagraph and Databox both keep your reports inside their own apps. That works until a client asks for the numbers in their Data Studio dashboard, or finance wants ad spend next to revenue in a Google Sheet.
Coupler.io takes a different route: it sends data from 400+ apps into the tools people already open, refreshed on a schedule. Everyone works from the same numbers, delivered where each audience reads them: a Data Studio dashboard for the client, a Google Sheet for finance, or Claude for an account manager who wants a quick answer. The table shows how it compares with both.
| Coupler.io | Whatagraph | Databox | |
|---|---|---|---|
| Starting price | Free plan; paid from $24/mo for 3 accounts (annual) | From $812/mo (annual) | Free plan; paid from $71/mo (annual) |
| Apps | 400+ on every plan | 60+ native connectors | 130+, capped per plan |
| Pricing based on | Connected accounts | Connected accounts (credits) | Users, sources, and AI credits |
| Reports go to | Google Sheets, Excel, Data Studio, Power BI, warehouses, AI tools | Whatagraph; Looker on Prime, BigQuery as an add-on | Databox; CSV on Team plans |
| Dashboards | 250+ templates for Data Studio, Power BI, and more | Built in, white-label | Built in; white-label for $80/mo |
| AI | Coupler AI, also usable from Claude or ChatGPT, on every paid plan | Whatagraph IQ, IQ Agents, MCP | Genie on AI credits, MCP |
For the 12-client agency, that means a single setup that reaches each client wherever they read reports: a Data Studio dashboard from a library of 250+ templates for some, a Google Sheet for others. All 36 sources fit on the Pro plan ($199 a month, hourly refresh, + room to scale). You can also mix sources from marketing, sales, and finance in the same report, like ad spend next to HubSpot deals and Stripe revenue.
Coupler AI works on the same data. Ask which client’s cost per lead rose most this month, in Coupler.io or in Claude or ChatGPT, and it helps set up the data flow behind the answer. The calculations run on your actual numbers, so you can check how each figure was reached.
Whatagraph is still the stronger choice for a white-label client portal, and Databox for goals and forecasts next to your metrics. See Coupler.io vs Whatagraph and Coupler.io vs Databox for full breakdowns.
Put ad spend next to revenue in every client report
Book a demoWho should pick Whatagraph vs Databox, and when to choose Coupler.io
Start with the closest match, then test it with one of your own reports before you sign:
- Agencies with 30+ clients: Whatagraph’s client tools spread the $812 a month across many accounts.
- Smaller agencies: Databox Agency likely costs less for 5 to 15 clients, and you can trial it first.
- In-house teams: Databox Team, for goals and forecasts on top of sources beyond marketing.
- Solo analysts: Databox Free, then Analyst for hourly sync.
- Teams that want data in their own tools: Coupler.io, with reports in Google Sheets, Data Studio, or BigQuery.
If you’re still deciding, start a Databox trial and book a Whatagraph demo in the same week, then build the same report in both and ask each vendor the trial questions.