What is automated reporting?
In simple terms, automated reporting is the process of building reports without manual intervention, typically on a scheduled basis. It includes gathering, analyzing, and presenting data in a predefined manner. Therefore, streamlining the reporting process with timely and accurate insights.
The process includes:
- Data gathering – The Required data is automatically pulled from the source
- Transformation & analysis – Predefined analysis/operations are performed on the gathered data
- Reports creation – The insights are converted into reports containing charts and other visuals
Unlike manual reporting, you don’t need to repeat the steps every time to update data. The report, which is built once, updates data on its own on a set frequency (every hour, day, week, etc)
Benefits of automated reporting
Manual data reporting requires you to spend hours collecting and analyzing data. Yet, there is still a risk of inaccuracies in the reported data due to human errors. Also, you may not be able to analyze the real-time data.
Reporting automation solves these problems and helps you:
- Save time and resources spent on building recurring reports
Project Alfred, an Australian accounting firm, streamlined their reporting processes by integrating data from Xero and HubSpot using Coupler.io. This automation saved them 20–40 hours monthly, enhancing data reliability and reducing manual errors.
- Ensure data accuracy in reports by minimizing human errors
SellThru, a digital marketing agency, improved its reporting accuracy to over 95% by automating data consolidation across advertising platforms and Google Analytics 4 using Coupler.io. This not only enhanced reporting efficiency but also ensured real-time insights.
- Make reports standardized to track key performance indicators (KPIs) consistently
United Way Northwest Indiana automated data flows from various marketing and CRM applications into dashboard templates with Coupler.io. This standardization reduced manual reporting time by approximately 80 hours per month and saved $20,000 annually on labor costs. - Improve team efficiency by eliminating time-consuming tasks like building regular reports
Terminal 1, a recruitment firm, automated their reporting by merging data from Airtable and QuickBooks using Coupler.io. This eliminated manual work, enabled live reports, and allowed the team to focus on more strategic tasks. - Easily share reports with team members and stakeholders to make informed decisions
Mailtrap, a software company, utilized Coupler.io to automate data flows and create comprehensive dashboards. This approach facilitated data-driven decision-making and contributed to a 466% increase in monthly recurring revenue over three years.
The automated reports require a one-time initial setup, which is totally worth it considering its long-term benefits.
Types of automated reporting tools
You may need specific tools to automate each stage of the reporting process, like data collection, transformation, and analysis.
Here are the types of tools to automate the reports:
- Data connectors connect data sources, such as apps, services, or databases, to reports, allowing data to flow automatically between them.
- Business intelligence tools help you perform data transformation and analysis, and prepare visual reports that update automatically based on live data (e.g., tools like Power BI and Looker Studio).
- Spreadsheets – You can use Google Sheets or Microsoft Excel to connect to manage, transform, and convert data into charts, graphs, and other visuals.
- API-based integrations – Data engineers use custom programs (like Python scripts) to automate data collection via APIs, transformation, and extraction.
In most cases, you may need multiple tools to automate each stage of the reporting process. Thankfully, there are better options available — you can use all-in-one reporting automation platforms, such as Coupler.io, as an alternative to multiple data connectors.
List of the best tools for automated reporting
Here, we list the top automated data reporting tools and compare them to one another.
| Platform | Type of tool | Usability | Data source integrations | Automation capabilities |
|---|---|---|---|---|
| 1. Coupler.io | No-code automatic data integration platform | – No coding required – Very easy to use | – 70+ data sources (marketing, finance, social media, etc.) – Get data from any source via REST APIs | – Fully automated dataflows – Schedule automatic data refreshes (e.g., every 15 minutes) |
| 2. Looker Studio | Data visualization & reporting tool | – Drag-and-drop interface – Requires technical knowledge for advanced analytics | – ~20+ Google native connectors (e.g., Google Ads, GA4, YouTube – 600+ partner connectors | – Supports automated data refreshes at regular intervals – Get report PDFs directly via email |
| 3. Power BI | Business intelligence & data visualization tool | – Easy for basic reporting – Requires Power Query knowledge for advanced data analytics and integration | – 100+ native connectors (databases, SaaS apps, web APIs) | An online spreadsheets tool with basic analytics features |
| 4. Tableau | Business intelligence & data visualization tool | – Drag-and-drop interface – Requires technical expertise for advanced data transformations | – Requires Power BI Service (Pro) to automate reports – Schedule auto-refreshes (for e.g., every 30 minutes) | – Schedule data refreshes at regular intervals – Offer webhooks for notifications – Automate analytics using Tableau Pulse (AI) |
| 5. Qlik Sense | Business intelligence & data analytics platform | – User-friendly platform for beginners – Drag-and-drop interface for building reports | – Broad data source support (databases, applications, plus integrated ETL and ML features). No-code “Application Automation” for workflows. | – Daily, weekly, monthly, and yearly data reloads – Set up trigger-based actions (such as sending emails or notifications). |
| 6. Google Sheets | An online spreadsheet tool with basic analytics features | – Very easy and familiar interface | – Easily import CSV, JSON, XML data via native formulas – Third-party add-ons are available to connect other data sources – Supports custom script for data integration | – Refresh data via app script based on triggers – Formulas to auto-apply calculations and transformations |
| 7. Microsoft Excel | Desktop-based spreadsheet & data analysis tool | – Easy to use for basic data management – Requires VBA knowledge for advanced analytics | – Connects to SQL databases, Azure, web APIs, etc. via Power Query (Get & Transform) – Add-ins available for third-party connectors – Supports OLE/ODBC and external data connections | – Macros and VBA scripts for automation – Update data every 5 minutes (Excel lacks a built-in scheduler when closed unless combined with Power Automate or Windows Task Scheduler) |
? Pro Tip: Most reporting tools excel at visualization but struggle with data collection from multiple sources. If you’re working with data from Facebook Ads, Google Analytics, CRM systems, or financial platforms, consider pairing your chosen reporting tool with Coupler.io. This automated data integration platform can keep your reports refreshed with up-to-date information from all your business applications.
Top 7 automated reporting tools in detail
1. Coupler.io
Coupler.io is a reporting automation platform that connects over 70 data sources, including marketing, CRM, accounting, HR platforms, to BI tools, spreadsheets, and other destinations. It requires no coding and can be set up in a few minutes. Therefore, it complements your existing reporting tech stack.
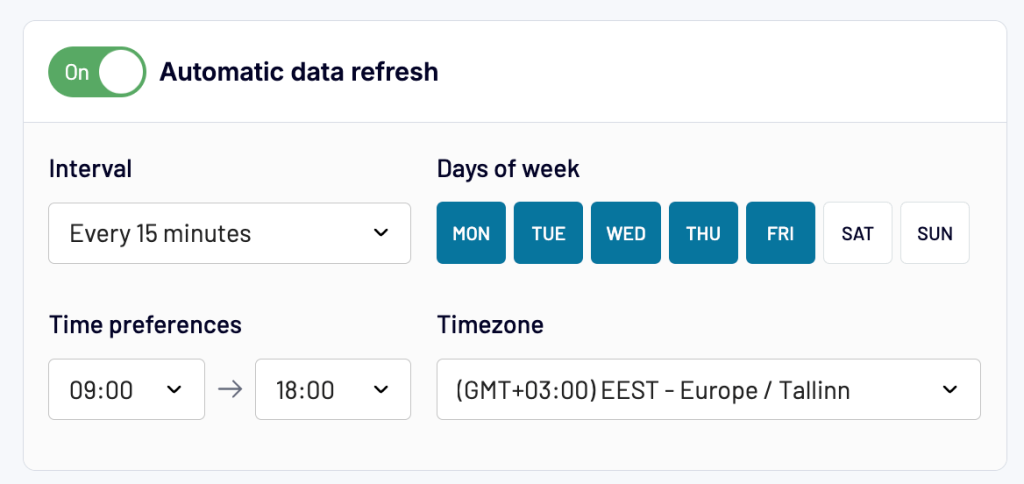
You simply need to pick a data source and specify the required data. Then, make any necessary modifications and connect the final data to the reporting tool. The dataflow can be scheduled to refresh automatically on a schedule (e.g., every 15 minutes).
You’ll get a preview of the data from the source. If required, modify this data by applying transformations like:
- Sort and filter data
- Hide, rename, and rearrange columns
- Aggregate column values
- Create new calculated columns
Use the following interactive form to check out what it looks like:
For multiple data sources, you can also merge them into a single dataset. Therefore, you eliminate the need to use multiple data connectors for the same type of data source.
Once the data looks fine, connect it to your preferred destination to build reports, like Looker Studio, Power BI, Google Sheets, Microsoft Excel, and more.
You can also set a schedule for the dataflow to auto-update data in your reports. For example, update it every 15 minutes during a specific time range.
In addition to the supported data sources, the platform also connects to the JSON API. Meaning, you can use it to pull data from any app or service that offers a REST API.
Therefore, Coupler.io is an all-in-one tool that replaces multiple data connectors and eliminates the need for data transformation within BI tools. You can use it to build reports that update in almost real-time without any coding or technical expertise.
Key features:
- 70+ native data sources
- Support for REST API
- Connects to spreadsheets, BI tools, and data warehouses as reporting destinations
- Built-in data transformation module
- Free ready-made reports and dashboard templates
- AI insights to help you quickly make sense of your data
- Excellent customer support
- MCP server to interact with your data without SQL or coding
Reporting automation features:
- Offers preset dataflows to pull data from major apps and services
- Schedule automatic data updates at specific intervals (as fast as every 15 minutes)

- Outgoing and incoming webhooks for event-triggered automated workflows
Limitations:
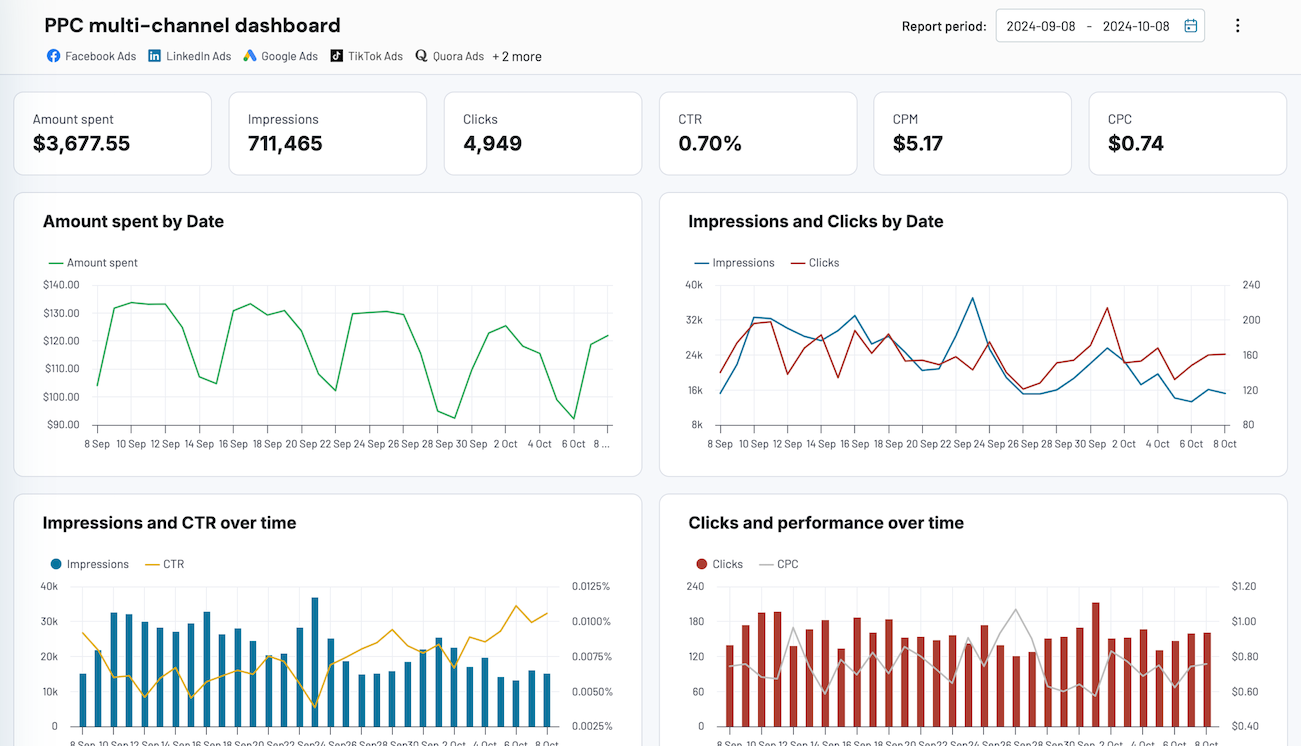
- No data visualization options except for the predesigned dashboards like this:

Pricing:
- Free – Connect up to 1 data source to a destination with a manual data refresh option
- Paid plans (starts at $24/mo) – Connect multiple data sources to various destinations. No limits on the amount of data you can export, depending on your plan. Free trial available.
Coupler.io is suitable for individuals and business users looking to automate data extraction, transformation, and reporting. It requires no technical knowledge or coding, saving time and resources.
2. Looker Studio
Previously known as Google Data Studio, Looker Studio is a free online reporting tool. You can connect live data sources to the platform and build custom reports using its easy-to-use interface. Users familiar with the GA4 interface may find it very easy to navigate and use.
It natively offers connectors for Google Services like YouTube, Google Analytics, and Search Console. You can also find partner connectors for other cloud sources. Coupler.io is one of them, offering easy integration of marketing and business apps with Looker Studio. It allows you to connect over 70 sources to Looker Studio reports. No need to export CSV files or build complex integrations yourself.

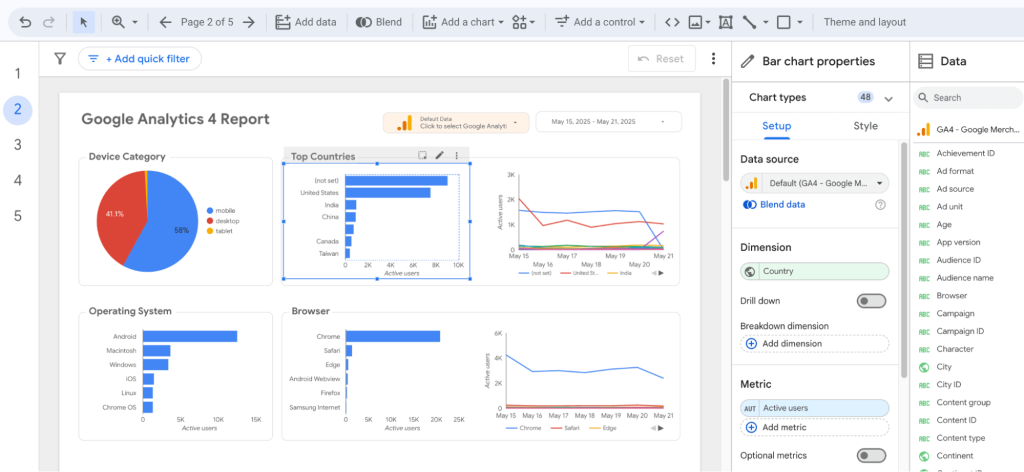
For each data source, you can set a data refresh frequency in Looker Studio. Therefore, keeping the report up-to-date with the latest metrics without manual intervention.
Key features:
- Anyone with a Google account can use Looker Studio for free
- The interface is easy to understand and use, even for non-technical users
- Easily connect to other Google services without any third-party tools
- You can join datasets, create calculated fields, apply filters, and more
- Build interactive reports that can be easily shared with stakeholders and embedded into web pages
Reporting automation features:
- Supports interactive filters like date range controls in reports for dynamic reporting
- Option to set up automatic delivery of PDF reports to email
- Set up email alerts based on set conditions on charts (Pro version only)
- Mobile app to access and interact with reports on the go
Limitations:
- No native data storage — you need to either connect a spreadsheet or an external database
- Limited number of native connectors
- Performance issues while handling large datasets (>1M rows)
- You can blend up to 5 data sources in a single blended data view.
Pricing:
- Free – Basic data analytics and visualization, team collaboration, and community support
- Looker Studio Pro (starts at $9/user per month) – Advanced features like Gemini AI Insights for data analysis, professional support, better collaboration, and more.
Looker Studio is ideal for small companies and agencies seeking to automate marketing reports, particularly for SEO and web analytics.
3. Power BI
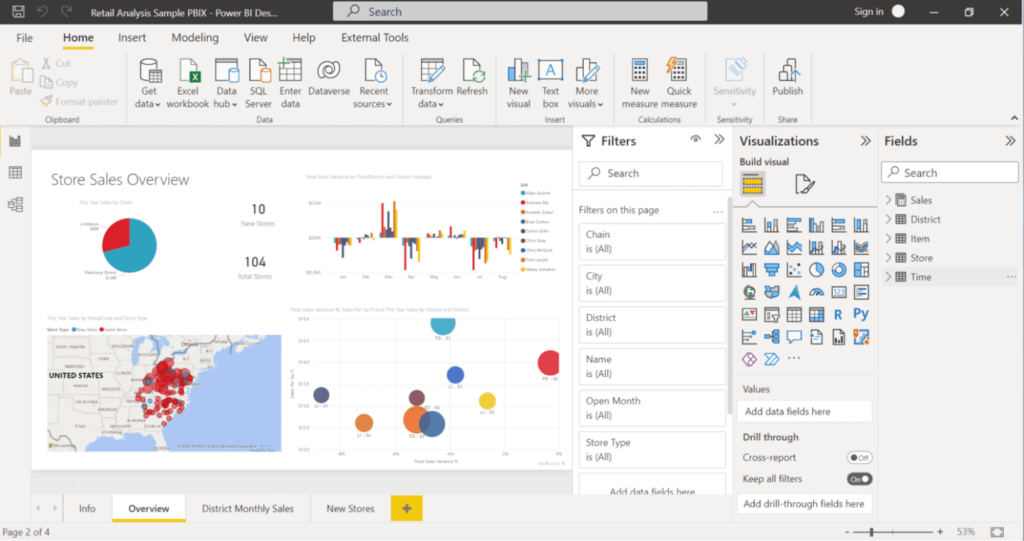
Microsoft Power BI is an enterprise-level reporting automation tool for advanced analytics. In Power BI Desktop, which is only available for Windows, you can connect to various data sources like web APIs, databases, and other popular services to build automated reports.
Then, these reports can be published to Power BI Service (requires a paid license) for online access and sharing.

While Power BI offers extensive native connectors, businesses often need fresh data from marketing platforms like Facebook Ads, LinkedIn Ads, or CRM systems that require additional setup. Coupler.io is a helping hand here by providing a way to sync data from these sources into Power BI datasets. It will keep your reports up-to-date without manual intervention.
Key features:
- Powerful data transformation, modeling, and analytics features
- Offers a drag-and-drop report builder to build visuals from data
- Easily publish reports online and collaborate with teammates through Power BI Service
- In-built co-pilot to get AI insights from reports
- Access reports via mobile apps / embeds on web pages
Reporting automation features:
- Publish reports online on the cloud for real-time reporting and collaboration
- Supports live data sources (via DirectQuery) for real-time connection
- Option to set up automatic refreshes for data extracts at certain frequencies: Pro users can refresh 8x/day; Premium users up to 48x/day.
- Integrates with the Power Automate app for workflow automation
Limitations:
- Steeper learning curve for advanced analytics, DAX formulas, Power Query, etc.
- Hidden costs of storage add-ons, extra refreshes, data flows, and other services required for automated reporting
- Performance issues while processing large datasets in the reports
Pricing:
- Power BI Free – Desktop software to build and save reports locally
- Power BI Pro ($14/user per month) – Required to publish and share reports online
- Power BI Premium ($24/user per month) – Access to larger datasets and faster data refreshes
Note: Enterprise pricing via capacity model ($4995+/month) is also available.
Compared to Looker Studio, Power BI is an advanced-level reporting automation tool. It’s well-suited for larger organizations (like enterprises), looking to automate reports with advanced analytics requirements.
4. Tableau
Tableau is an enterprise-grade, premium BI and automated reporting tool. You can connect to data sources, create a workbook, and schedule extracts to automate report generation. It’s available as a Desktop app as well on on-cloud and Tableau Server for publishing reports.

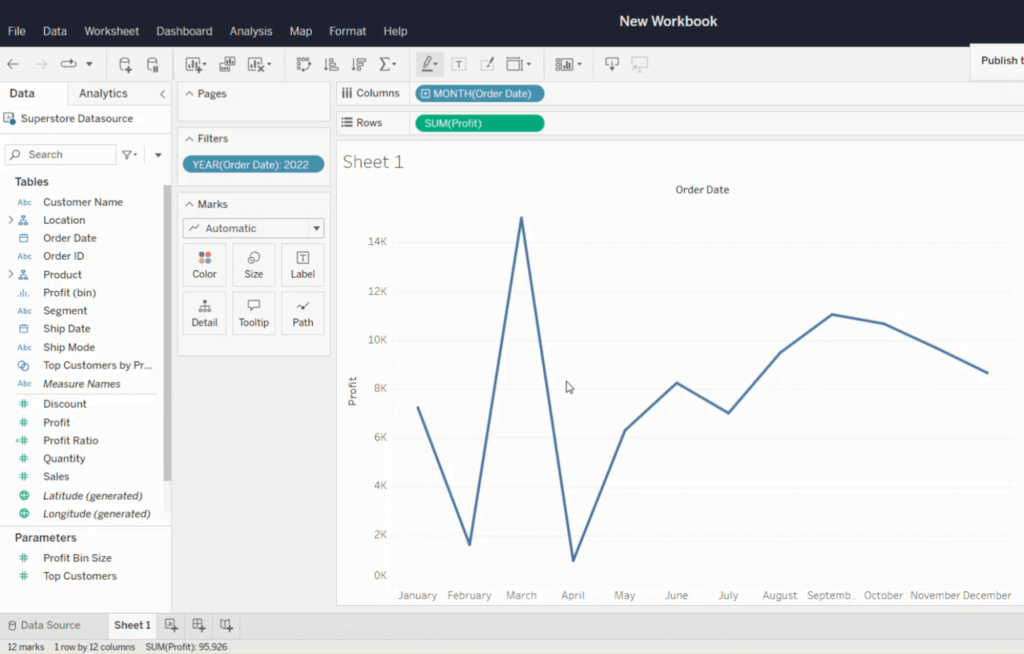
Tableau also comes with native AI-powered summaries and insights and natural language query processing, which can be a good addition to automated reporting.
Key features:
- Build visual reports through a drag-and-drop interface
- Native options for predictive analytics and forecasting
- In-built AI for getting actionable insights from data
- Easily integrate with Python scripts for advanced analytics via TabPy
- Publish reports to Tableau Cloud (previously, Tableau Online) or Tableau Public (for public, non-confidential use)
Reporting automation features:
- Schedule automatic data refreshes and extracts at regular intervals (e.g., every hour)
- Trigger-based alerts to get notifications when certain data thresholds are met
- Deliver reports to Slack, Microsoft Teams, or email
Limitations:
- Requires technical expertise to automate non-database sources like CSV files, REST API, etc.
- High dependency on IT / server team for managing the platform on the cloud
- Advanced analytics features require a steep learning curve for many users
Pricing:
- Tableau Enterprise Viewer ($35/user per month) – To view published reports created in Tableau
- Tableau Enterprise Explorer ($70/user per month) – To explore and interact with reports created in Tableau
- Tableau Enterprise Creator ($115/user per month) – To perform end-to-end data analytics, build reports, and publish them
Note: All these prices are based on annual billing.
Generally, your team will need multiple Tableau licenses, with at least one Enterprise Creator ($115 per user per month), to start creating reports. Therefore, it’s suitable only for large organizations, such as enterprises, that look to automate reports and meet advanced analytics requirements.
5. Qlik
Qlik Sense is a BI cloud platform for enterprises that helps you collect data and create dashboard reports. You can automate report generation by using its Cloud Analytics and Application Automation tools.
The platform supports live data connections and auto-refreshing extracts, making it one of the best automated reporting tools.

This reporting automation tool is suitable for large enterprises seeking an advanced reporting solution.
Key features:
- Smoothly build beautiful visual reports from large datasets
- Offers machine learning for advanced predictive analytics and data forecasting
- Easily access insights via mobile app, APIs, and web embeds
- AI-powered search to ask questions in natural language and gain insights
Reporting automation features:
- Schedule automatic data refreshes up to every minute
- Auto-generate reports in PDF, PowerPoint, Excel, etc. formats
- Build automatic workflows, trigger-based alerts, and more using Qlik Automate
- Deliver reports automatically to emails, shared folders, or a centralized hub
Limitations:
- Data extraction features are not as flexible as other platforms
- Requires technical expertise, like knowledge of SQL and the platform’s native scripting language
- You may be limited by the number of visualizations and types of charts
Pricing: No free plan is available. You can contact Qlik for custom pricing as per your requirements.
Qlik is suitable for large organizations seeking to automate reports with advanced features, including predictive analytics, AI insights, and support for large datasets.
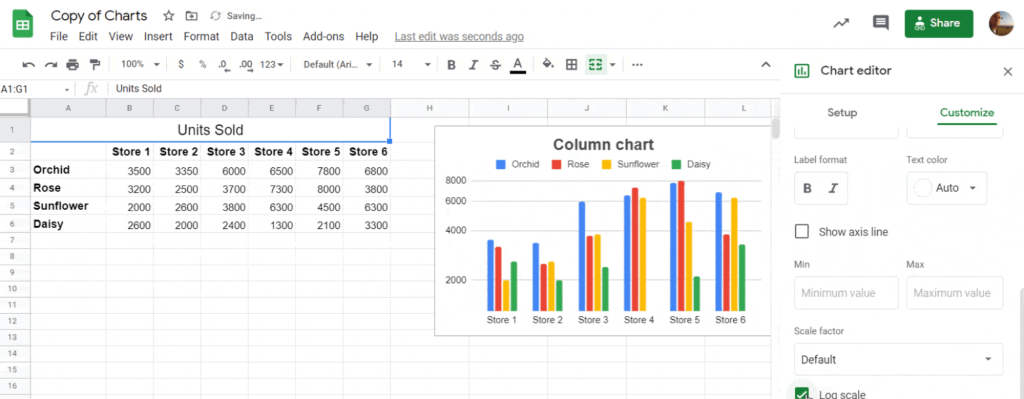
6. Google Sheets
You already know this — Google Sheets is a popular spreadsheet tool for managing data. But it can also be used as an automated reporting tool with dynamic data.
To connect dynamic data sources, you can use:
- Formulas – Use formulas like
IMPORTCSV()andIMPORTXML - Apps script – Write custom scripts to fetch data from external sources
- Add-ons – Explore ready-made data connector tools for Google Sheets
Once you have the dynamic data, you can apply calculations and convert it into visuals, such as charts. You can refresh the data in Google Sheets on load or on a specific schedule.

Key features:
- Real-time collaboration with other team members using the same sheet
- Intuitive interface for beginners for data transformation and analysis
- Quickly turn data into beautiful charts and visuals
- Easy-to-understand and learn formulas for data transformation with helpful instructions
Reporting automation features:
- Time-based or event-based triggers to refresh data in sheets
- Automatically apply data transformations and calculations using formulas
- Easily share and access sheets as reports via URL from any device
Limitations:
- Limited features for data blending, data aggregation, and report drill-downs, among others.
- The size limit is only up to 10 million cells per spreadsheet
- Not suitable for dynamic data structures — changes in the underlying data format can break the entire report
Pricing:
- Free – Completely free to use, but you may require additional add-ons (which may incur additional costs) for data integration. Limited number of data refreshes.
- May require additional billing for more frequent data refreshes
Google Sheets is suitable for smaller businesses looking to automate basic reports from CSV / XML data sources.
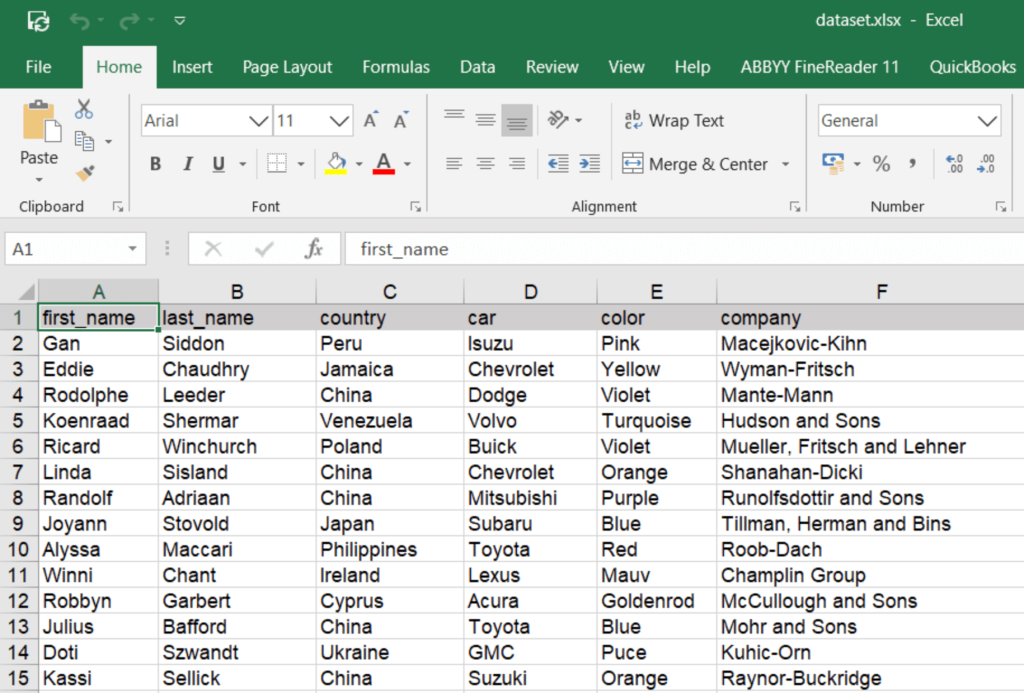
7. Microsoft Excel
Excel is a well-known spreadsheet tool for analyzing, processing, and visualizing data. It’s not just limited to static files; you can connect Excel to dynamic data sources and prepare automated reports. You can integrate Excel with other Microsoft Products, SQL databases, APIs, and other third-party platforms.
The automatic data refreshes and VBA (Excel’s scripting language) enable the automation of reports.

Key features:
- Connects to popular data sources like databases, APIs, SQL Service, etc. via Power Query
- Offers an extensive library of formulas to modify and manage data
- Easily define data relationships and build data models
- Extensive library of charts and other visuals to build reports
- Analyze insights using AI with Microsoft 365 Copilot
- Excel supports Python in Microsoft 365.
Reporting automation features:
- Automatically extract, transform, and load data using Power Query
- Schedule automatic data refreshes for connected sources at set intervals
- Built-in scripting language (VBA) to automate repetitive data analysis tasks
Limitations:
- Requires expertise with Power Query, VBA, and Power Automate for advanced automation
- Performance issues while processing very large datasets locally
- Any kind of formatting / structural changes in the underlying data require manual fixes
- Collaboration is limited in desktop Excel (no real-time co-editing) unless you use Excel Online, which lacks some automation features.
Pricing: You can get a subscription to Microsoft Excel through various options. You can get it standalone at $179.99 or as part of the Microsoft 365 plan. Learn more about Microsoft Excel pricing.
Excel’s VBA and Power Query are advanced reporting features that may require technical expertise. Also, the Desktop version lacks collaboration and sharing, making Excel a choice only for building reports locally.
Bonus: Use Python as an automated reporting tool
There is always an option to build custom solutions for automated reporting. Data engineers and developers can create programs that automate various stages of reporting, such as data extraction, transformation, and visualization.
You can:
- Build a custom program for each step (for e.g. raw data extraction and transformation)
- Deploy the program on a server
- Run the program on a specific schedule via a cron job (e.g., every 6 hours)
Note: While Python is powerful, it requires server setup, error handling, and monitoring. It’s best suited for dev teams, not typical business users.
For example, here’s a Python script that I created to load products from an API, sort the data by price, and save it to a CSV file.
import requests
import pandas as pd
import os

api_url = "https://fakestoreapi.com/products"
output_dir = "reports"
output_csv = os.path.join(output_dir, "products_sorted_by_price.csv")

if not os.path.exists(output_dir):
    os.makedirs(output_dir)

try:
    response = requests.get(api_url, timeout=10)
    response.raise_for_status()
    data = response.json()
    df = pd.DataFrame(data)
    print("Data loaded successfully.")
except requests.exceptions.RequestException as e:
    print(f"Error fetching data: {e}")
    exit(1)
except ValueError as e:
    print(f"Error parsing JSON: {e}")
    exit(1)
except Exception as e:
    print(f"Error: {e}")
    exit(1)

df = df.sort_values(by="price", ascending=False)

df.to_csv(output_csv, index=False)
print(f"Sorted data saved to {output_csv}")
Similarly, you can use Python as an automated reporting tool by deploying the program on a server. But this method is not feasible in most cases, considering the technical expertise and server requirements.
How to pick the right automated reporting tools?
Every reporting software that we listed here has its own pros and cons. Pick a tool that meets your data analysis and reporting requirements, based on these factors:
- Integration needs – Choose an automated reporting software that offers seamless integration with your data sources. For example, if you want to prepare reports from Google’s Services, Looker Studio can be a good option. For businesses using multiple marketing, sales, or financial platforms, ensure your chosen reporting tool can easily receive fresh data from all these sources. Coupler.io will resolve this challenge for you.
- Analytics requirements- If you’re looking for basic analytics and data representation, consider using Google Sheets or Excel for their ease of use. For advanced analytics and data visualization functionality, consider Power BI or Tableau.
- Budget – For smaller teams with limited budgets, free options like Looker Studio and Google Sheets are suitable. You can invest in Tableau or Power BI for enterprise-level reporting needs.
- Scalability – If you’re planning to analyze more data in the future, consider a platform that can handle large datasets, e.g., Power BI and Looker Studio
I suggest taking a moment to try each of these automated reporting tools and finalize the one that meets your needs. In addition, you can use Coupler.io to easily connect data sources to these reporting platforms without any hassle.
Finally, you only need this single tool
Finding the right data connector for reporting is challenging. You might find a great platform, but it’s useless if it lacks native connectors.
One solution is to use Coupler.io to automatically extract data from sources and integrate it into reporting tools. The platform replaces all other data connectors, transformation steps, or custom solutions that you may need to build automated reports.
- 70+ supported data sources – Offers no-code native integration with popular apps for marketing, CRM, sales, accounting tools, etc. You can also connect to REST APIs and pull data from any custom platform.
- Automated dataflows – Set up and schedule dataflows to pull and refresh data into the reports automatically. It can update data as fast as every 15 minutes.
- Data transformations – Easily modify and organize the data before loading into the reports. You can also join multiple datasets into one and streamline data connections.
- Free ready-made templates – Offers plug-and-play reporting templates for popular data sources to quickly build reports and visualize data.
Get started for free: sign up for a Coupler.io account today and start automating reports without any technical headaches.
Automate reporting with Coupler.io
Get started for free