Facebook Ads campaigns generate traffic from around the world, but not all regions deliver equal value. While Facebook Ads Manager provides basic geographic data, it often lacks the depth needed to make strategic budget allocation decisions. You might see high click volumes from certain countries, but without understanding the complete conversion picture across your entire funnel, you’re missing critical optimization opportunities. As a result, it’s hard to figure out why your Facebook Ads not converting.
To cope with this challenge, Coupler.io offers prebuilt data sets and dashboards. They let you see the performance of Facebook Ads geographic data to enable data-driven geographic targeting decisions for your Facebook advertising strategy.

Key insights the geographic performance report can offer
Analyze Facebook Ads performance across countries on a weekly/monthly basis
Using the Facebook Ads manager, it’s rather difficult to understand the complete relationship between impressions, clicks, costs, and conversions across different regions. However, you need to understand the complete picture of Facebook Ads performance for market prioritization and budget allocation.
Solution reference: Coupler.io provides a prebuilt data set template that combines essential Facebook Ads performance metrics by country for complete geographic analysis. You get aggregated data by week and month to track long-term trends, seasonal patterns, and market evolution.

What you can do:
- Identify market opportunity gaps: Countries with high impressions but low click-through rates indicate creative optimization opportunities specific to those markets.
- Detect budget allocation inefficiencies: Countries receiving high spend but delivering poor performance across all metrics should have their budgets reallocated.
- Identify market maturation cycles: Some countries may show declining performance efficiency over 6+ months despite stable targeting. This indicates market maturation and requires audience expansion or creative refresh.
- Uncover seasonal geographic arbitrage opportunities: Markets with consistent performance spikes during specific quarters reveal timing opportunities for budget concentration and scaling.
- Optimize cross-campaign geographic strategies: Analyze how different campaign types perform in the same countries to develop market-specific approaches.
- Predict geographic scaling potential: Historical performance correlation analysis helps identify which current small markets are likely to scale successfully with increased budget investment.
Automate Facebook Ads analytics with Coupler.io
Get started for freeIdentify traffic quality patterns and fraudulent regions
Do you have campaigns that waste budget on countries that generate high click volumes but deliver poor engagement quality? At the same time, you may overlook markets with smaller but more engaged audiences.
Understanding which countries provide genuine audience engagement helps prevent budget waste.
Solution reference: With the help of the Facebook Ads dashboard, you can see the geographic distribution patterns of clicks to identify traffic quality variations.

What you can do:
- Spot unusual click concentration patterns: Countries with disproportionately high click volumes compared to their market size may indicate low-quality traffic sources.
- Identify consistent engagement markets: Countries with steady click performance over time represent reliable audience segments worth maintaining.
- Discover overlooked profitable markets: Small countries with consistent click performance often provide cost-efficient expansion opportunities.
- Compare click efficiency across regions: Use click volume analysis to identify which markets provide the most engaged audiences.
Uncover revenue generation inefficiencies across markets
E-commerce campaigns often show positive click metrics while hiding massive geographic inefficiencies. For instance, certain countries consume significant ad spend but generate minimal purchase revenue.
So, it’s crucial to reveal how purchase performance varies by country. You can identify which regions deliver profitable customers versus those that consume budget without generating meaningful sales revenue.
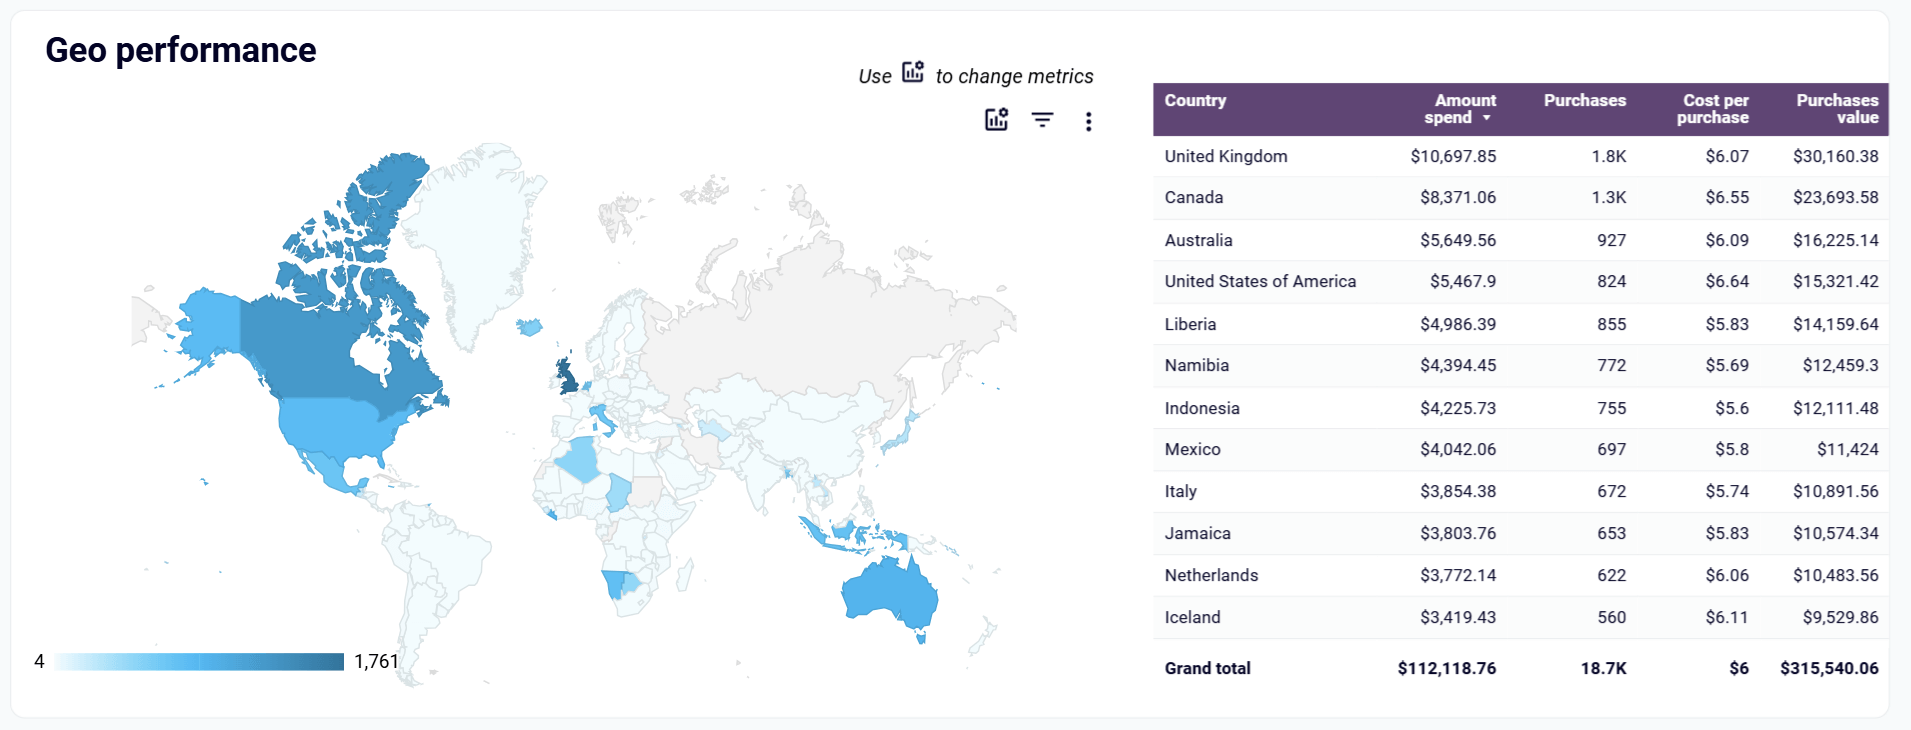
Solution reference: To monitor the efficiency of e-commerce campaigns, Coupler.io offers the Facebook Ads e-commerce dashboard. It contains the geo performance chart to reveal purchase volume, ROAS, and purchase value by country.
Facebook Ads ecommerce performance dashboard

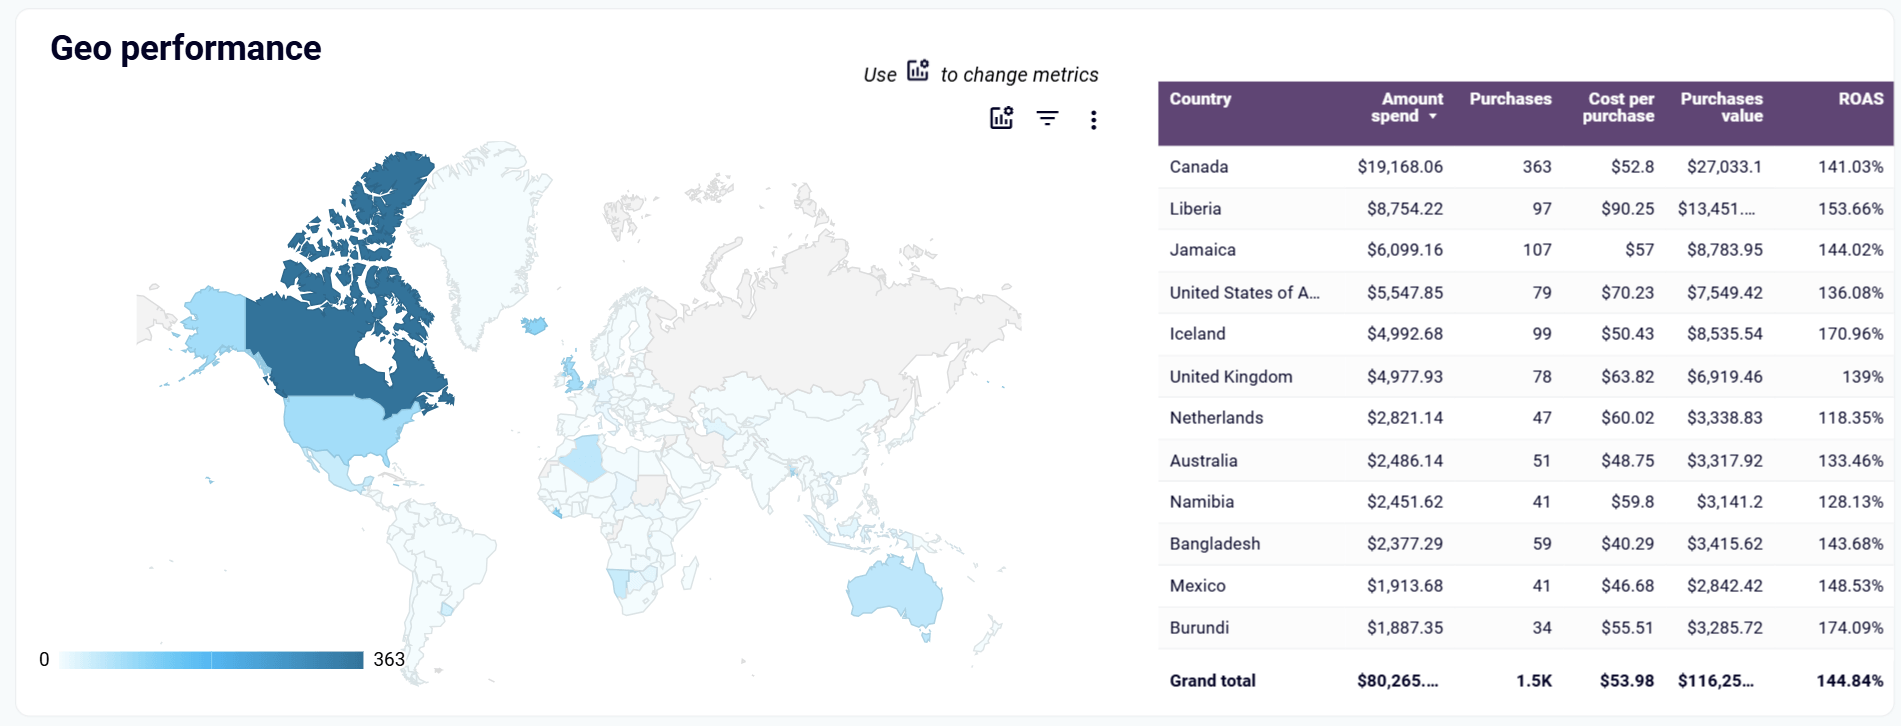
Facebook Ads ecommerce performance dashboard
Preview dashboardWhat you can do:
- Identify revenue concentration risks: When few countries generate the majority of purchase value while others produce minimal revenue, it indicates dangerous market dependency.
- Uncover hidden profitable markets: Countries with exceptionally high ROAS represent major scaling opportunities that may be receiving insufficient budget.
- Detect purchase value disparities: Markets showing high purchase volume but low total purchase value may require different product positioning strategies.
- Eliminate revenue-draining regions: Countries with consistent ROAS below 100% should be excluded to improve overall campaign profitability.
Expose customer acquisition cost variations by region
Purchase-focused campaigns often struggle with uneven customer acquisition costs across different countries. This usually leads to inefficient budget allocation when volume is prioritized over profitability.
Understanding how cost per purchase varies across different markets reveals which geographic regions provide the most cost-effective path to acquiring paying customers.
Solution reference: The country performance table in the Facebook Ads purchases breakdown dashboard provides detailed cost per purchase analysis by market.
Facebook Ads purchases breakdown dashboard

Facebook Ads purchases breakdown dashboard
Preview dashboardWhat you can do:
- Compare acquisition efficiency across markets: Countries with significantly lower cost per purchase offer more efficient customer acquisition than higher-cost regions.
- Identify premium customer markets: Countries generating exceptionally high purchase values may justify higher customer acquisition costs.
- Scale cost-efficient regions: Markets with both low cost per purchase and high purchase volume represent optimal scaling opportunities.
- Optimize budget allocation: Redistribute spend from high-cost, low-value countries to efficient markets with proven conversion rates.
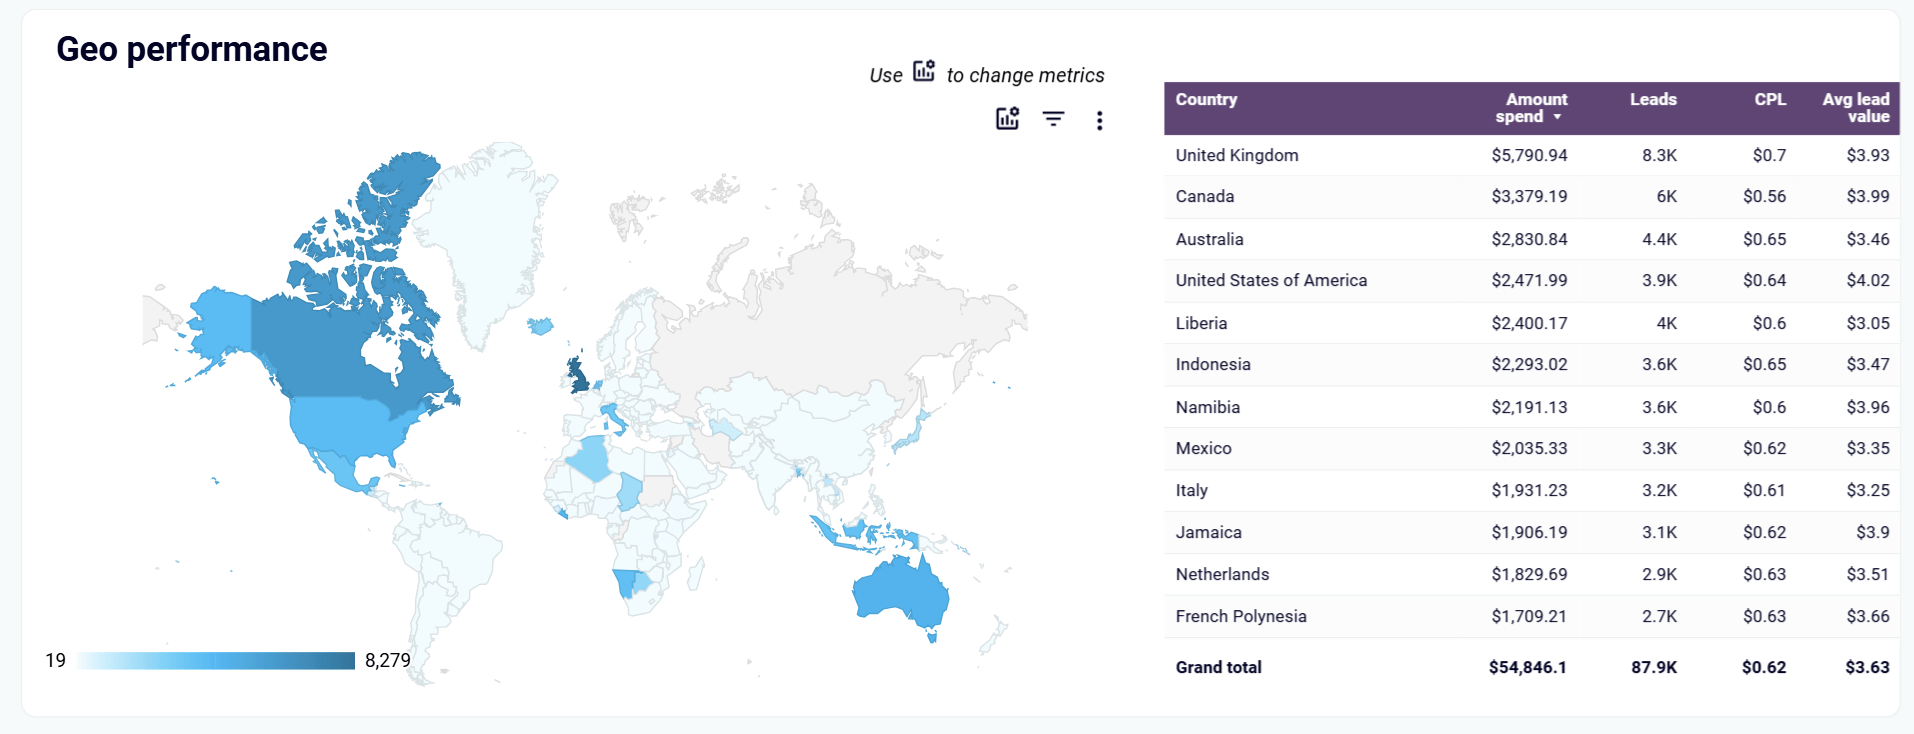
Reveal lead quality variations across geographic markets
Lead generation campaigns on Facebook often focus on cost per lead metrics. At the same time, PPC experts often ignore lead quality disparities across countries, which results in high-volume yet low-value lead generation.
Based on this, it’s important to discover how lead generation costs and volume vary across different countries. With this insight, you can distinguish between markets that generate qualified prospects versus those producing leads that waste sales resources.
Solution reference: The Facebook Ads leads breakdown dashboard is designed specifically to analyze the efficiency of campaigns aimed at lead generation. It provides a geo chart + table showing leads, cost per lead, and average lead value by country.
Facebook Ads leads breakdown dashboard

Facebook Ads leads breakdown dashboard
Preview dashboardWhat you can do:
- Identify cost-efficient lead markets: Countries with significantly lower cost per lead provide affordable lead generation opportunities.
- Scale high-volume lead regions: Markets generating substantial lead volume represent proven demand worth expanding.
- Compare lead value across regions: Countries with higher average lead values indicate markets with more qualified prospects worth prioritizing.
- Optimize lead generation spend: Reallocate budget from high-cost, low-volume markets to regions with proven lead generation efficiency.
Discover user engagement patterns across different markets
Mobile app campaigns often optimize for install volume while ignoring geographic differences in user engagement and in-app purchase behavior.
What values does the understanding of how mobile app install and purchase behavior varies by country reveal? You can see which markets provide users who generate long-term app revenue versus those who install but create minimal value.
Solution reference: The geo performance analysis in the Facebook Ads performance for mobile apps dashboard lets you track mobile app installs, purchases, and cost per purchase by country.
Facebook Ads performance for mobile apps dashboard

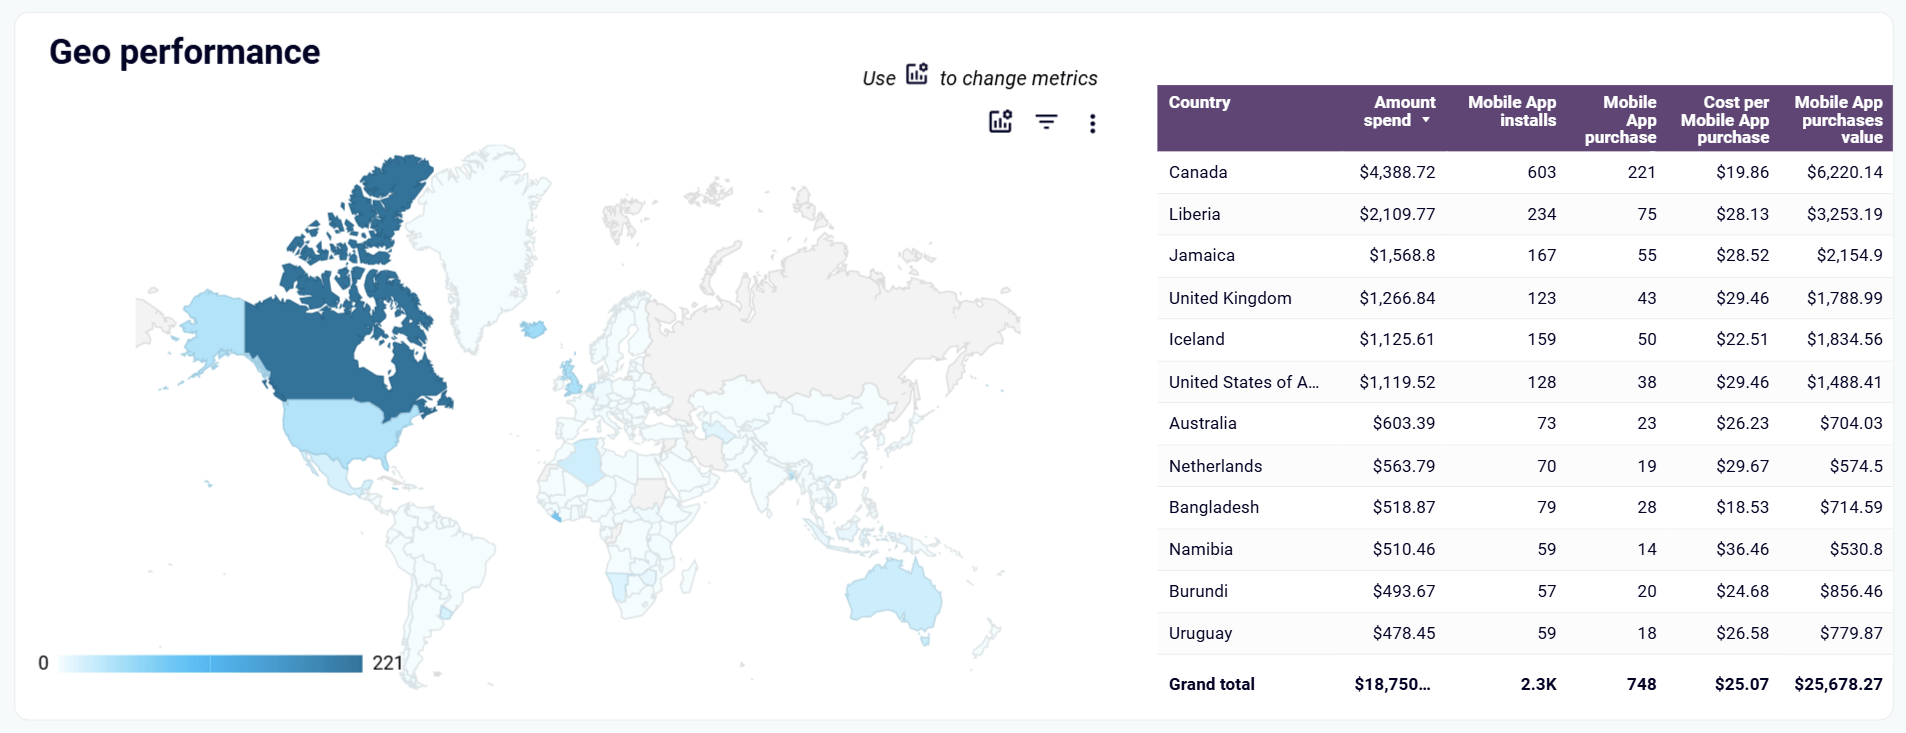
Facebook Ads performance for mobile apps dashboard
Preview dashboardWhat you can do:
- Identify high-value user markets: Countries with strong install-to-purchase conversion rates indicate valuable user segments.
- Compare cost efficiency across markets: Markets with low cost per mobile app purchase offer affordable user acquisition opportunities.
- Scale profitable user acquisition: Countries with high mobile app purchase values indicate valuable user segments worth expanding.
- Optimize install campaign targeting: Focus budget on regions with proven track records of generating paying app users.
Ready-to-use solutions for geographic performance analytics
With Coupler.io, you can export data from Facebook Ads and turn it into a geographic performance report easily with the help of pre-built solutions: data set templates and dashboards.
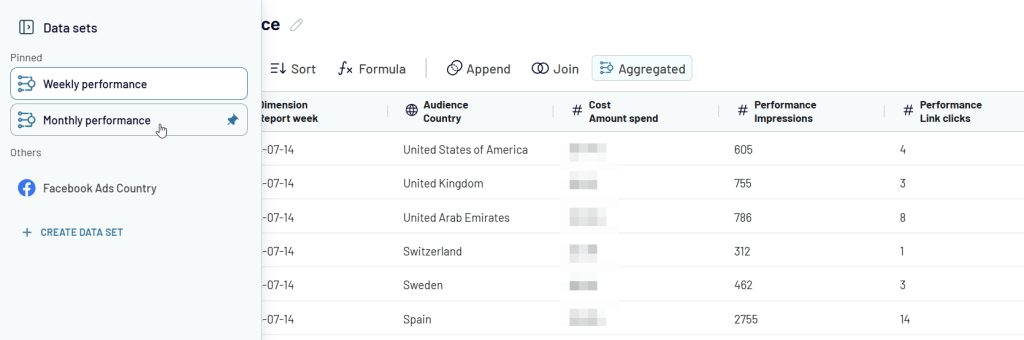
Facebook Ads country performance data set
Data sets in Coupler.io are ready-to-analysis data that does not require any actions from you, like column management or creating custom metrics. Everything is preset, and you only need to connect your data source.
The Facebook Ads country performance data set consists of two views: Monthly and Weekly performance. Each view shows Facebook Ads metrics breakdown by country and by month/week. You can track the following metrics:
- Amount spend
- Impressions
- Link clicks
- Unique link clicks
- CTR
- CPC
Once you’ve connected your Facebook Ads account, it takes a couple of minutes to preload your data set. Then you can choose where to load it:
- Spreadsheet apps – Google Sheets, Microsoft Excel
- BI tools – Looker Studio, Power BI, Tableau, Qlik
- Data warehouses – BigQuery, Amazon Redshift, PostgreSQL
- AI tools – Claude, ChatGPT (we’ll discuss this option later)
Check out what this data set looks like:
To make this data set live, enable the automatic data refresh and configure the desired schedule.
Facebook Ads dashboards with geographic performance reports
Coupler.io offers multiple Facebook Ads dashboards designed for different business models and campaign objectives. Each dashboard focuses on specific conversion events while maintaining comprehensive geographic analysis capabilities.
These dashboards transform raw Facebook Ads data into visual insights that highlight regional opportunities and optimization needs:
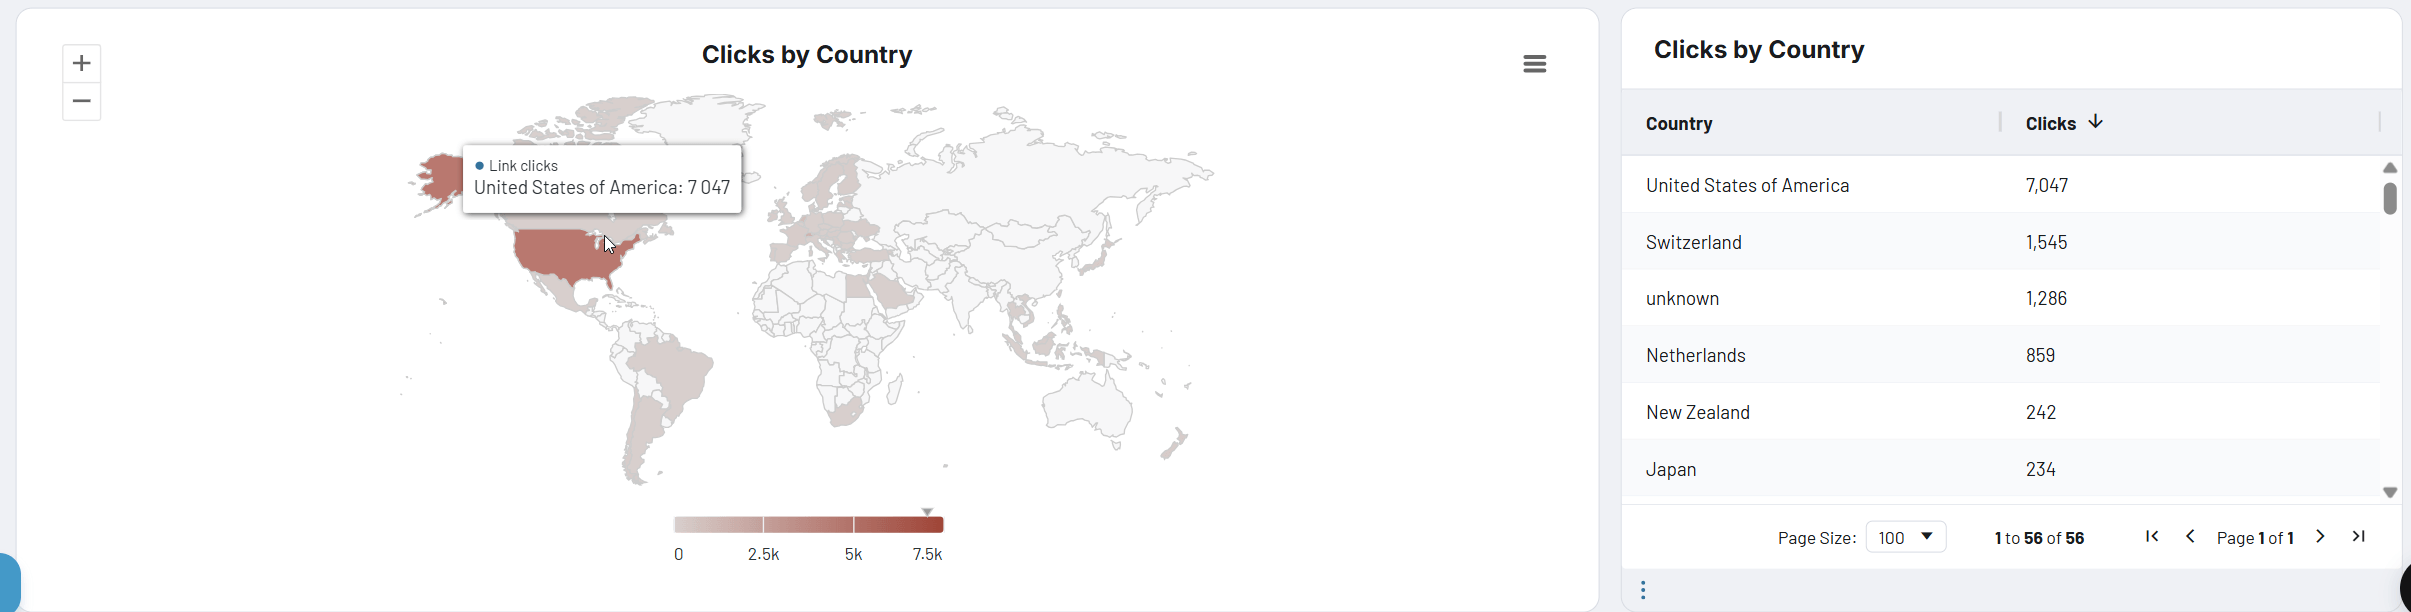
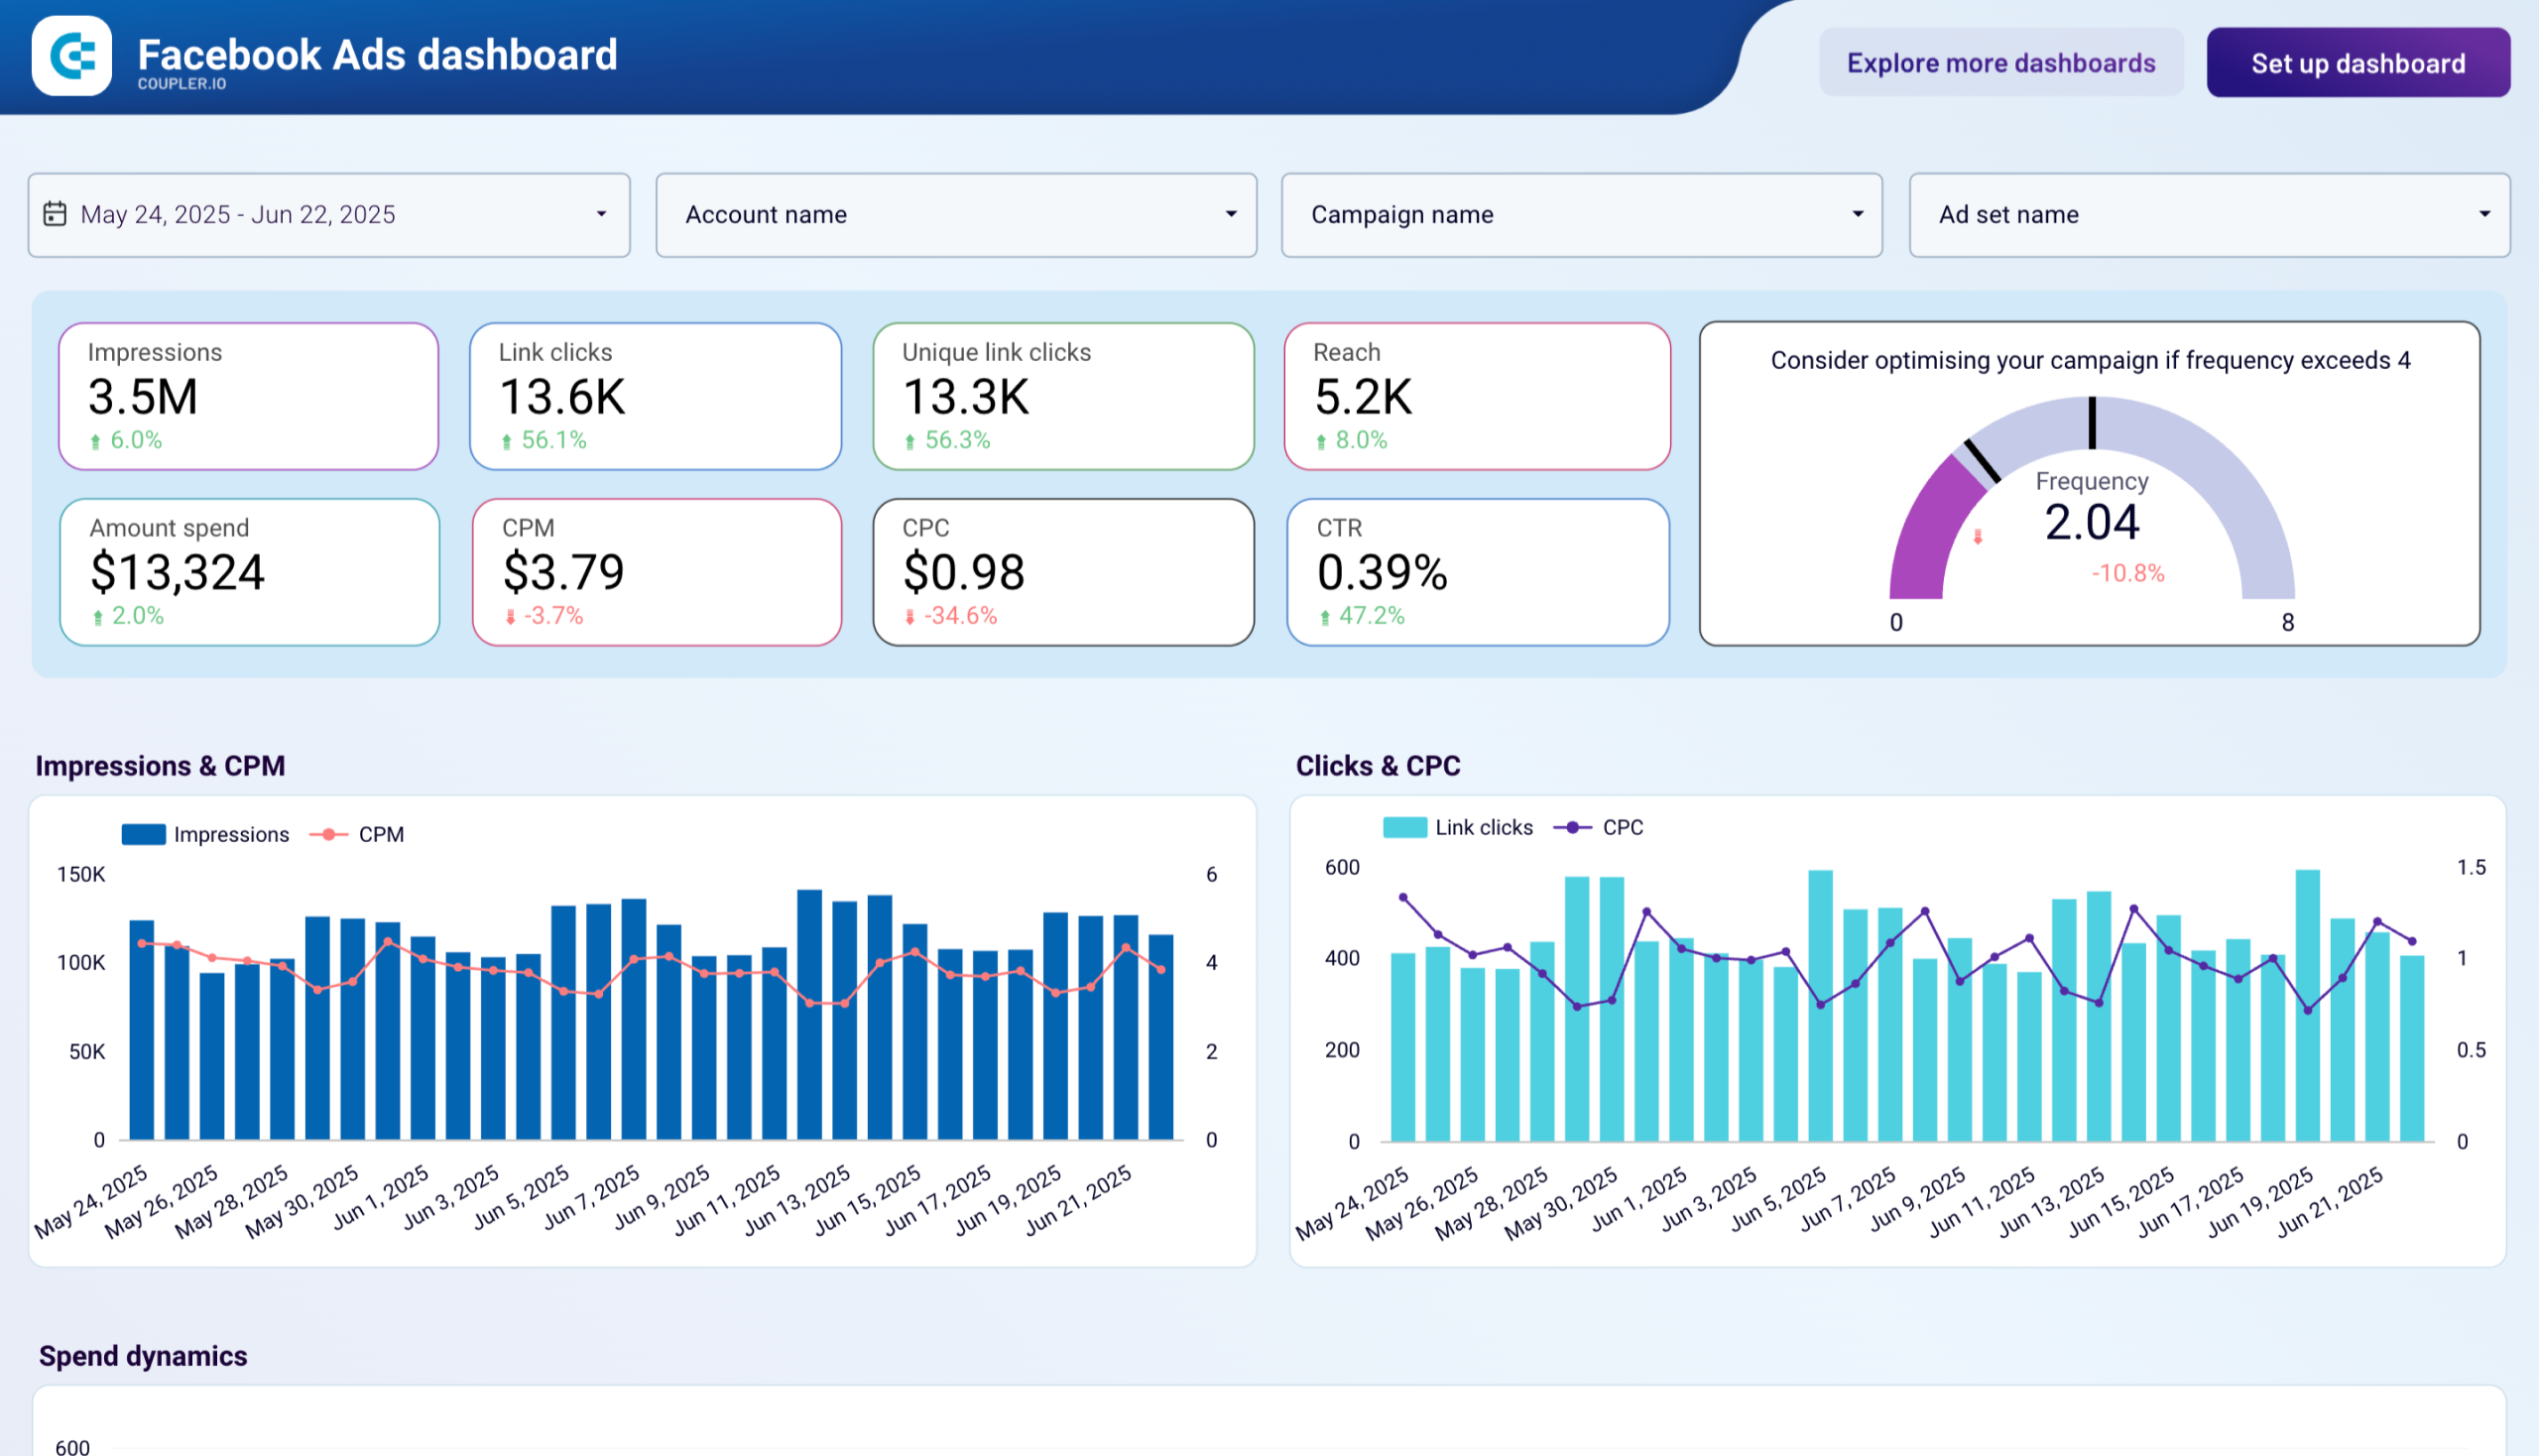
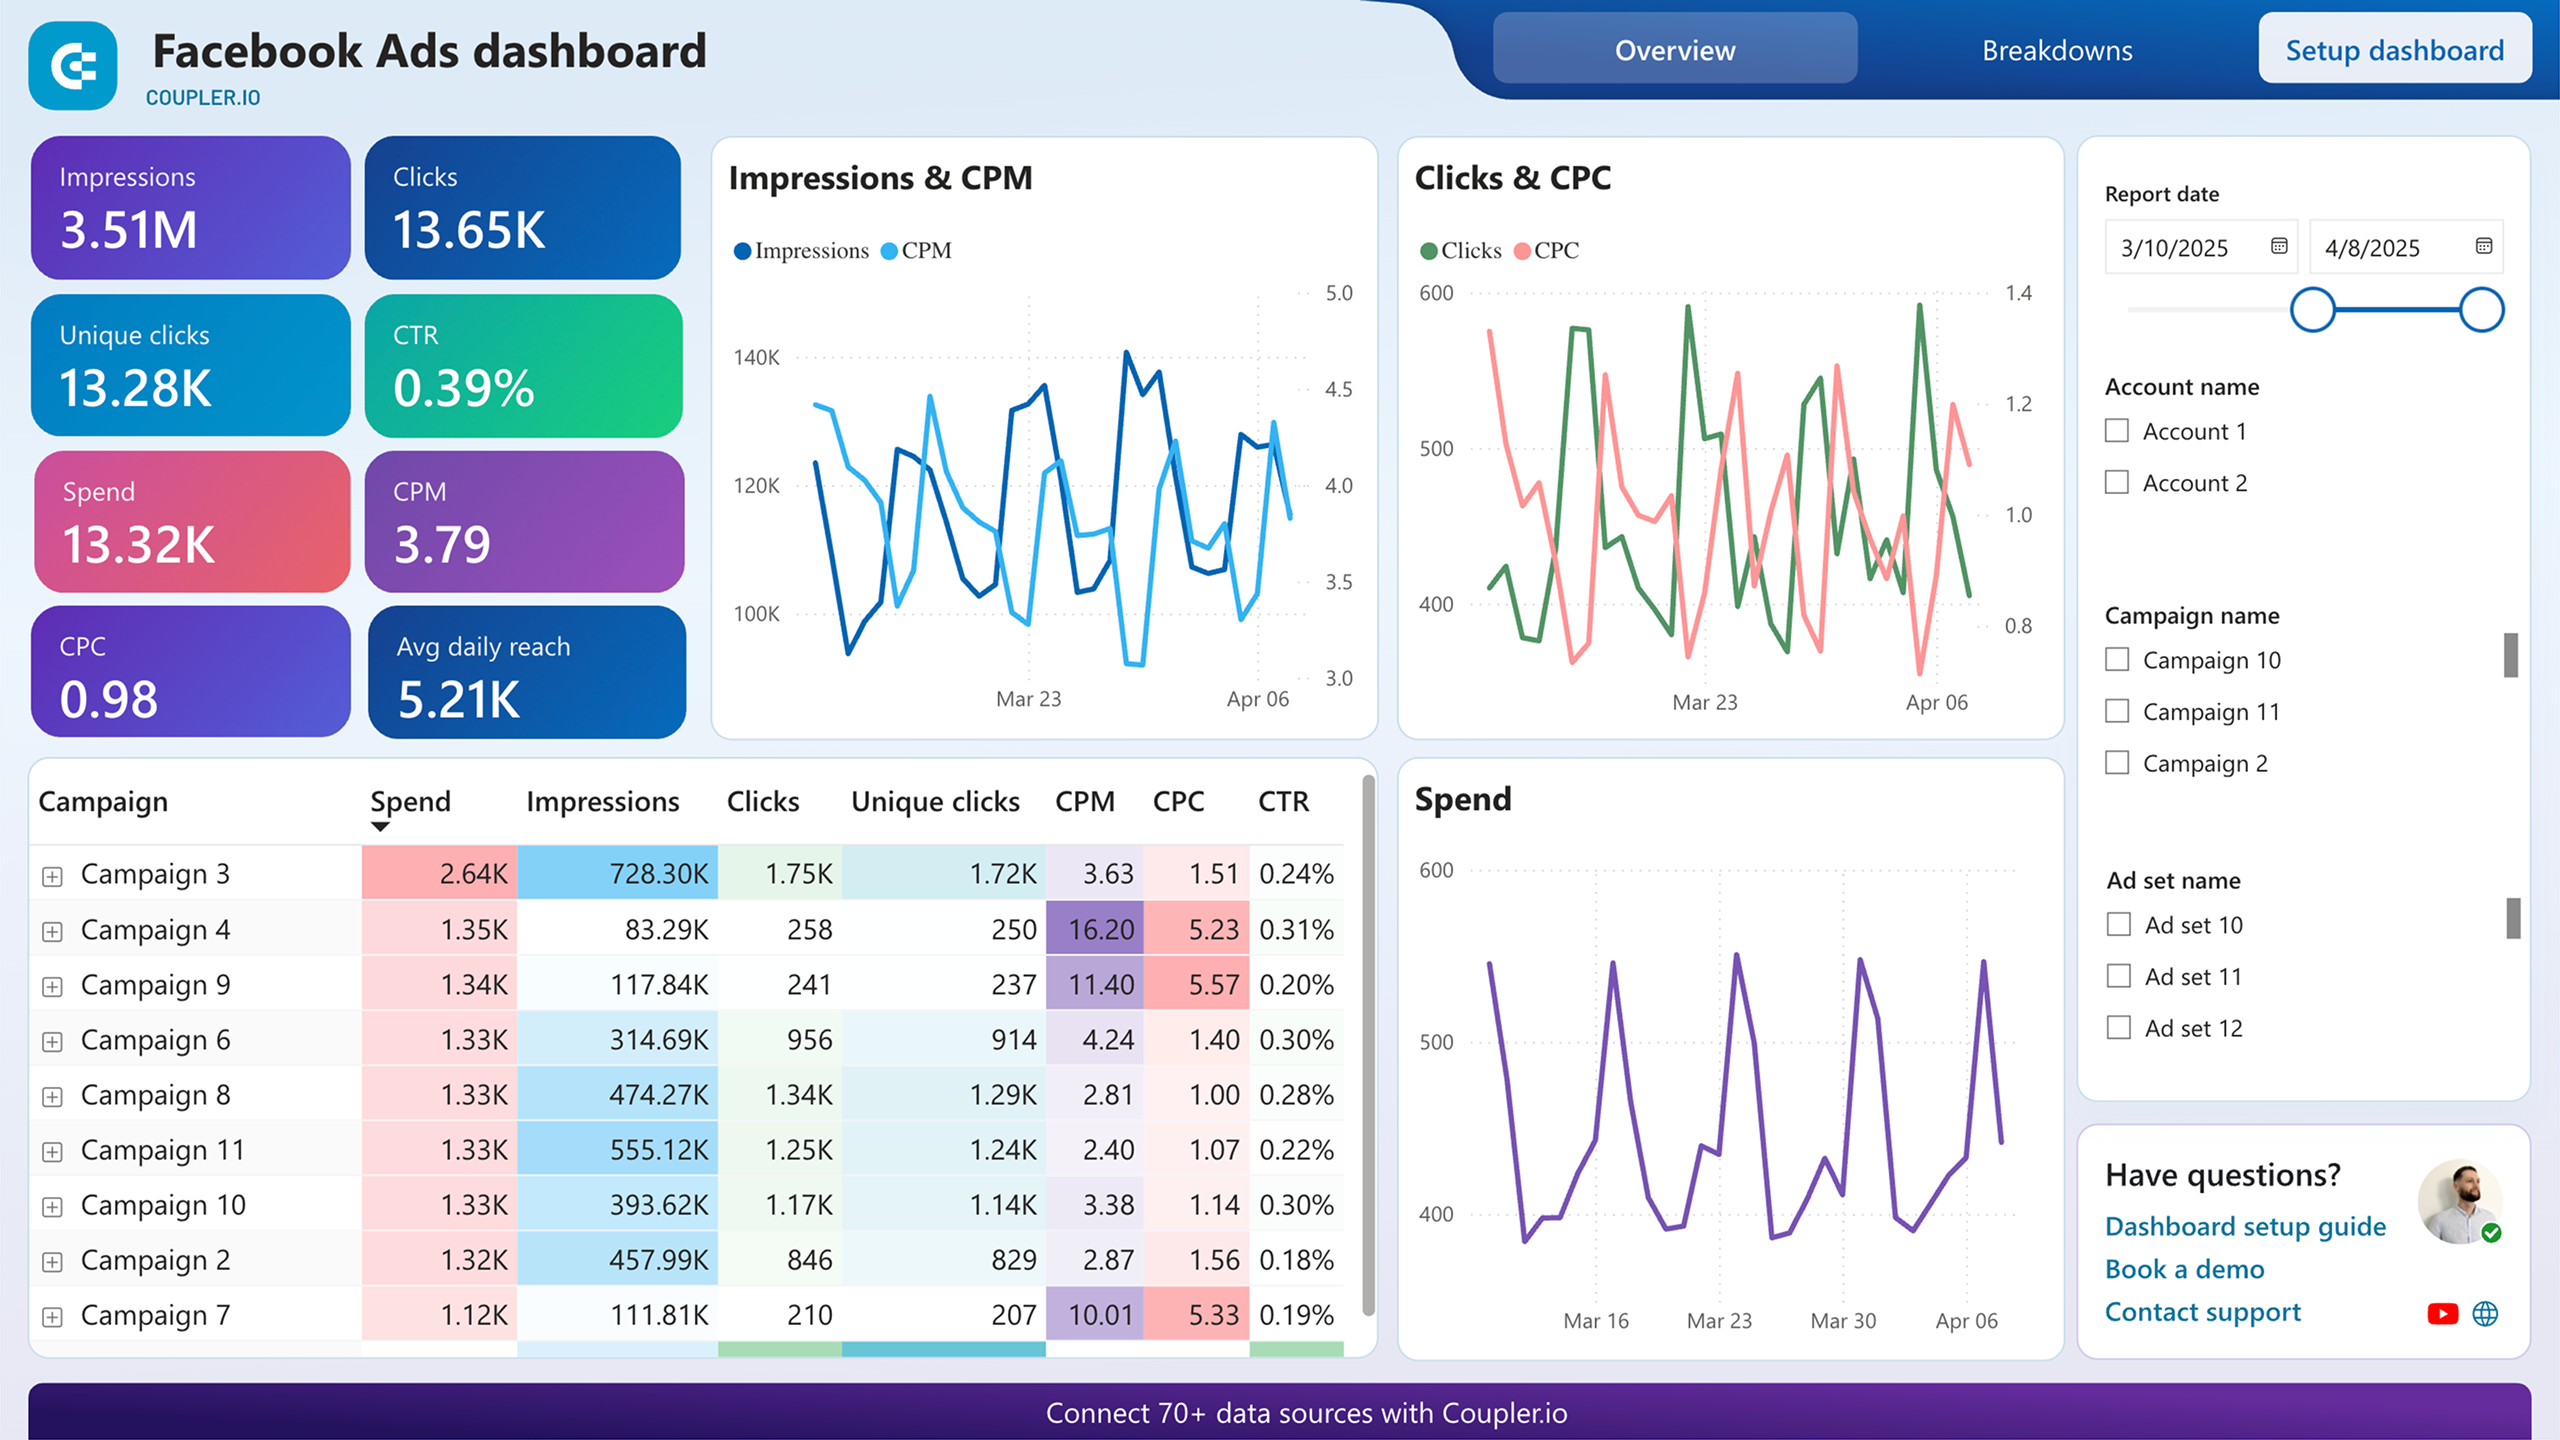
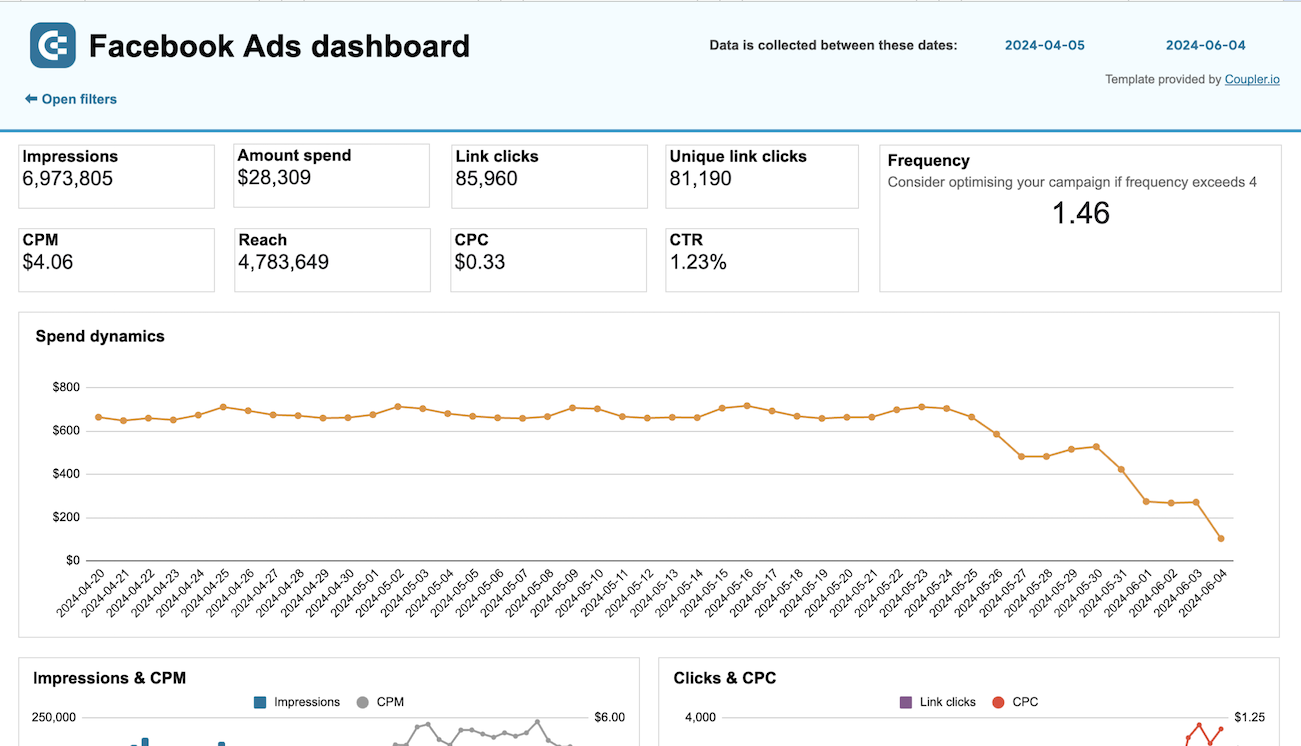
Facebook Ads dashboard provides fundamental geographic analysis with clicks by country breakdown. Features frequency tracking and monthly dynamics analysis. Perfect for businesses focused on traffic generation and understanding regional click performance patterns.

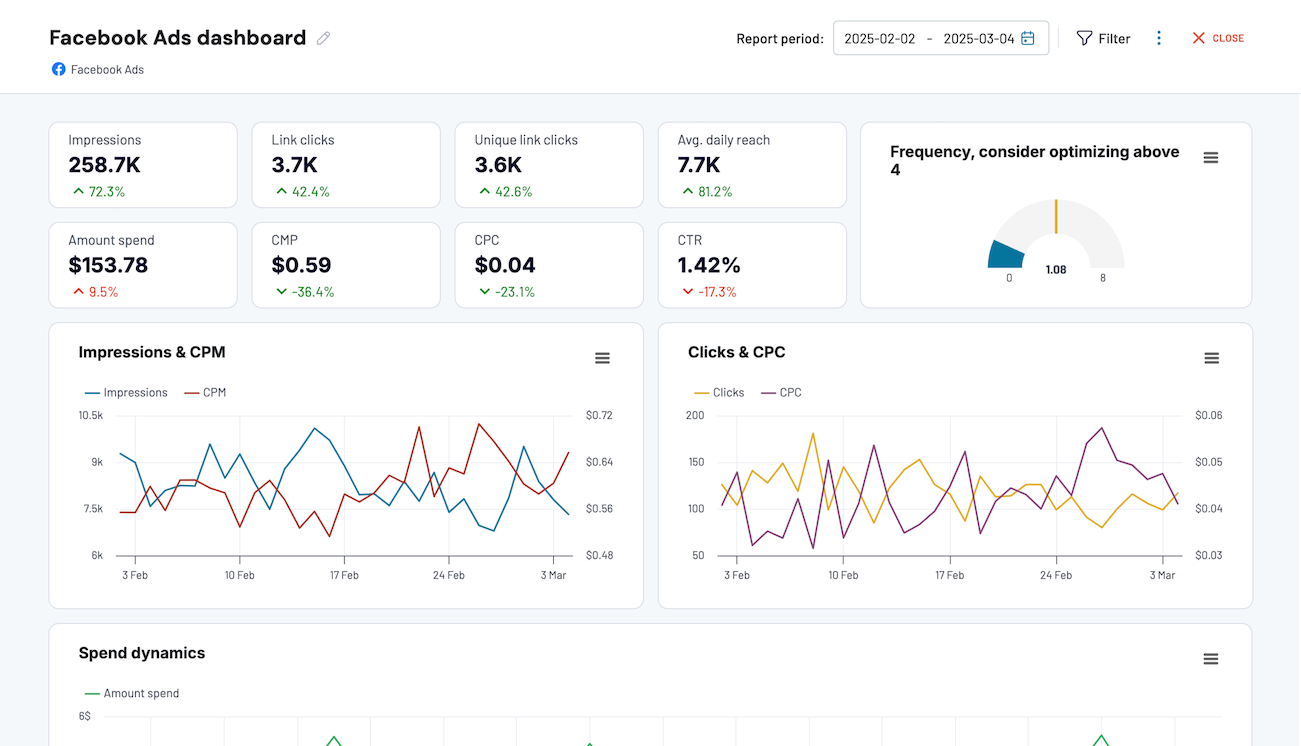
Additional insights this dashboard provides:
- Frequency meter tracking ad exposure levels across campaigns
- Clicks by demographics breakdown (age and gender analysis)
- Monthly dynamics showing key performance metrics evolution over time
- Campaign performance overview with impressions, clicks, and cost data

Facebook Ads dashboard template in Looker Studio
Effectively manage and optimize your Facebook advertising campaigns, reaching your target audience in a data-driven way.


Facebook Ads dashboard template in Power BI
Get a detailed overview of your advertising campaigns’ performance using a dynamic Power BI dashboard template equipped with a no-code Facebook Ads connector

Facebook Ads dashboard template in Google Sheets
Monitor the performance of your advertising campaigns in Facebook and identify top assets to spend your budget wisely.
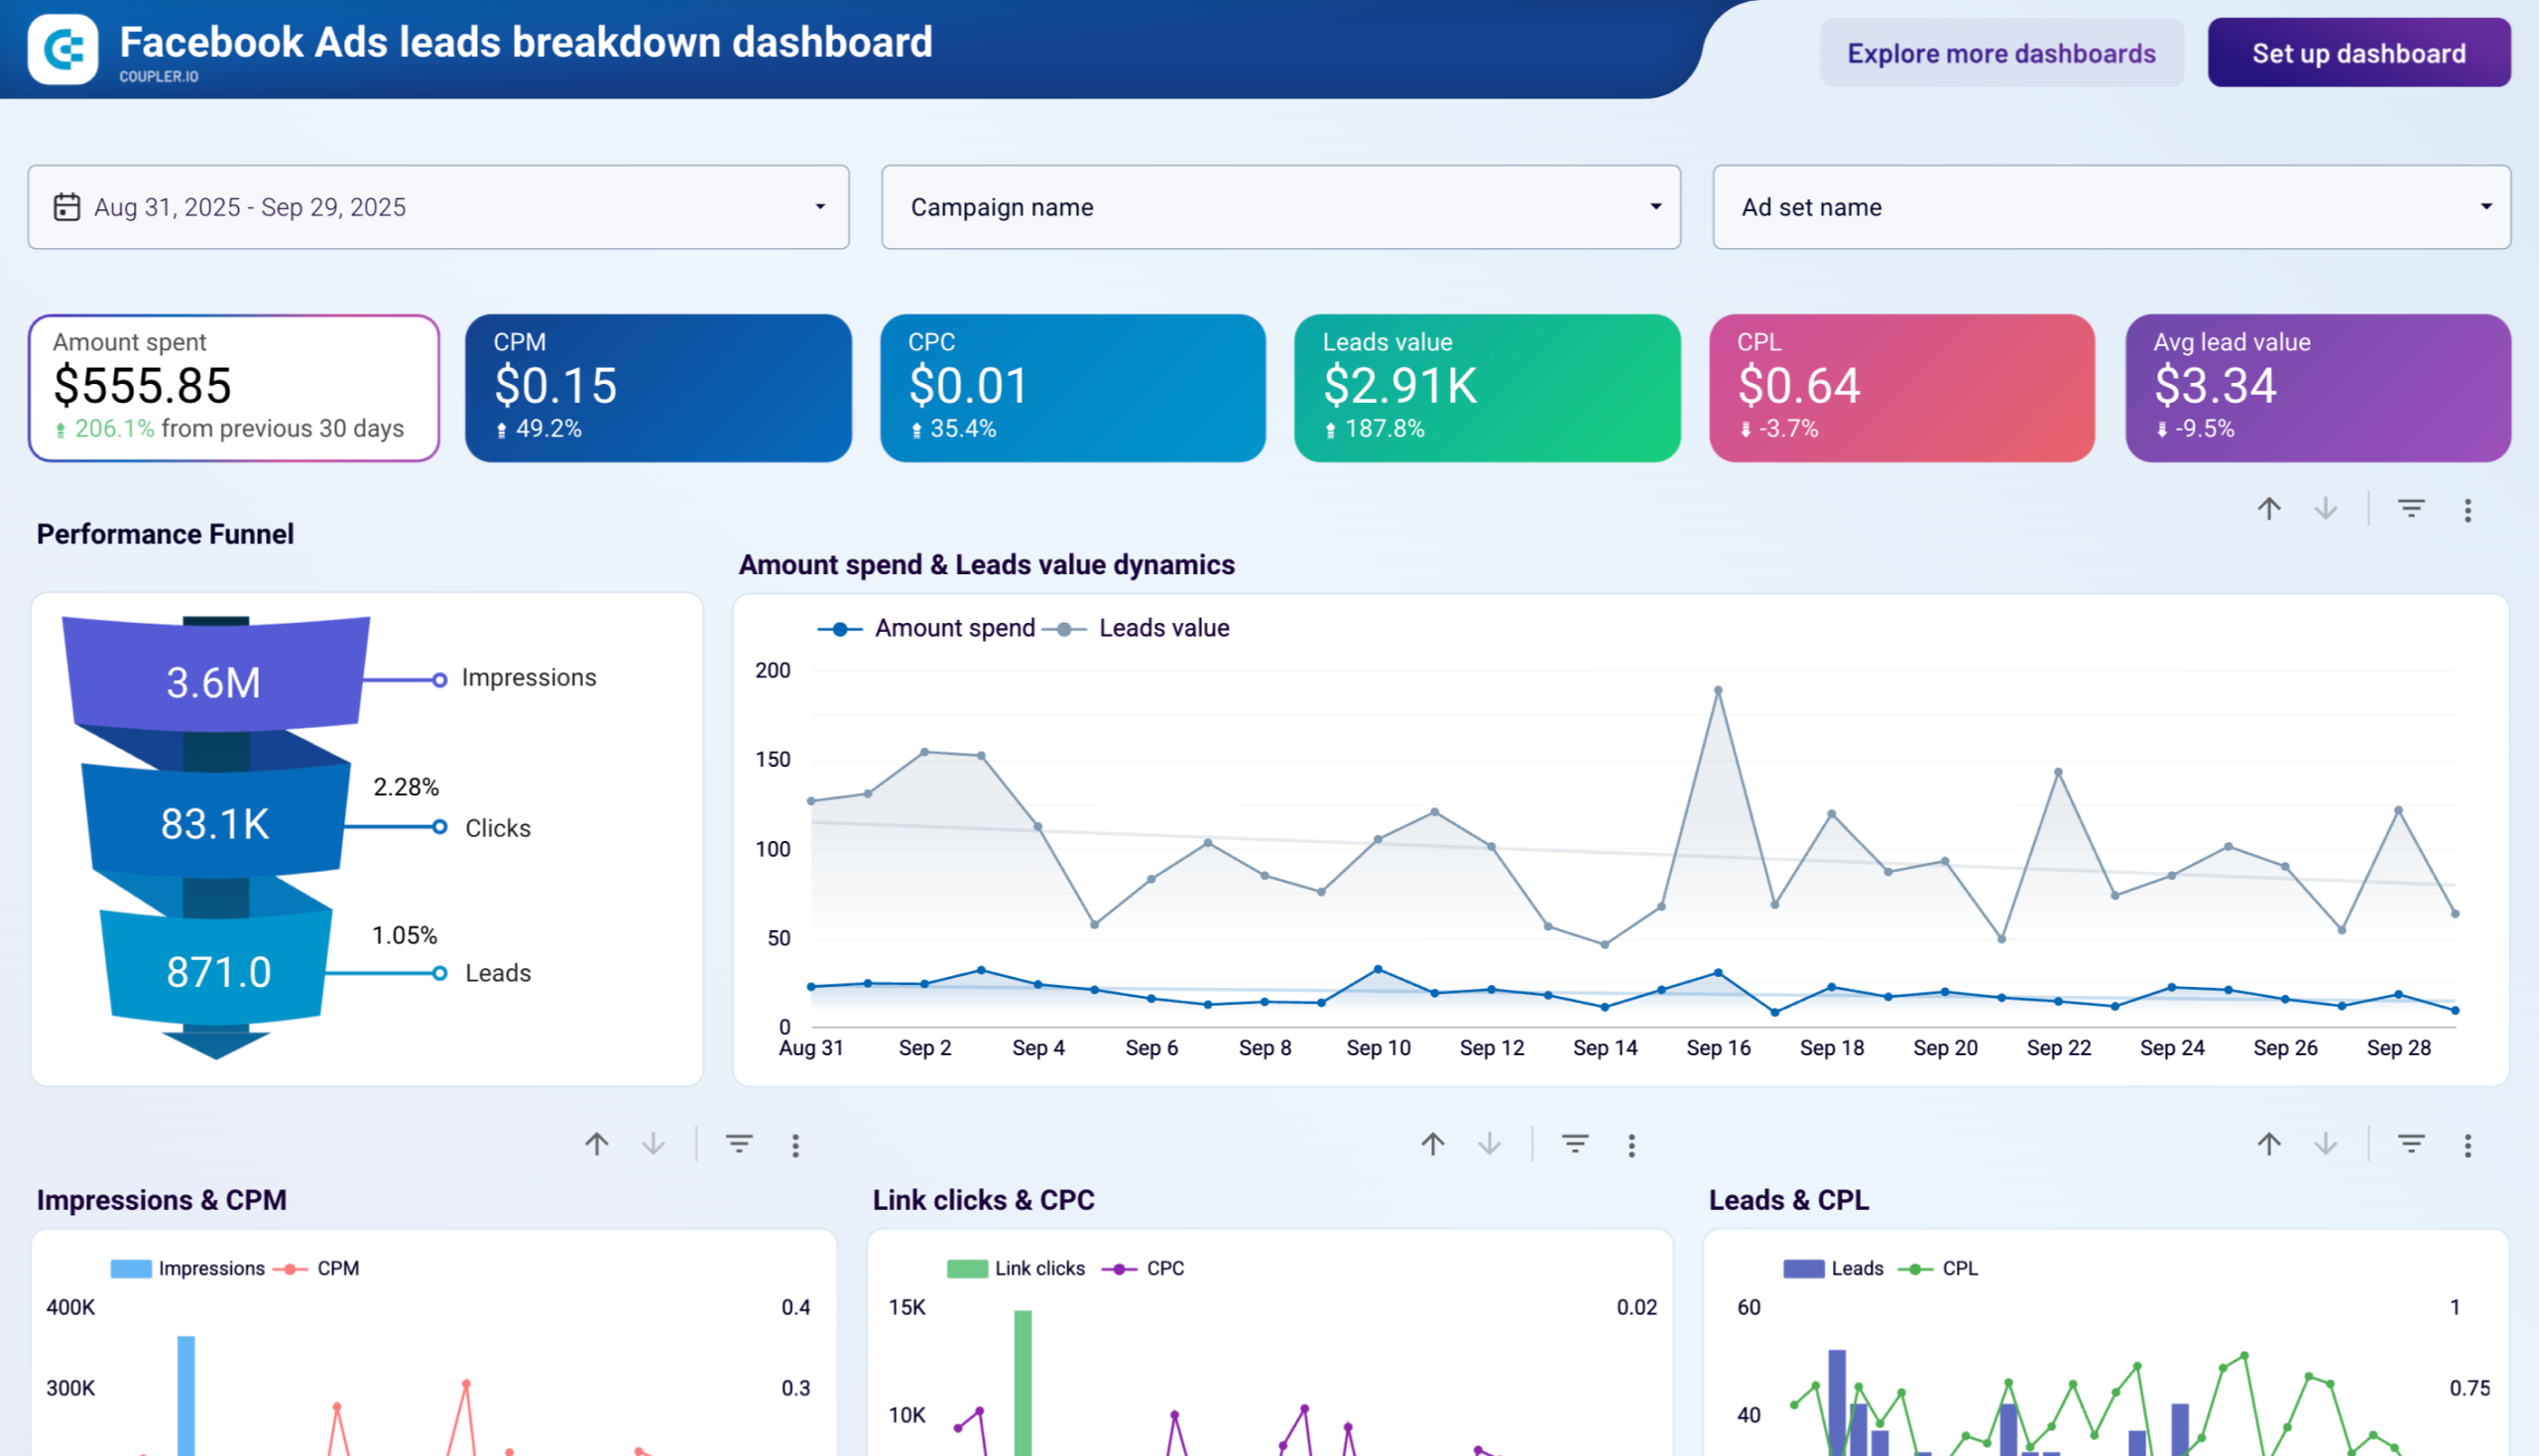
Facebook Ads leads breakdown dashboard specializes in lead generation analysis with country-level lead volume, cost per lead, and average lead value tracking. Includes monthly dynamics for lead performance trends. Ideal for B2B companies and service providers running lead generation campaigns.
Additional insights this dashboard provides:
- Performance funnel visualization from impressions to clicks to leads
- Campaign performance breakdown table with detailed lead metrics per campaign
- Monthly dynamics tracking leads, lead value, cost per lead over time
- Leads and lead value analysis by demographics (age and gender)

Facebook Ads leads breakdown dashboard
Analyze the complete lead generation funnel from your Facebook lead ads. Track how impressions convert to leads with detailed cost analysis, lead value tracking, and demographic performance insights.
Facebook Ads leads breakdown dashboard in Looker Studio
Analyze the performance of your advertising campaigns on Facebook in converting traffic into leads.
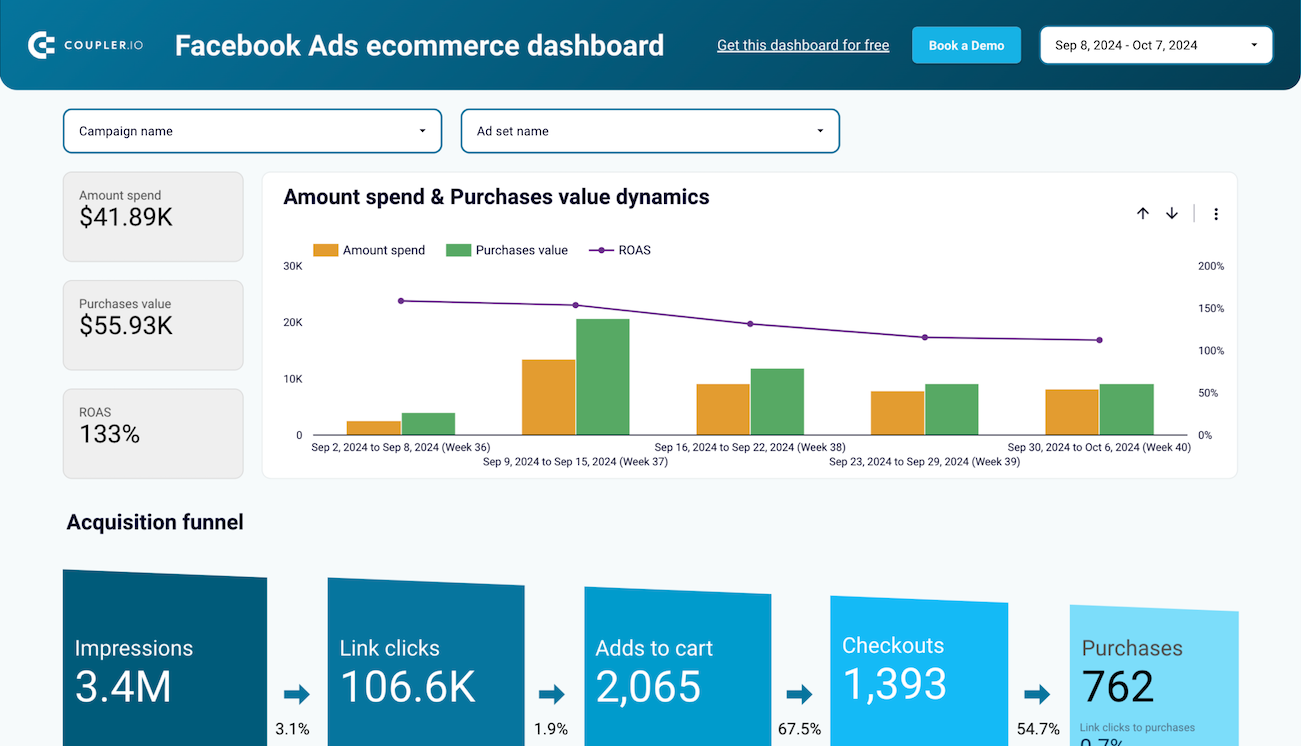
Facebook Ads ecommerce performance dashboard focuses on e-commerce conversion analysis with detailed geographic breakdown of purchases, cost per purchase, ROAS, and purchase value by country. Features performance dynamics tracking and conversion funnel analysis. Essential for online retailers and e-commerce businesses.
Facebook Ads ecommerce performance dashboard
Facebook Ads ecommerce performance dashboard
Preview dashboardAdditional insights this dashboard provides:
- Campaign analysis with flexible filtering by individual campaigns or ad sets
- Conversion funnel analysis tracking user journey from impression to purchase
- Performance dynamics monitoring clicks, purchase events, and conversion rates
- Monthly dynamics showing spend correlation with business goals like purchases
- Demographics performance tracking purchase volume and value by age and gender
Facebook Ads performance for mobile apps dashboard tracks mobile app campaigns with geographic performance metrics including mobile app installs, mobile app purchases, and cost per mobile app purchase by country. Perfect for mobile app developers and gaming companies.
Facebook Ads performance for mobile apps dashboard
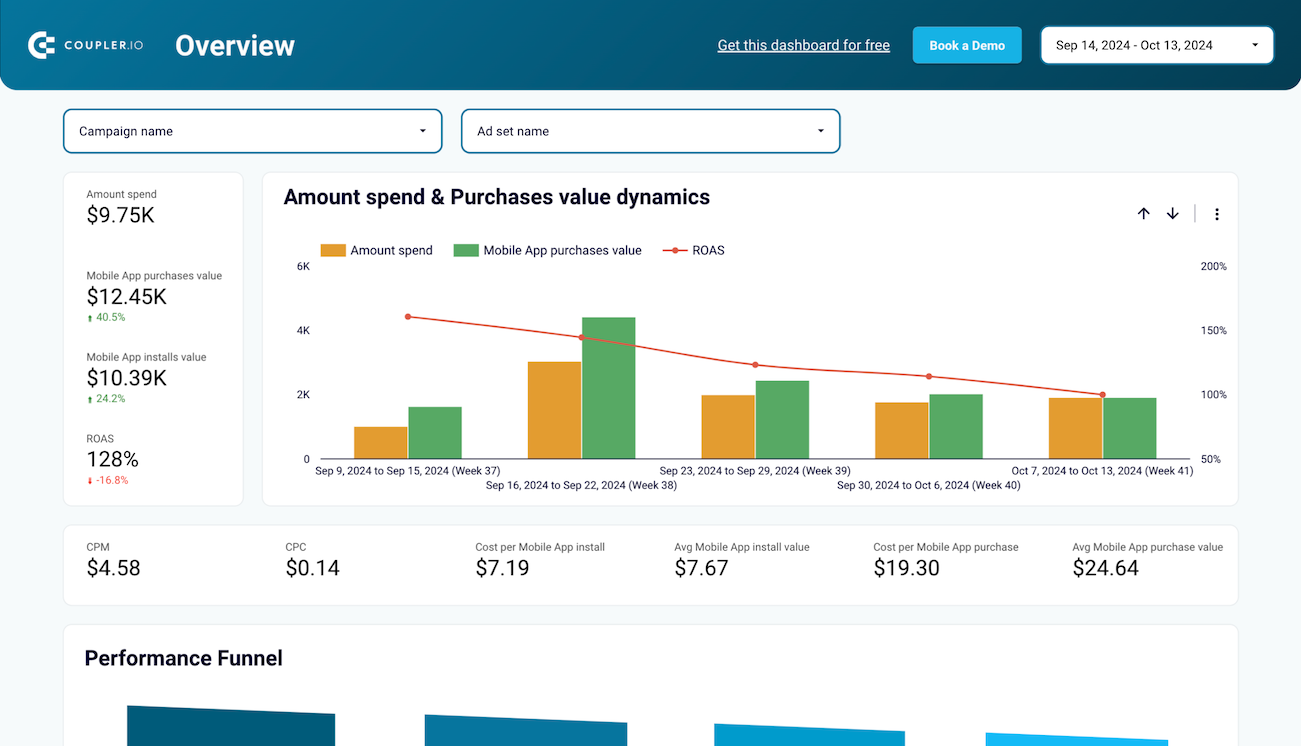
Facebook Ads performance for mobile apps dashboard
Preview dashboardAdditional insights this dashboard provides:
- Performance funnel displaying mobile marketing funnel from impression to purchase
- Budget and ROI tracking showing ad spend, purchase value, and ROAS
- Campaign comparison table evaluating campaigns across multiple performance metrics
- App usage monitoring connecting advertising efforts to actual app engagement patterns
Facebook Ads purchases breakdown dashboard provides purchase tracking with geographic analysis of purchase volume, purchase value, and cost per purchase by region. Includes monthly dynamics and performance funnel analysis for purchase optimization.
Facebook Ads purchases breakdown dashboard

Facebook Ads purchases breakdown dashboard
Preview dashboardAdditional insights this dashboard provides:
- Purchase value dynamics tracking total purchase value changes over time
- Performance funnel visualization showing path from impressions to purchases
- Campaign performance breakdown with detailed purchase metrics per campaign
- Monthly dynamics comprehensive view of campaign performance over time
Each dashboard includes Coupler.io’s built-in connector to automate data flow from Facebook Ads and keep your dashboard up-to-date.
Ask AI about your Facebook Ads geographic performance
We’ve mentioned that you can load your Facebook Ads data to AI for geographic performance analysis. This means you won’t have to export your data as a CSV or PDF and upload it to Claude or ChatGPT. Coupler.io offers AI integrations to connect Facebook Ads geographic data directly to AI tools, transforming manual analysis into conversational insights.
No need to spend hours analyzing country performance spreadsheets and calculating regional ROI manually. Just tell AI to do this or ask other natural language questions to receive data-specific recommendations based on your actual campaign performance. This approach delivers precise, actionable insights rather than generic geographic targeting advice.
Sample questions you can ask:
- “Which countries have the highest ROAS but receive less than 10% of my total budget?”
- “Show me countries where cost per purchase increased more than 20% last month”
- “Which geographic markets should I expand to based on current conversion rates and costs?”
- “Identify countries with high click volume but poor purchase conversion rates”
- “What’s the optimal budget distribution across my top 5 performing countries?”
Real-world example: Geographic performance analysis in seconds
Sample query: “Show me the worst-performing countries by clicks and recommend what I can do to improve them.”
AI analysis results:
Based on your Facebook Ads geographic data, here are your underperforming regions and specific improvement recommendations:
TRAFFIC VOLUME ISSUES
- India: 12,847 clicks, $0.08 CPC, but only 23 conversions (0.18% conversion rate)
- Performance: Very low cost per click but extremely poor conversion efficiency
- Problem: Traffic quality mismatch with product offering and pricing
- Recommendation: Exclude India from purchase campaigns and focus on brand awareness objectives instead
CONVERSION EFFICIENCY PROBLEMS
- Brazil: 8,934 clicks, $0.45 CPC, 156 conversions but $2.40 cost per conversion
- Performance: Decent click volume and moderate costs, but poor conversion value
- Problem: Audience targeting too broad, attracting unqualified traffic
- Recommendation: Implement lookalike audiences based on existing customers and narrow interest targeting
COST OPTIMIZATION OPPORTUNITIES
- Germany: 3,245 clicks, $1.85 CPC, 298 conversions with $8.50 cost per conversion
- Performance: Higher costs but strong conversion rates (9.2%) and customer value
- Problem: Standard bidding strategy not optimized for high-value market
- Recommendation: Increase budget allocation by 40% and implement value-based bidding for this premium market
Priority actions:
- Immediately exclude India from purchase-focused campaigns (currently consuming 18% of daily budget)
- Redistribute 30% of Brazil’s budget to Germany and similar high-converting markets
- Test localized Portuguese creative variations in Brazil to improve conversion rates
Integrate your Facebook Ads data with AI for conversational analysis
Get started for freeChoose your geographic performance approach
Traditional geographic optimization means exporting Facebook Ads data, building pivot tables by country, calculating ROAS manually, and hoping you didn’t miss any critical regional patterns. This process consumes valuable time that could be spent on actual optimization.
Coupler.io offers a fundamentally different approach through three complementary solutions that work together seamlessly:
Dashboards deliver immediate geographic visibility. Marketing managers get instant access to country performance breakdowns, regional ROAS comparisons, and budget efficiency analysis without building complex reports. When stakeholders ask “How are our European markets performing?“, you have visual answers ready in seconds.
Data set templates provide analytical freedom. Advanced marketers can get analysis-ready Facebook Ads geographic data in minutes. These data sets can be loaded into their preferred BI tools to build sophisticated analysis workflows that match their exact requirements.
AI integration changes everything. Instead of spending hours analyzing which countries deserve more budget, you can ask AI to do this. Just integrate your Facebook Ads data flows with AI tools for conversational Facebook Ads analytics. As a result, you can simply ask: “Show me underperforming regions consuming high spend” and receive specific recommendations with supporting data in moments.
The real power emerges when these approaches work together. Daily dashboard monitoring identifies trends, data set analysis provides deep insights, and AI conversations reveal optimization opportunities that would take hours to discover manually.
This combination enables smarter budget allocation decisions that drive measurable improvements in campaign performance across all markets.