With Facebook Ads, you can potentially reach over 2 billion individuals and give your service a huge boost. Many businesses are already crushing it with Facebook Ads and its targeting options that allow them to reach their target audience effectively.
However, you’re not the only advertiser on the platform, so the competition can be quite fierce. In view of this, it’s crucial to know which campaigns are working and which ones are not. The only way to get this knowledge is through analysis. In this tutorial, we will take a deep dive into the concept of Facebook Ads analytics. You’ll learn how to track the performance of your ads and analyze Facebook Ads data to make informed decisions about your advertising strategy.
What is Facebook Ad analytics?
Facebook Ads analytics is a suite of tools and approaches to help businesses track the performance of their Facebook Ads campaigns. The main idea of analyzing Facebook ads data is to derive insights into the effectiveness of campaigns and identify areas for improvement.
In some guides, Facebook ads analytics is mistakenly referred to as a tool. Facebook indeed offers a set of tools to create and manage ad campaigns and track their performance. All these tools are gathered into a one-stop shop called Meta Ads Manager (formerly Facebook Ads Manager). The concept of Facebook ads analysis is much broader since it can include multiple tools or even services to perform an in-depth analysis of campaign results.
At the same time, you can opt for a custom Facebook Ads analytics solution implemented in the form of an interactive report or dashboard. We’ll show an example of it below.
How to analyze Facebook Ads – native vs. custom approach
Primarily, your Facebook ads analytics can be done either in-house using the built-in Meta tools or outside of the Facebook Ads platform.
The first way is pretty convenient since you already have a set of tools for analytics out of the box. You will find these tools if you click the burger menu button (All tools) and scroll down to the Analyze and report section.
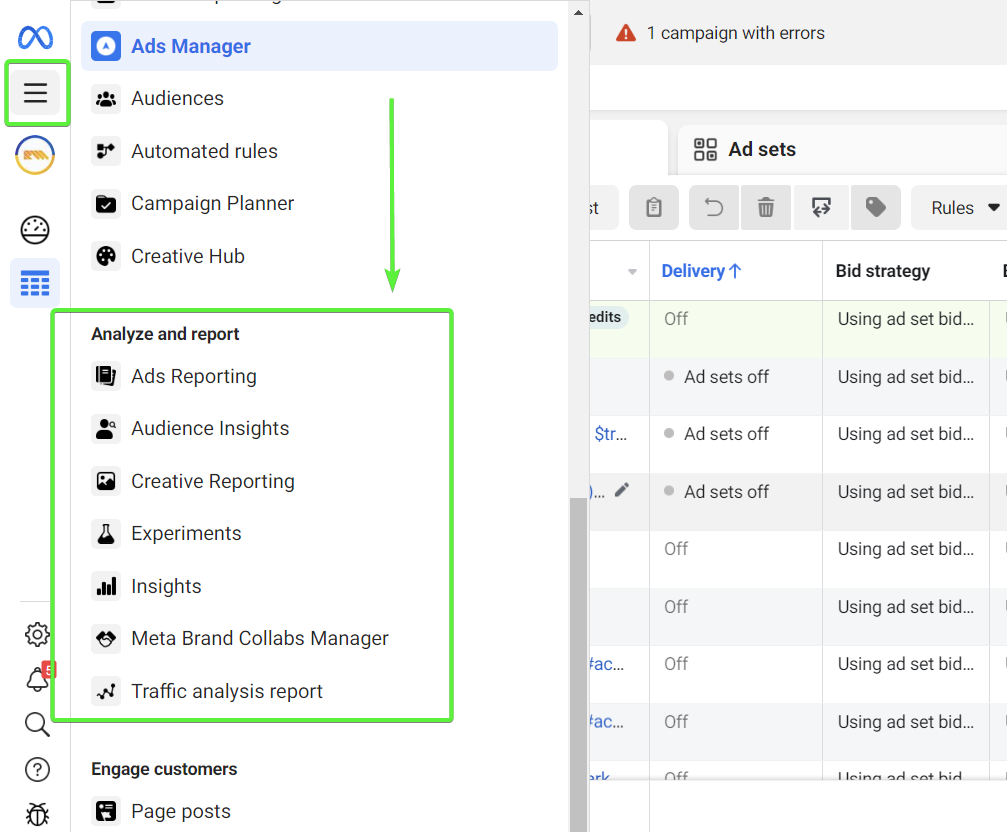
From this list of tools, you need Ads Reporting. Other options such as Audience Insights or Creative Reporting, show analytics relating to your Facebook Page, not ads.
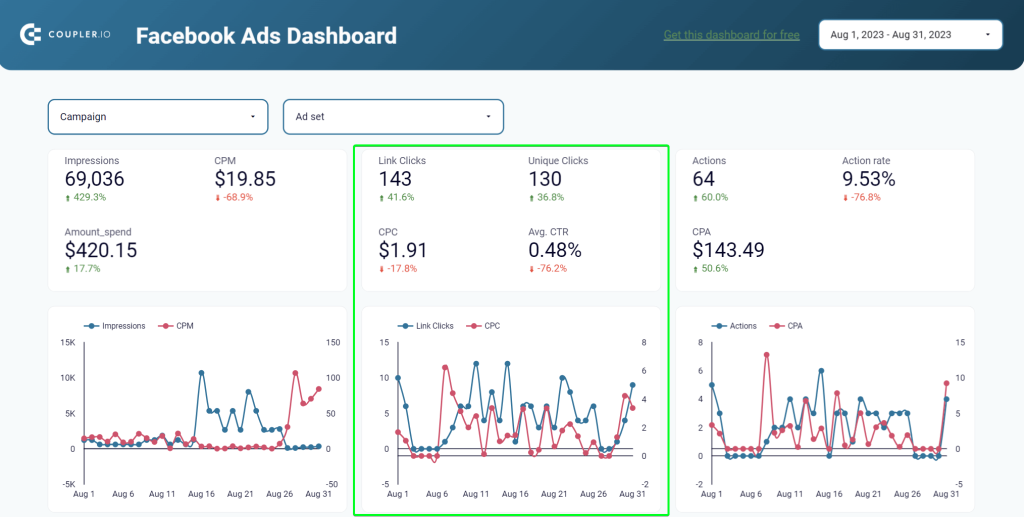
Ads Reporting is a part of the Meta Ads Manager tool where you create and run ads. Here is what it may look like:
This is the primary tool you can use to analyze the performance of your ads on Facebook. It is designed to create ad performance reports from scratch or with the help of templates, such as Overall performance or Engagement reports. We won’t dedicate much of your attention to this tool here since we already have a dedicated blog post about Facebook Ads Reporting.
What are the limitations of native tools for Facebook Ads analysis?
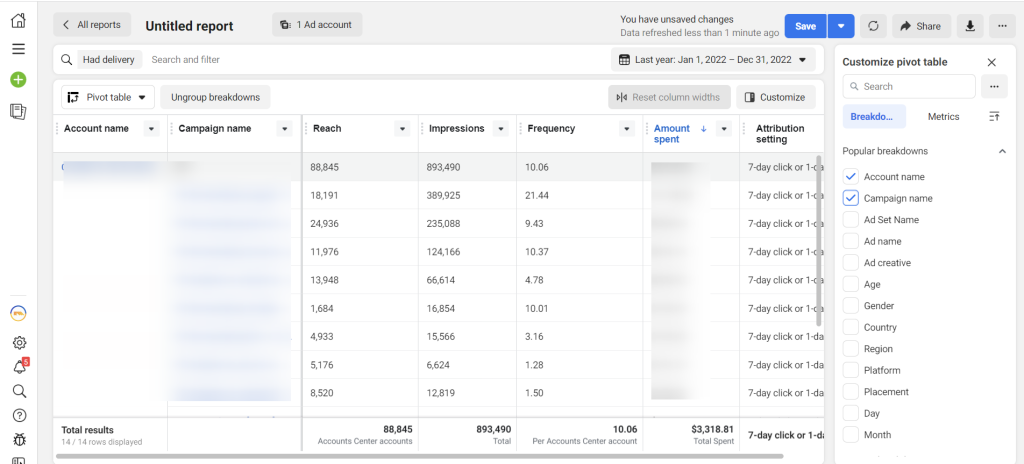
Facebook…Meta Ads Reporting tool provides you with all the key metrics and beyond them. You can also add custom metrics if necessary.
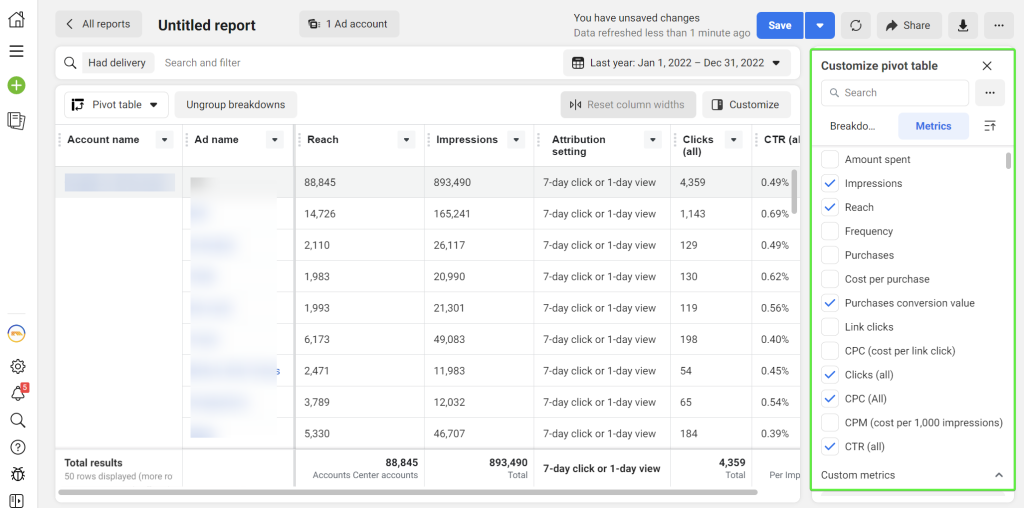
In addition to this, trend and bar chart visualizations are available for your Facebook ads analysis.
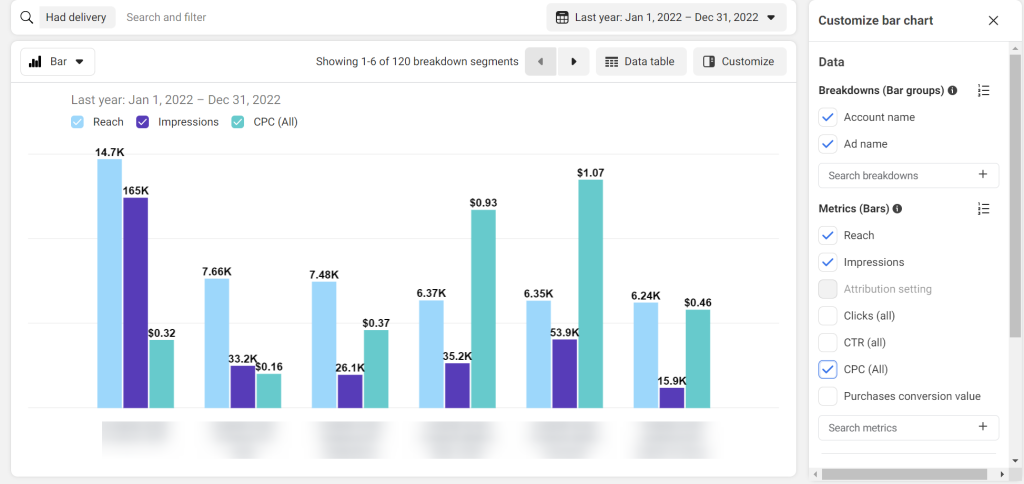
In view of this, Meta Ads Reporting seems to be a perfect solution for Facebook Ads analysis. And it really is for specific cases. However, you should be aware of the limitations which you’ll likely encounter, namely:
- No support for multiple accounts. You won’t be able to operate analytics for multiple Facebook Ads accounts by simply selecting them.
- Primitive sorting and filtering. You can only sort your data from A to Z or vice versa.
- Data visualization is limited to three options: pivot table, trend, or bar charts.
- Limited data comparison. You can’t compare data from groups of campaigns. Also comparing data between different time periods can be challenging since the data can be affected by changes in the ad algorithm or the platform itself.
- Time lag. The more ads you add to your report, the longer it takes to update it. Data in the reports can also sometimes be delayed by a few hours or even a day, which can be a limitation for real-time analysis.
- Your analytics is limited to one platform, Facebook Ads. To manage ads analytics for different platforms, you’ll need to search for a third-party solution.
Meta Ads Reporting is a good option for analyzing Facebook ads data and gaining valuable insights into it. However, the limitations associated with this built-in tool force marketers and PPC experts to search for more efficient analytical solutions. This is why they tend to run their analytics outside of Facebook Ads using custom Looker Studio Facebook Ads templates or other BI dashboards.
Dashboard templates for smart custom Facebook Ads analytics
This is basically the second way you can choose for Facebook Ads analytics. It involves using one or several third-party tools depending on your purpose. For example, such solutions as AdEspresso or Agorapulse are designed to enable you to quickly view the most important analytics of your Facebook ads. But their functionality is limited and you’ll often want to go beyond what these tools offer.
A more sophisticated and hence efficient approach is to have an interactive PPC dashboard where you can observe all your key metrics in one place. Here are a few examples of such analytics dashboards for Facebook Ads performance designed by Coupler.io.
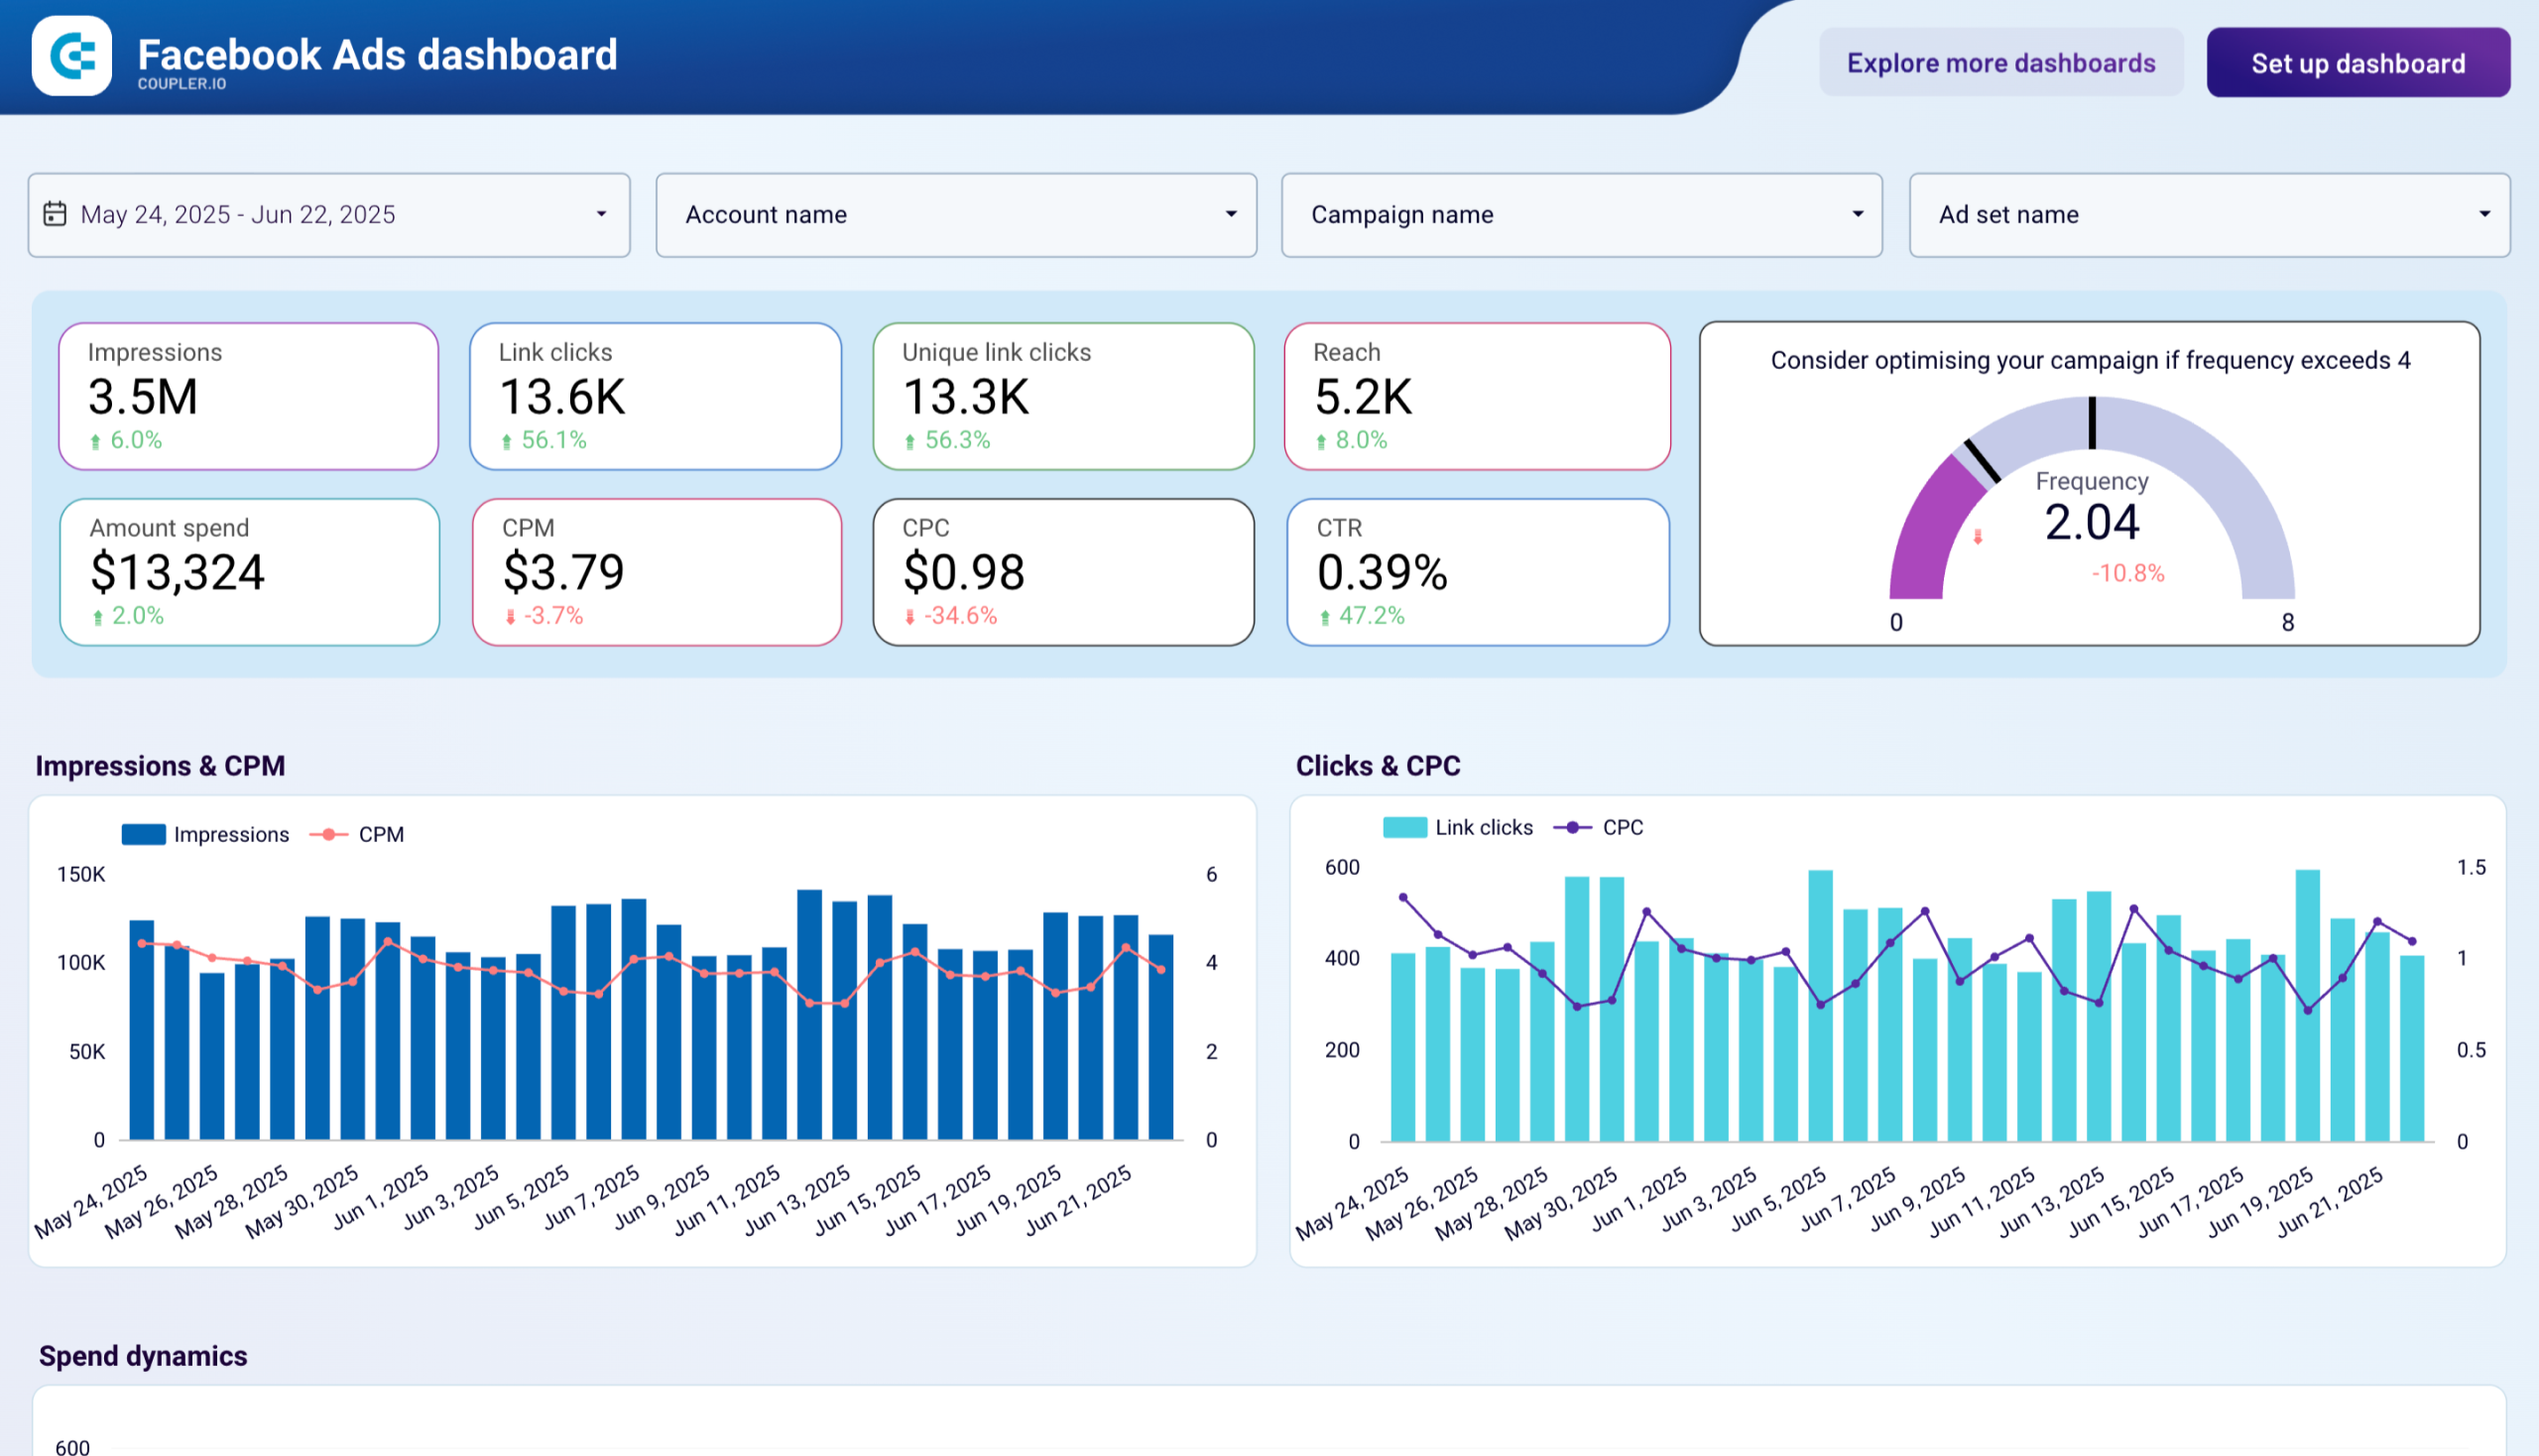
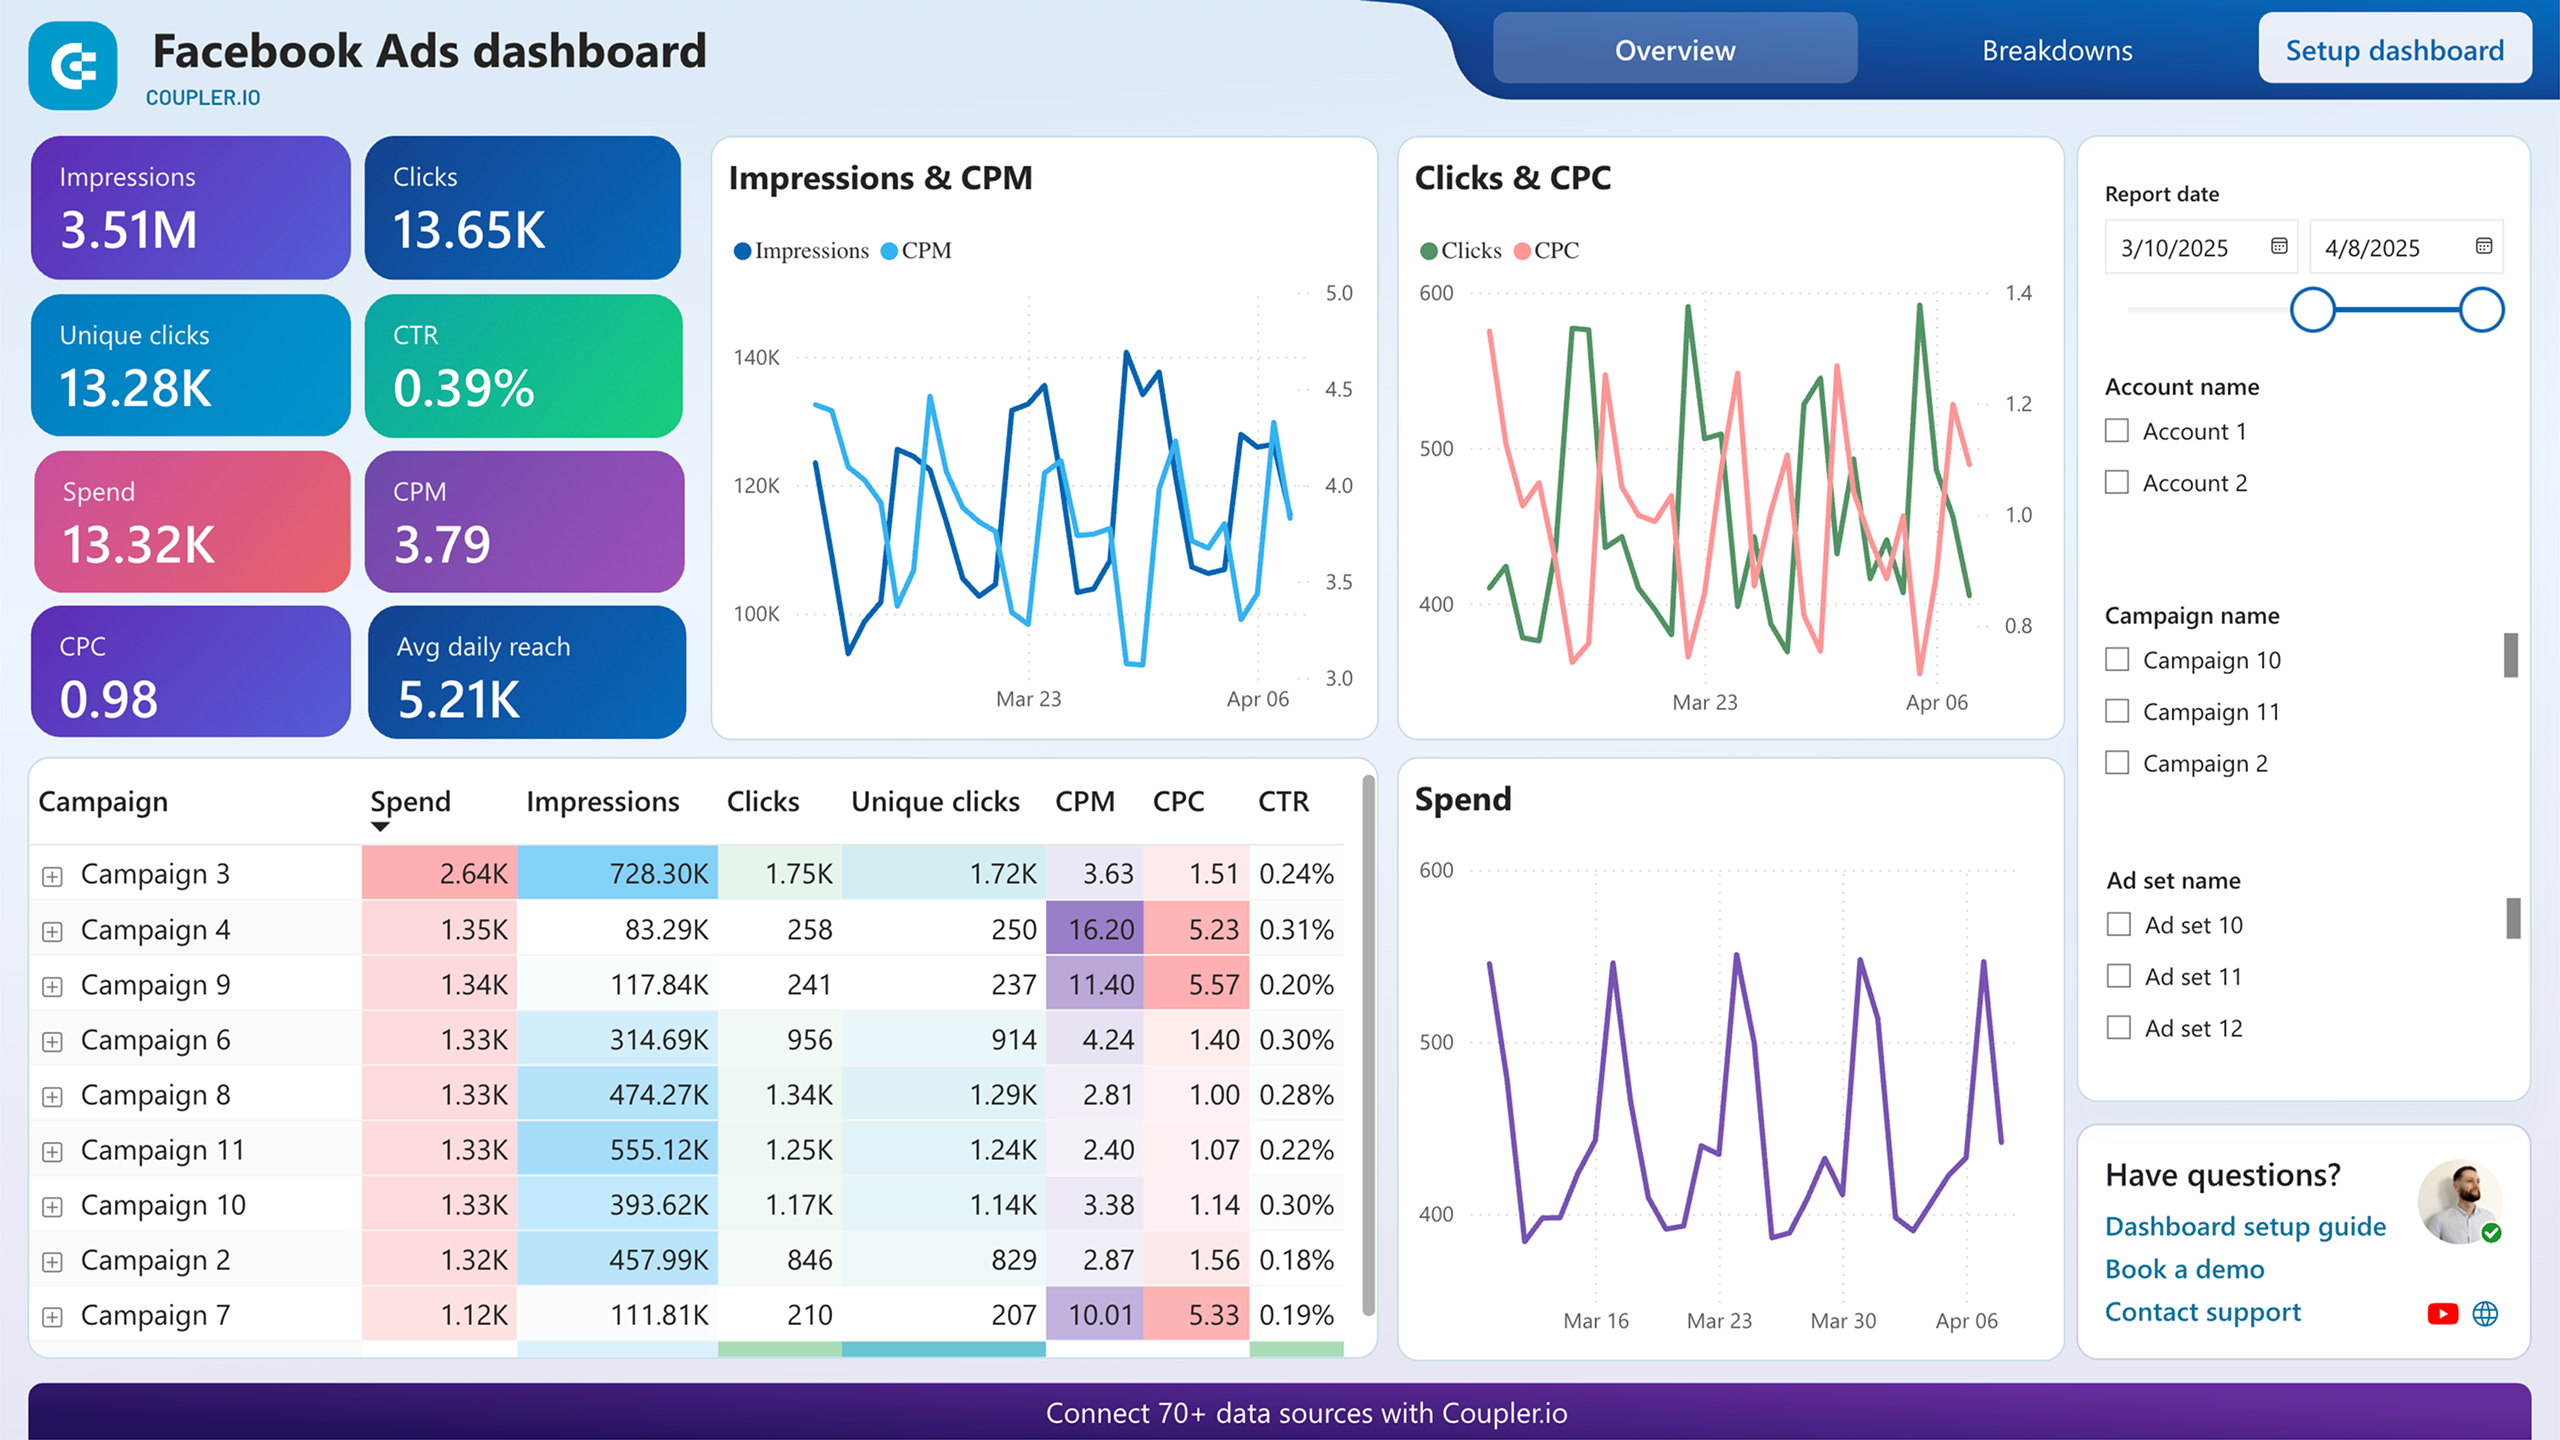
#1. Facebook Ads dashboard template
This is a dedicated dashboard for Facebook Ads that gives you a full view of your ad campaign performance, from clicks to costs. It’s not just a dashboard but a template that you can start using right away by connecting your Facebook Ads account.
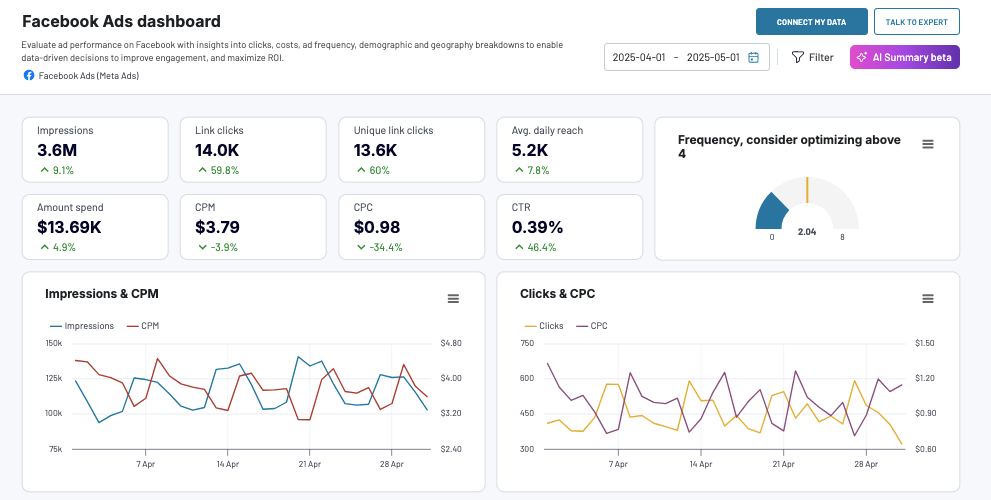
What insights you can derive:
- Frequency meter: Monitor how often users see your ads to optimize engagement levels.
- Clicks by demographics: Easily visualize which audience segments engage most using a bar chart.
- Monthly dynamics: See monthly trends for metrics like impressions and clicks to track long-term progress.
- Country breakdown: Discover which countries drive the most traffic and refine your targeting strategy accordingly.
With just a few clicks, you can connect your Facebook Ads data to this dashboard, automating data refreshes via Coupler.io. I also mentioned that you can use it as a template. Indeed, the Facebook Ads dashboard is available in Looker Studio, Power BI, and Google Sheets. Feel free to choose the version that fits your reporting requirements.


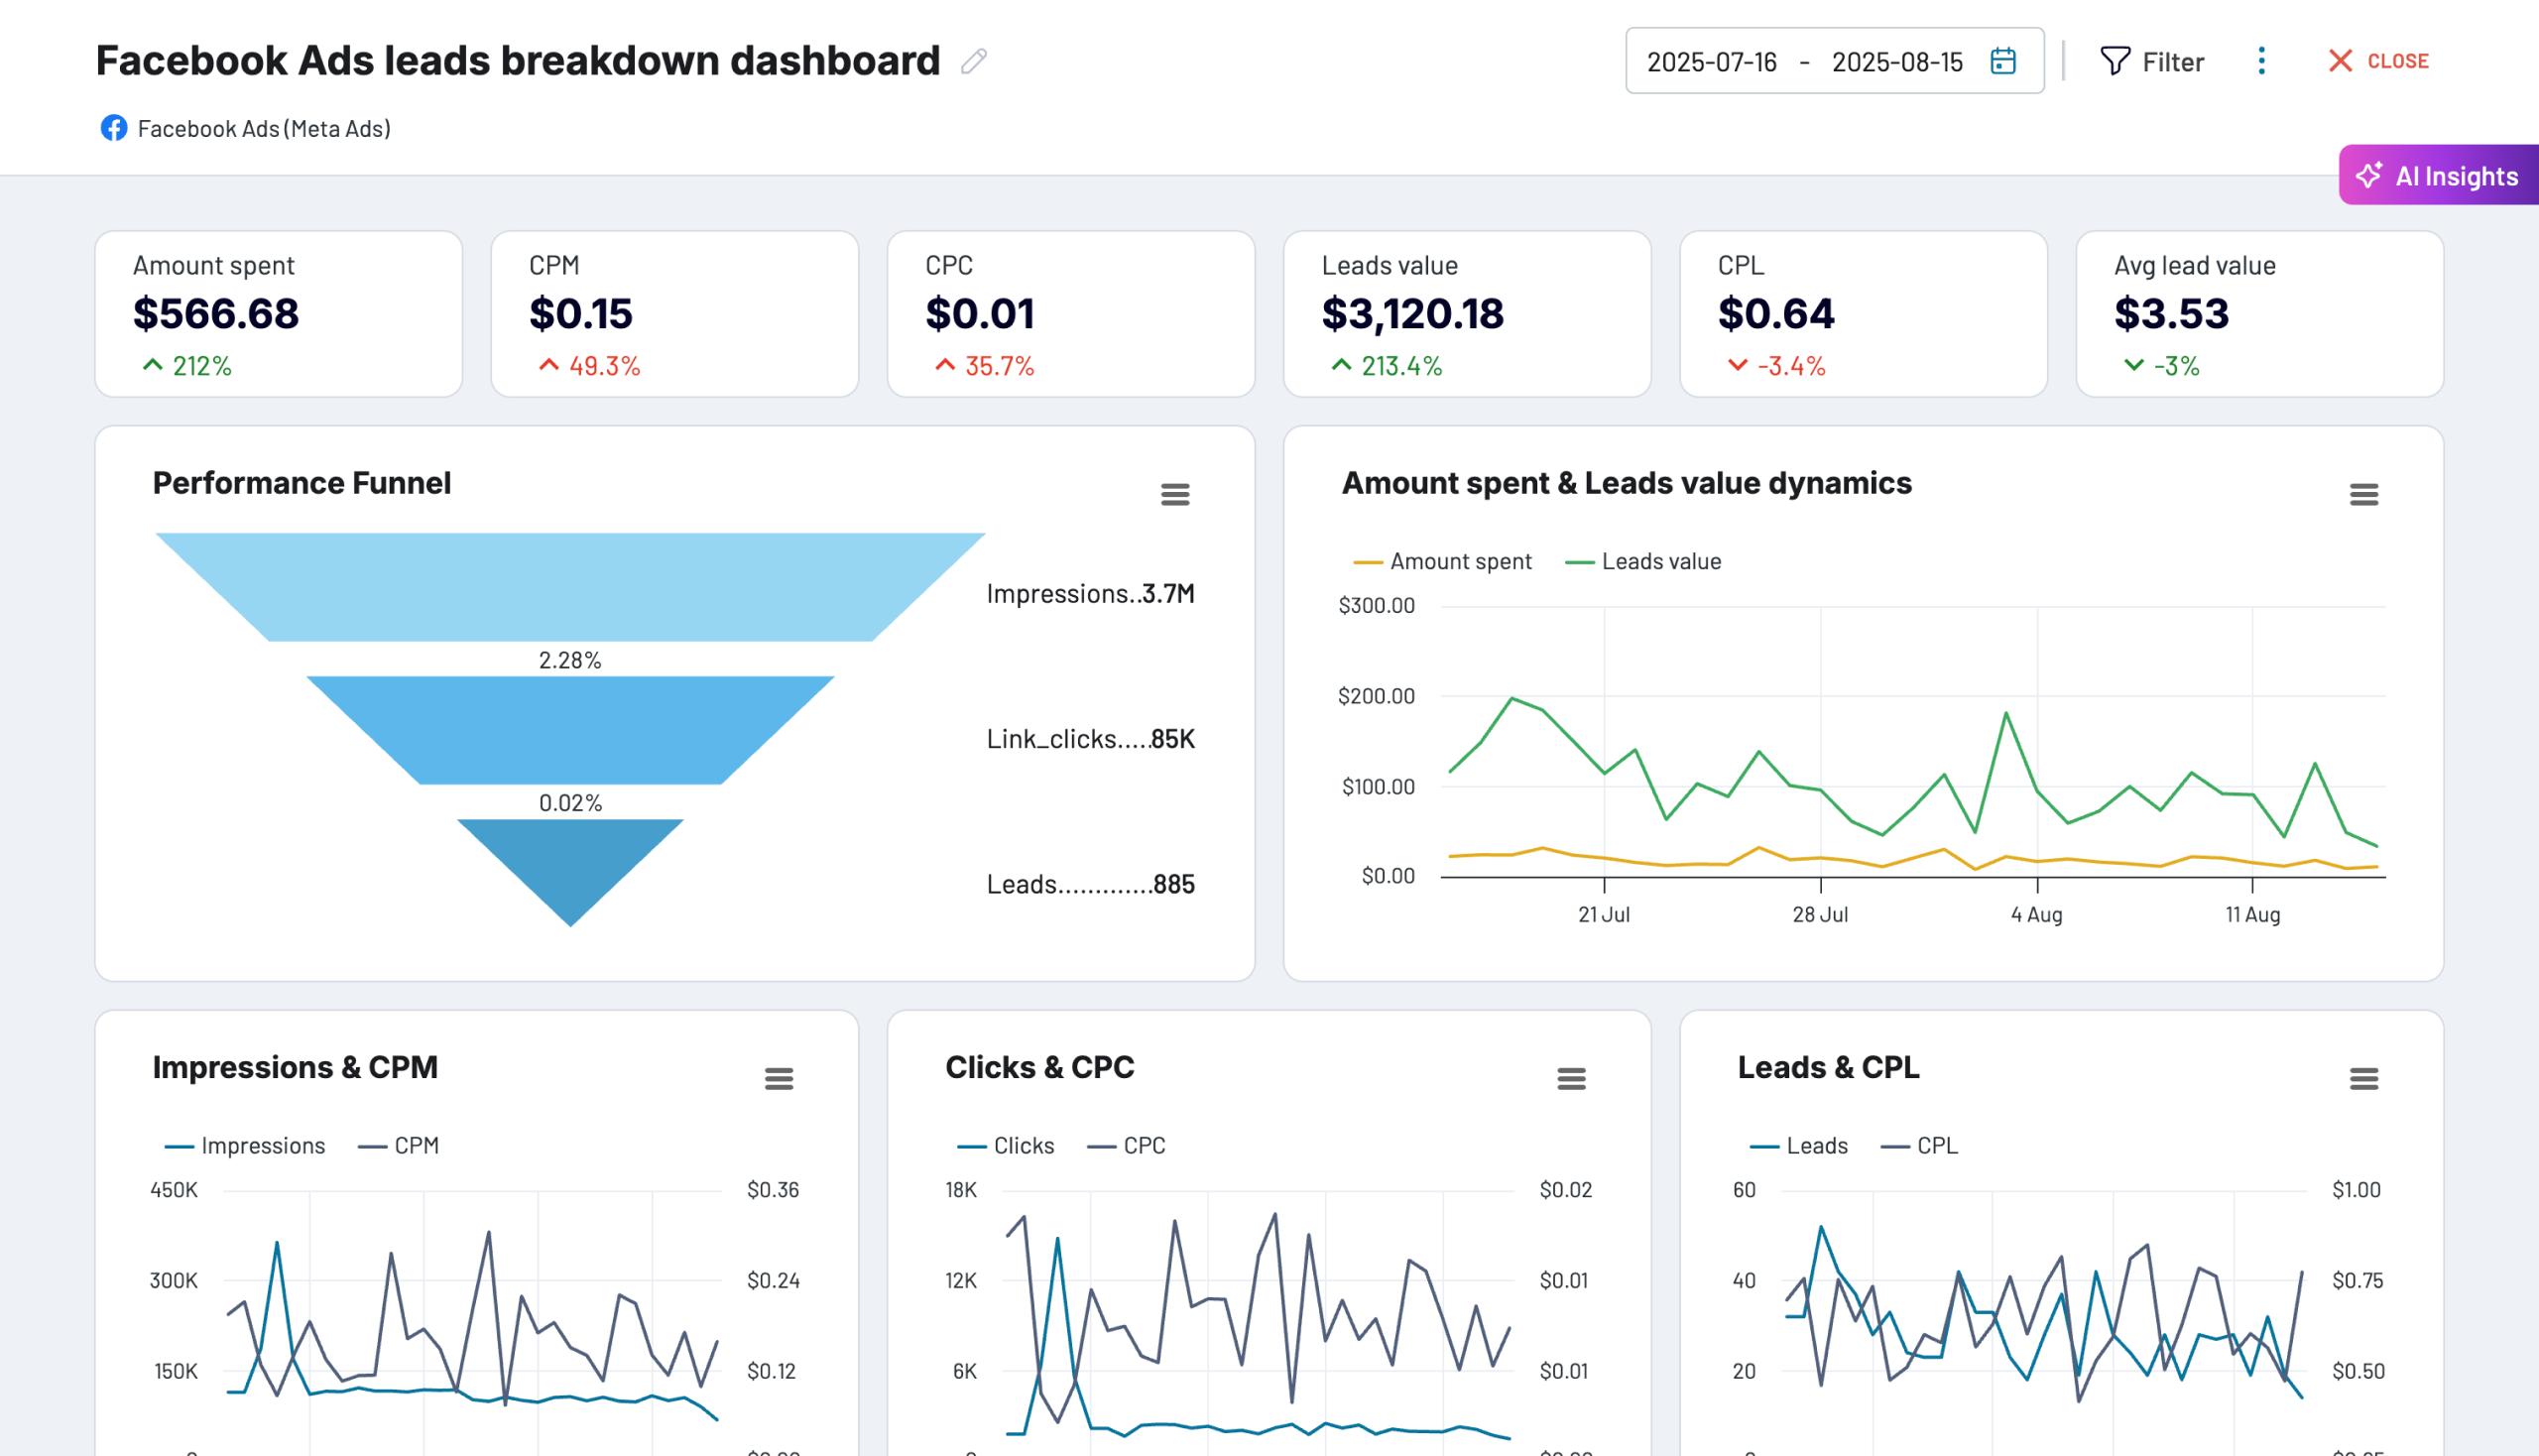
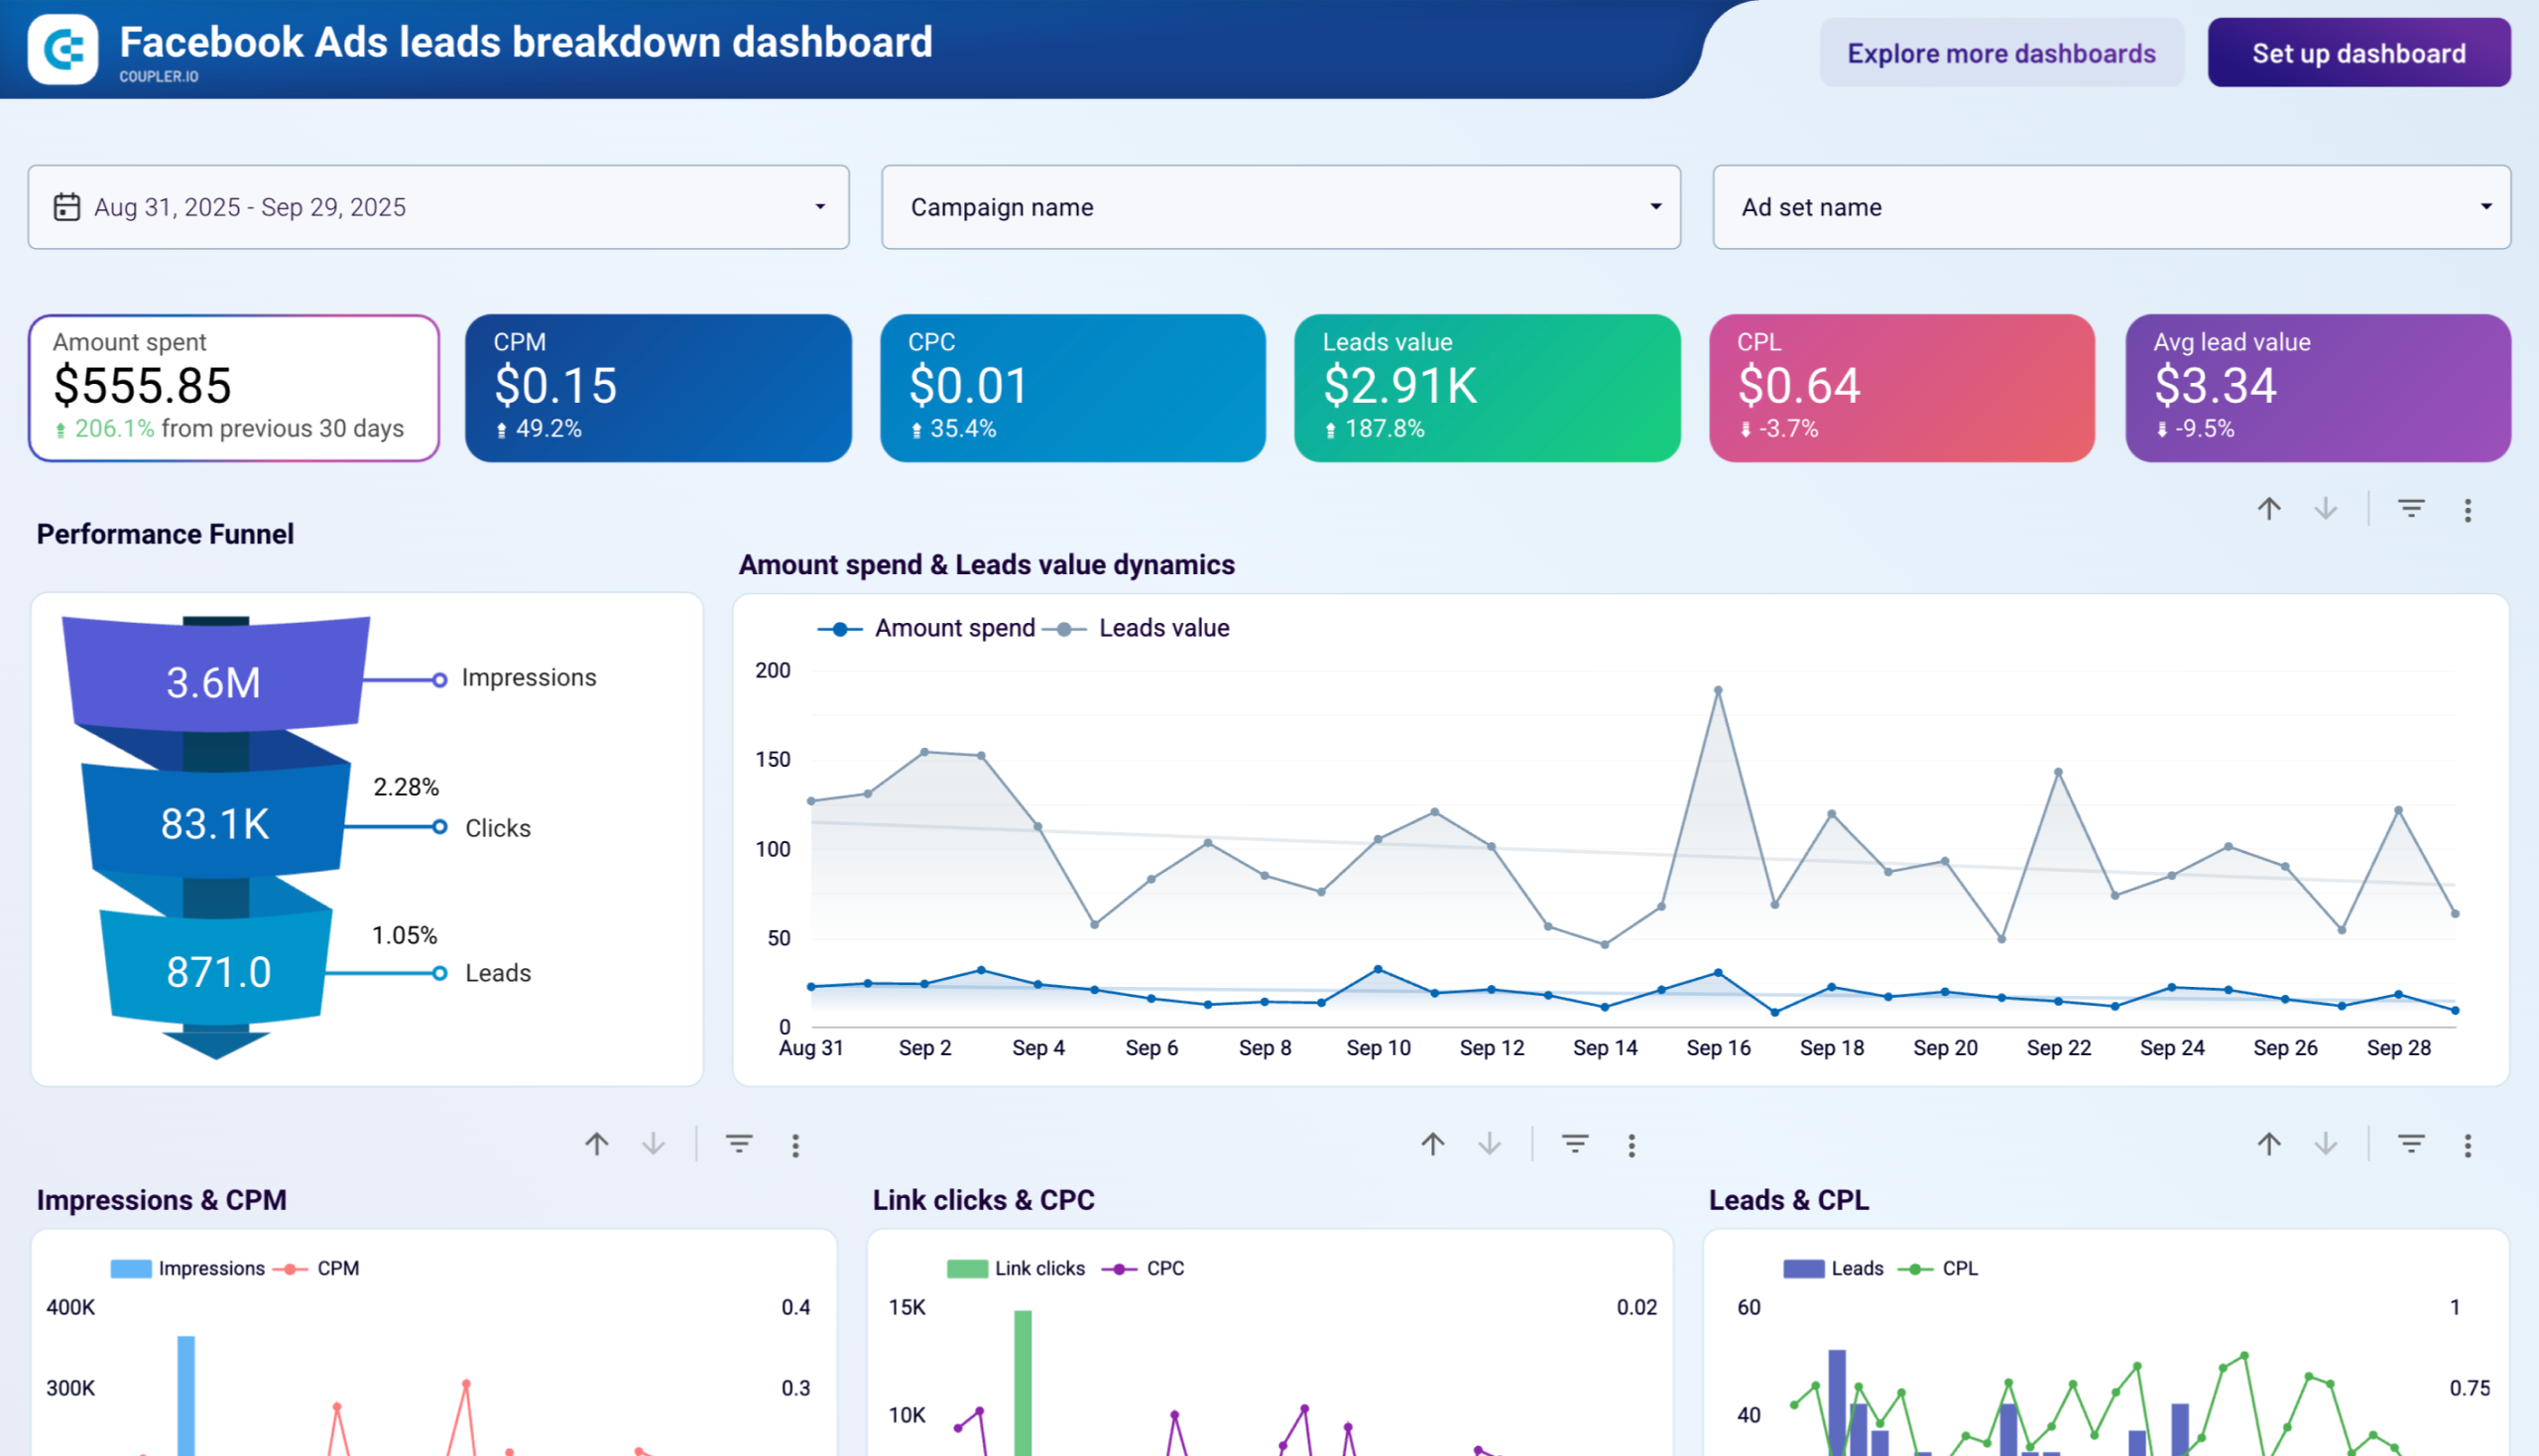
#2. Facebook Ads leads breakdown dashboard template
The Facebook Ads leads breakdown dashboard allows you to assess the effectiveness of your ad campaigns in generating leads. It is designed in Coupler.io and loads data from your Facebook Ads account automatically.
Facebook Ads leads breakdown dashboard
 Preview dashboard
Facebook Ads leads breakdown dashboard
Preview dashboardWhat insights you can derive:
- Performance funnel + leads value dynamics: Visualize the path from impressions to leads and monitor lead value trends over time.
- Campaign performance breakdown: Compare how different campaigns perform in terms of lead generation and value.
- Monthly dynamics: Review monthly changes in metrics like clicks, leads, and cost per lead.
- Leads by demographics: See which demographic segments contribute most to your leads.
- Country breakdown: Understand which countries generate the most leads and refine your targeting accordingly.
Explore useful tips on how to generate more leads with Facebook Ads.
This automated template is designed in Coupler.io and is also available as a Looker Studio template. To start using the dashboard, follow the instructions on the Readme tab to create a copy of the report and load data to it. Your Facebook Ads dashboard will automatically refresh every day but you can modify the schedule in the connector’s settings.

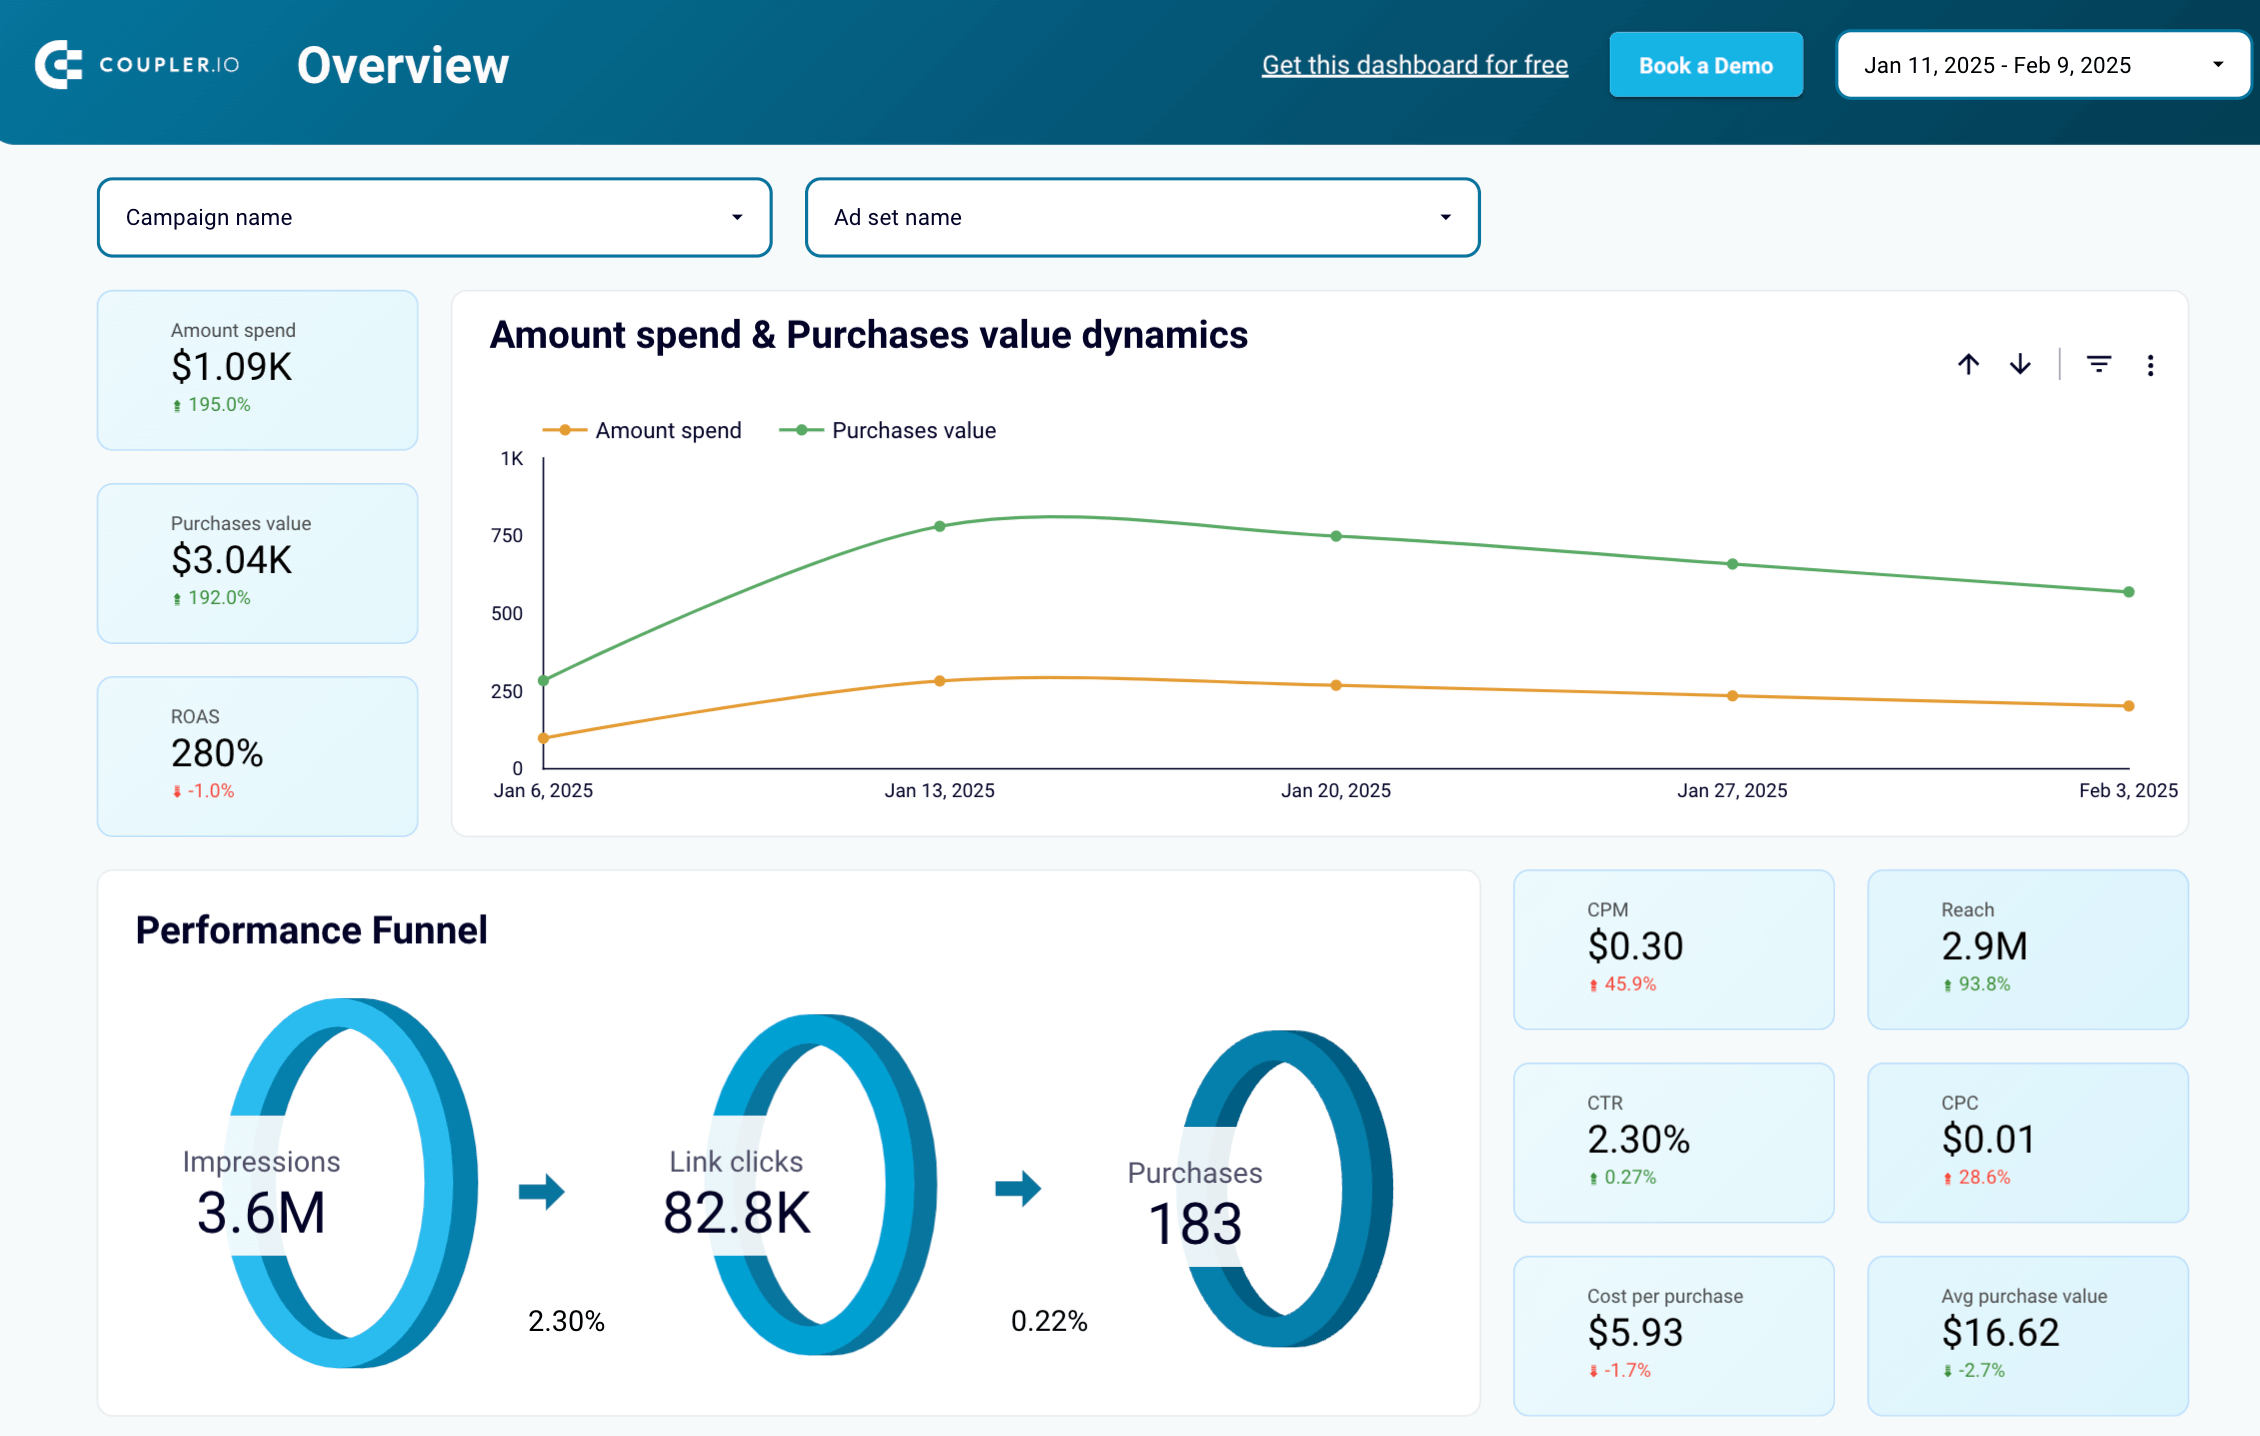
#3. Facebook Ads purchases breakdown dashboard template
This Facebook Ads dashboard provides a detailed breakdown of campaign performance in terms of driving purchases. The template is built in Looker Studio and powered by Coupler.io.
Facebook Ads purchase breakdown dashboard
 Preview dashboard
Facebook Ads purchase breakdown dashboard
Preview dashboardWhat insights you can derive:
- Purchase value dynamics: Track purchase value over time and compare it with ad spend to calculate ROAS.
- Performance funnel: Understand how impressions convert into purchases via a visual funnel.
- Campaign performance breakdown: Analyze purchase count and value across campaigns for optimization.
- Monthly dynamics: Track key metrics like purchases and spend month-to-month.
- Purchases by demographics: Discover which demographic groups drive the most revenue.
- Country breakdown: Identify the top-performing regions for purchases and adjust your targeting.
Follow the instructions to connect your Facebook Ads account and load data to your dashboard copy in Looker Studio. After that, you can start tracking purchase-driven performance with ease.
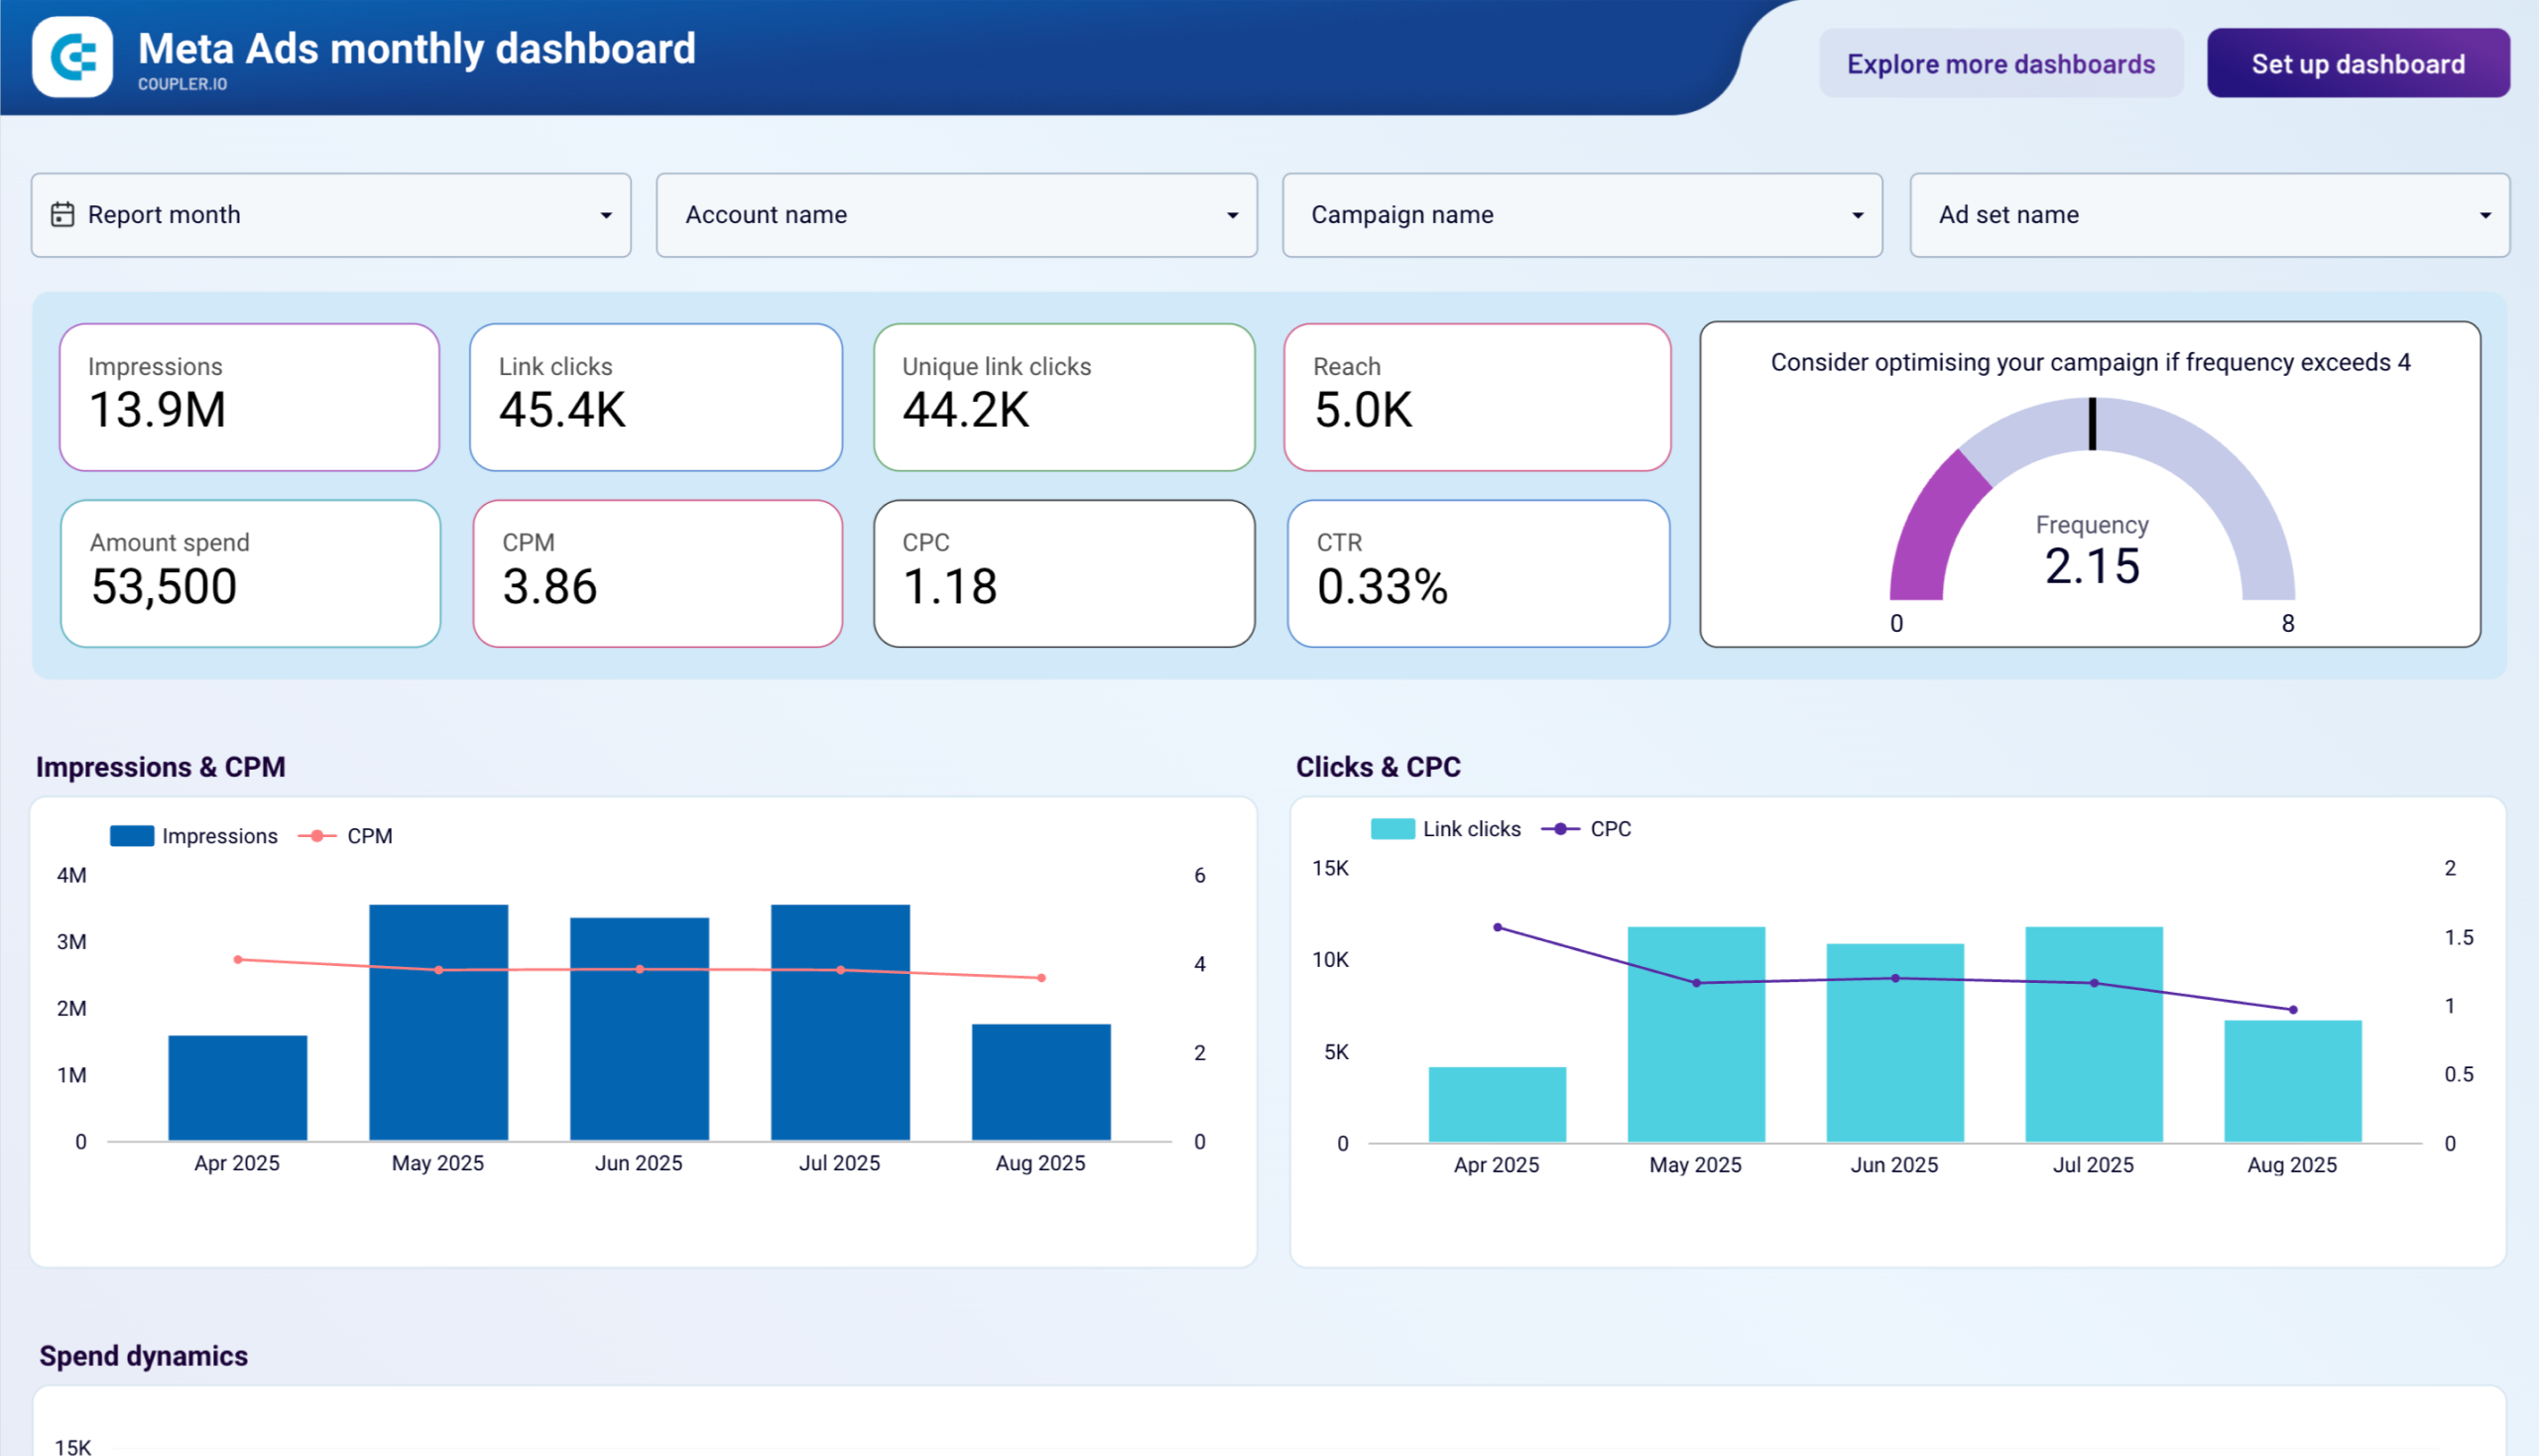
#4. Meta Ads monthly performance dashboard template
While the previous dashboards focus on specific conversion events, this Meta Ads monthly performance dashboard provides strategic monthly insights for executive reporting and quarterly planning. It helps marketing teams track their Facebook and Instagram advertising performance with comprehensive demographic analysis and geographic market evaluation.
Meta Ads monthly performance dashboard
 Preview dashboard
Meta Ads monthly performance dashboard
Preview dashboardWhat insights you can derive:
- Monthly trend analysis: Track impressions, clicks, spend, and CTR with period-over-period comparisons to identify seasonal patterns and campaign effectiveness over time.
- Demographic engagement patterns: Analyze performance by age groups and gender to identify your highest-converting audience segments and optimize targeting strategies.
- Device performance optimization: Monitor performance across iPhone, Android, desktop, and tablet users to optimize creative formats and bidding strategies for different devices.
- Geographic market evaluation: Evaluate country-level engagement data for expansion planning and budget reallocation to high-performing international markets.
You can also use this and other Facebook Ads dashboards by Coupler.io for geographic performance analysis for Facebook Ads.
- Ad frequency management: Use visual frequency meters to maintain optimal exposure levels and prevent ad fatigue while maximizing campaign reach.
- Executive reporting: Generate monthly strategic reports with comprehensive metrics perfect for C-suite presentations and quarterly business reviews.
This Looker Studio template is powered by Coupler.io’s automated connector, ensuring your Facebook and Instagram advertising data updates monthly with strategic insights. Unlike daily operational dashboards, the monthly perspective makes it ideal for budget allocation decisions and long-term campaign strategy development. The template automatically organizes complex advertising data into strategic views perfect for executive stakeholders and quarterly planning sessions.
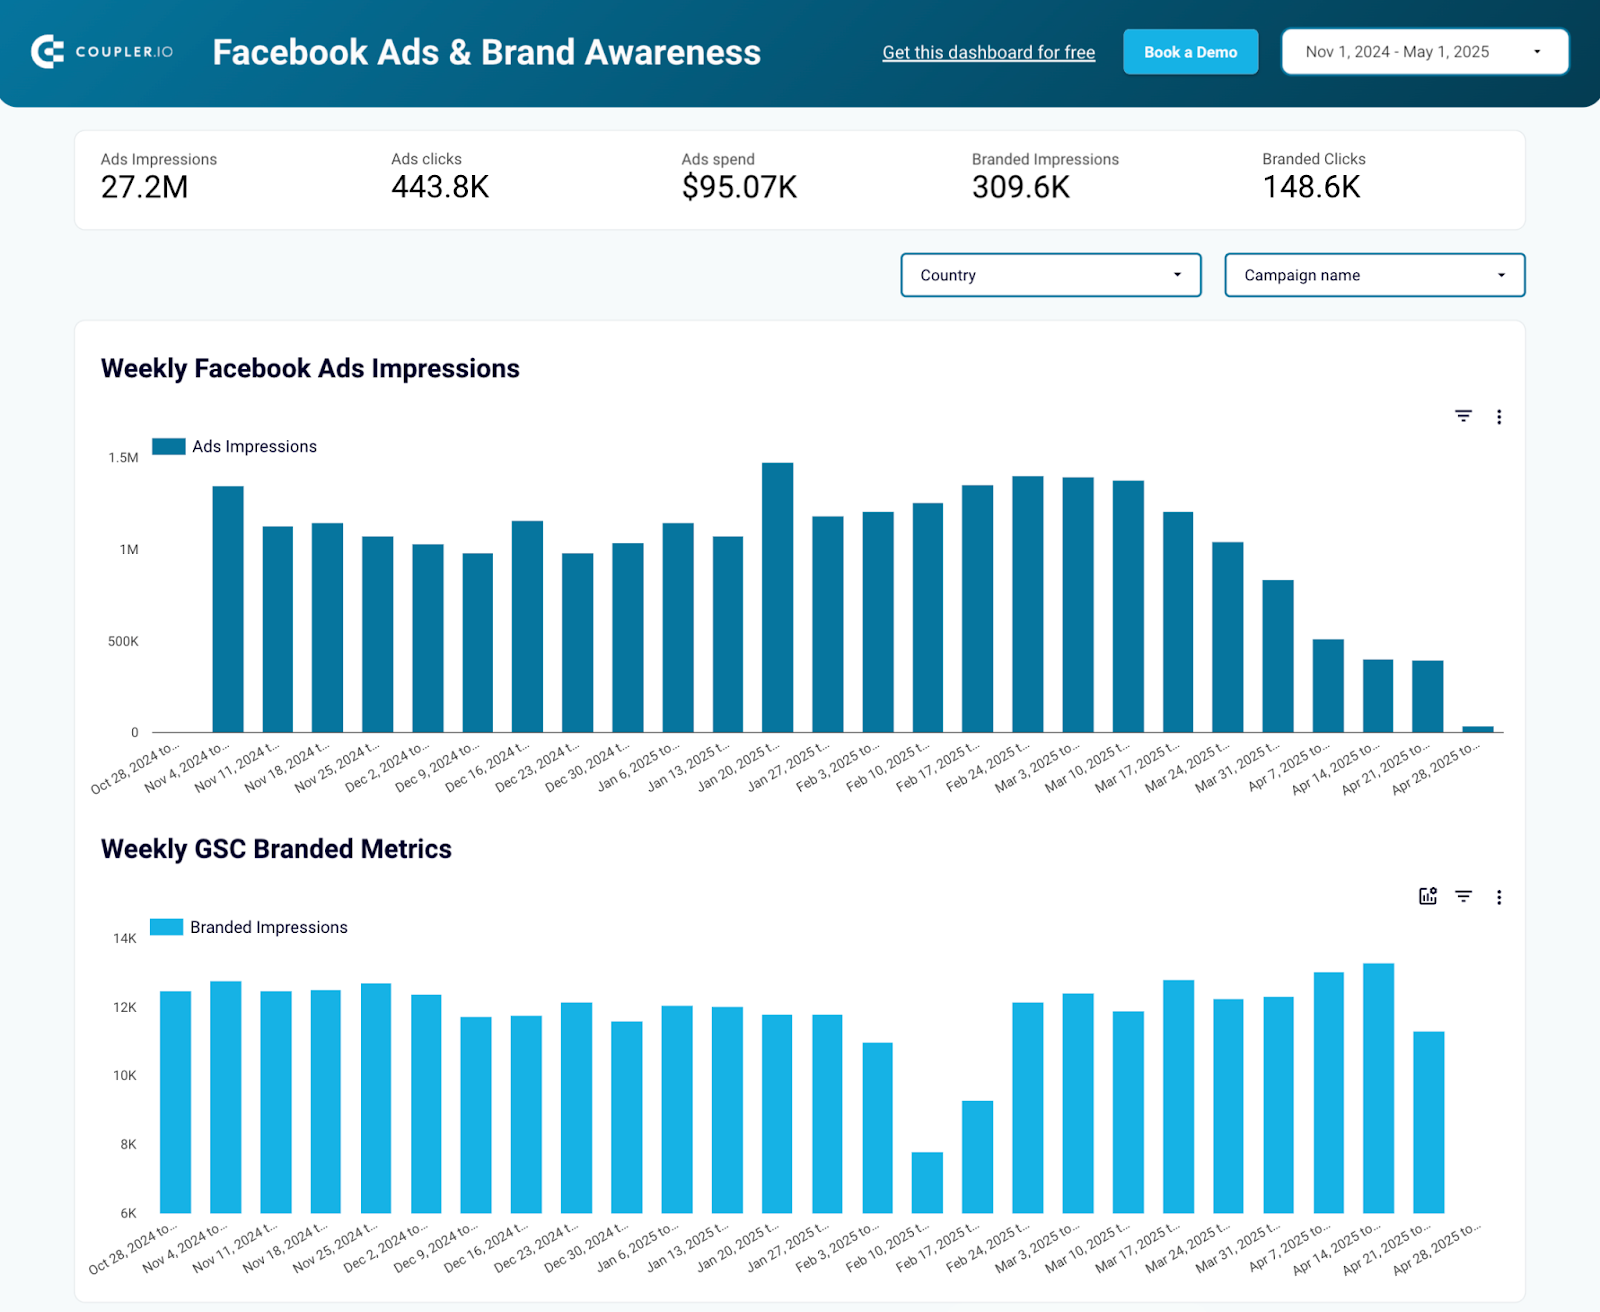
#5. Facebook Ads and brand awareness dashboard template
This dashboard combines Facebook Ads and Google Search Console (GSC) data to show the relationship between ad impressions and branded keyword searches. You can compare these key metrics side-by-side in extensive bar charts, get a quick summary of important KPIs, and identify possible correlations in minutes.
Facebook Ads & brand awareness dashboard
 Preview dashboard
Facebook Ads & brand awareness dashboard
Preview dashboardWhat insights you can derive:
- Global ad impact: If you run ads for global brands (e.g., Nike, Samsung), you can see the awareness impact of your ads at a glance. Compare the charts to identify weeks where Facebook campaigns fell short of your goal and take steps to optimize them.
- Dynamics by country: Filter the dashboard by country – for example, France – to uncover correlations in important regions. This can help you prioritize awareness campaigns for specific audiences.
- Campaigns driving brand awareness: Filter by campaign to find out which ad sets are the most/least effective at generating brand awareness for your business. Use this information to reallocate your budget to top-performing campaigns.
This template is available in Looker Studio with a free Coupler.io account. Connect your Facebook Ads data in a few clicks and enable automated data refreshes as frequently as every 15 minutes.
If you need guidance or you’re curious about customization options, read this article on how to build a brand awareness dashboard.
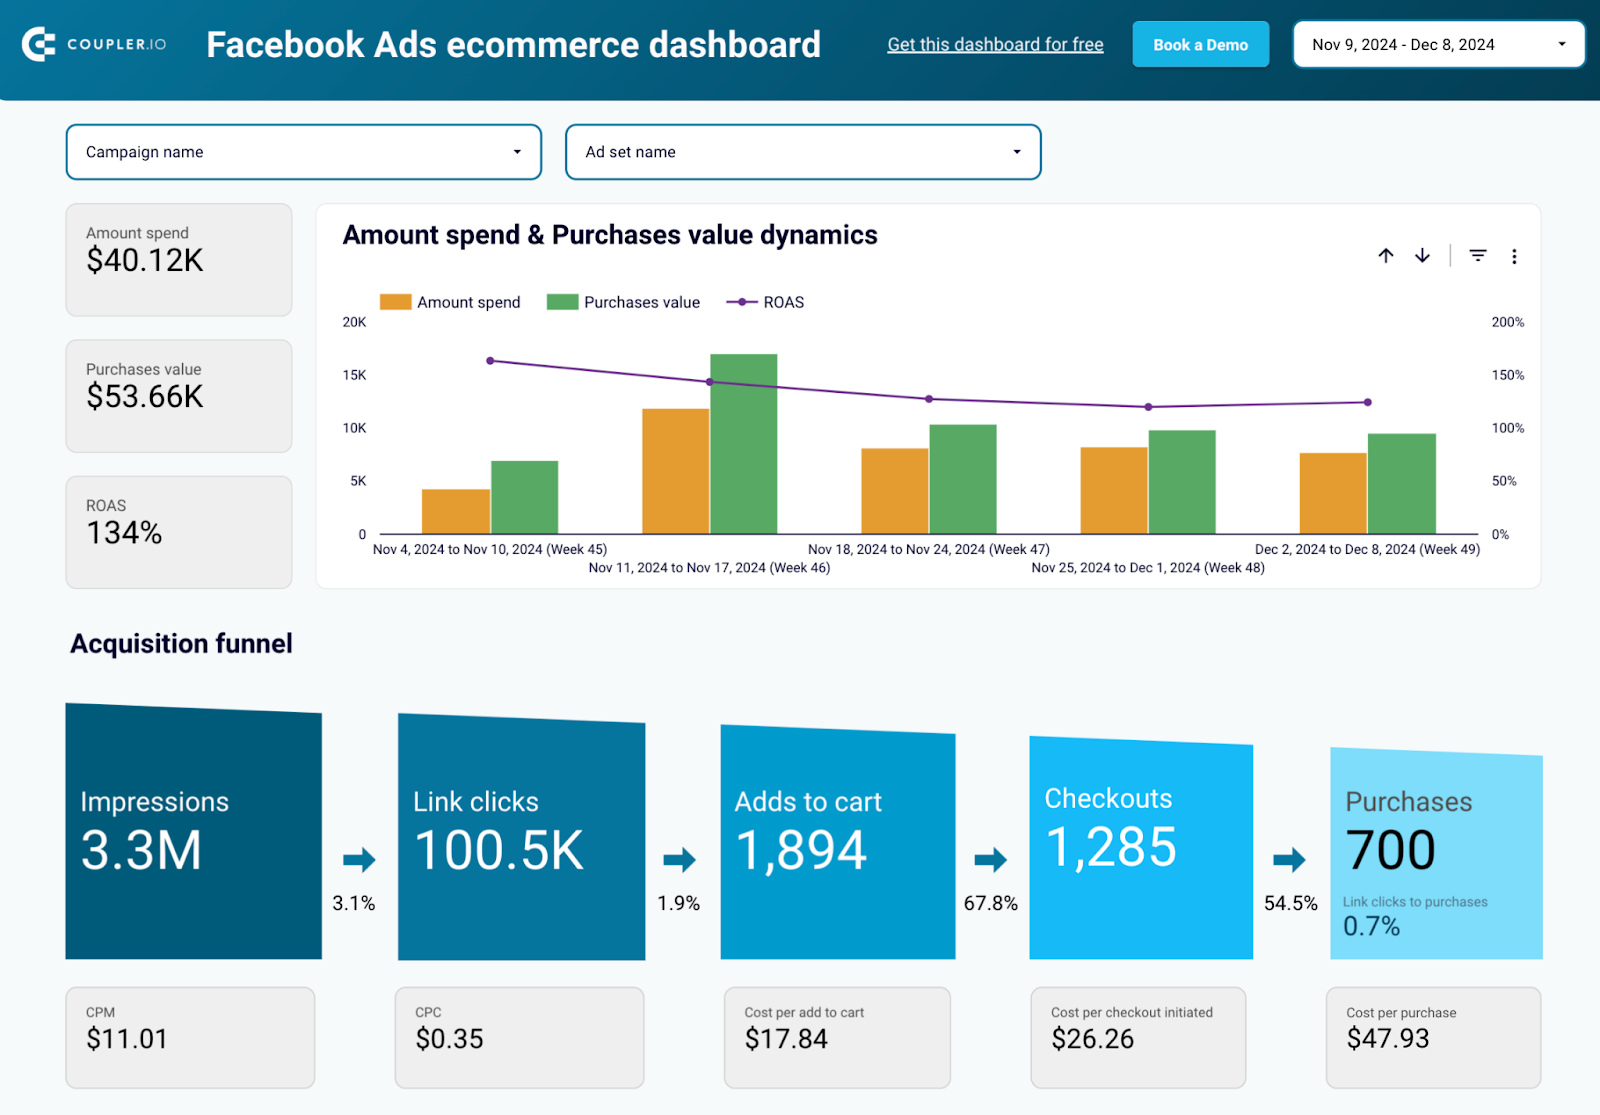
#6. Facebook Ads ecommerce performance dashboard template
This dashboard is perfect for ecommerce businesses running Facebook Ads. It provides detailed insights into your ad performance and conversion funnel. You can track the efficiency of your campaigns and optimize for a better return on ad spend (ROAS).
Facebook Ads ecommerce performance dashboard
 Preview dashboard
Facebook Ads ecommerce performance dashboard
Preview dashboardWhat insights you can derive:
- Spend vs. Purchase Value Dynamics: Compare your ad spend and purchase value over time to assess campaign profitability. Track ROAS trends to measure how effectively your budget generates revenue.
- Acquisition Funnel: Visualize the entire customer journey, from impressions to clicks, adds to cart, checkouts, and purchases. Identify drop-off points and optimize your funnel for higher conversions.
- Cost Metrics: Analyze key cost metrics like CPM, CPC, cost per add-to-cart, and cost per purchase to manage your budget efficiently.
- Campaign Performance: Get a granular view of how each campaign, ad set, or ad performs in terms of impressions, link clicks, purchases, and revenue.
- Revenue Insights: Track metrics like average purchase value, cost per purchase, and revenue per click to refine your targeting and bidding strategies.
With Coupler.io integration, you can connect your Facebook Ads account and automate data updates as frequently as every 15 minutes. This dashboard is compatible with Looker Studio, enabling you to monitor performance in real time and make data-driven decisions for your ecommerce campaigns.
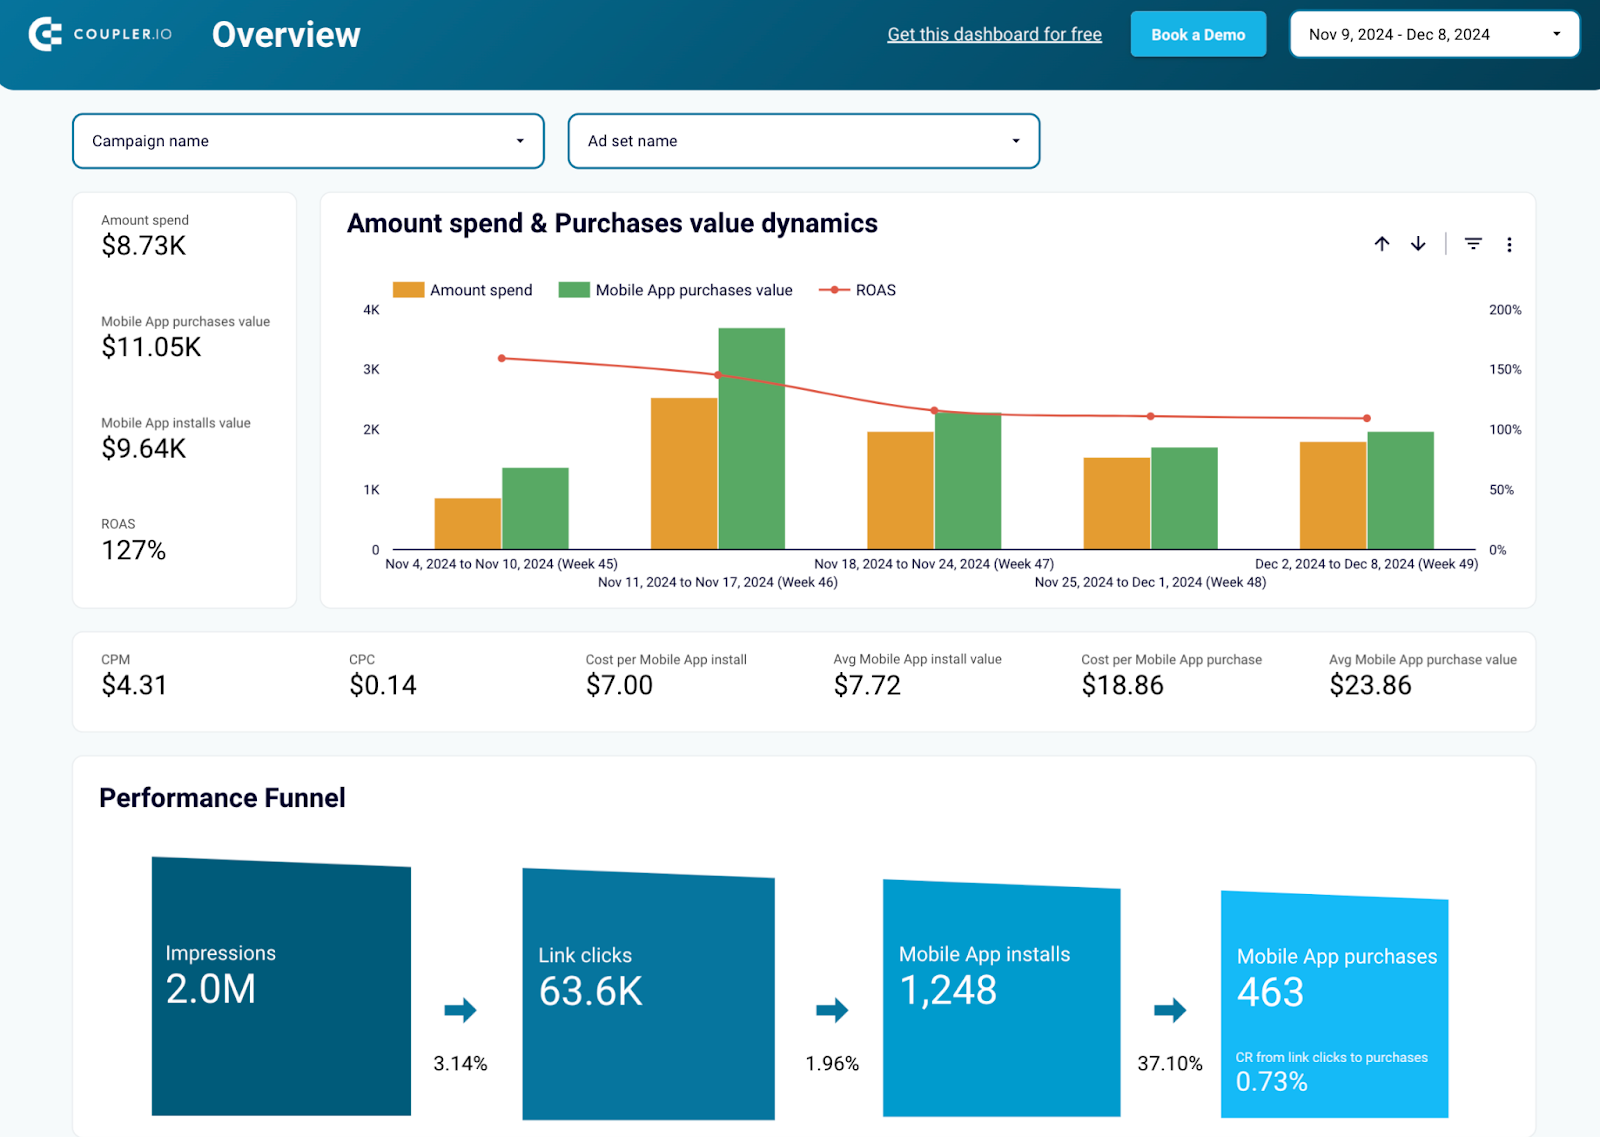
#7. Facebook Ads performance for mobile apps dashboard template
This dashboard is built to help mobile app marketers track the performance of their Facebook Ads campaigns. It provides a clear view of app install rates, in-app purchase value, and overall campaign efficiency. With the dashboard, you can optimize your strategies for better user acquisition and revenue growth.
Facebook Ads performance for mobile apps dashboard
 Preview dashboard
Facebook Ads performance for mobile apps dashboard
Preview dashboardWhat insights you can derive:
- Spend vs. Mobile App Value: To measure profitability over time, analyze your ad spend in comparison to mobile app purchase values and return on ad spend (ROAS).
- Performance Funnel: Track the entire user journey, from impressions and clicks to app installs and purchases, to identify bottlenecks in the acquisition funnel.
- Cost Efficiency Metrics: Evaluate cost per install, cost per purchase, and other key metrics to optimize budget allocation and increase ROI.
- Engagement Trends: Monitor impressions, clicks, and CPM trends to understand audience engagement and refine targeting strategies.
- Campaign Breakdown: Dive into individual campaign performance, assessing metrics like CTR, installs, purchases, and revenue for each ad set.
This Coupler.io template automatically pulls data from your Facebook Ads account and updates it on a schedule. It supports Looker Studio and enables easy reporting to scale your app’s success.
#8. Meta Ads creatives dashboard template
This template is designed to help you analyze and track performance of ad creatives across your Meta Ads campaigns. By combining metrics like impressions, clicks, CPC, and engagement rates, this dashboard ensures you have the insights you need to optimize your ad creatives and maximize ROI.
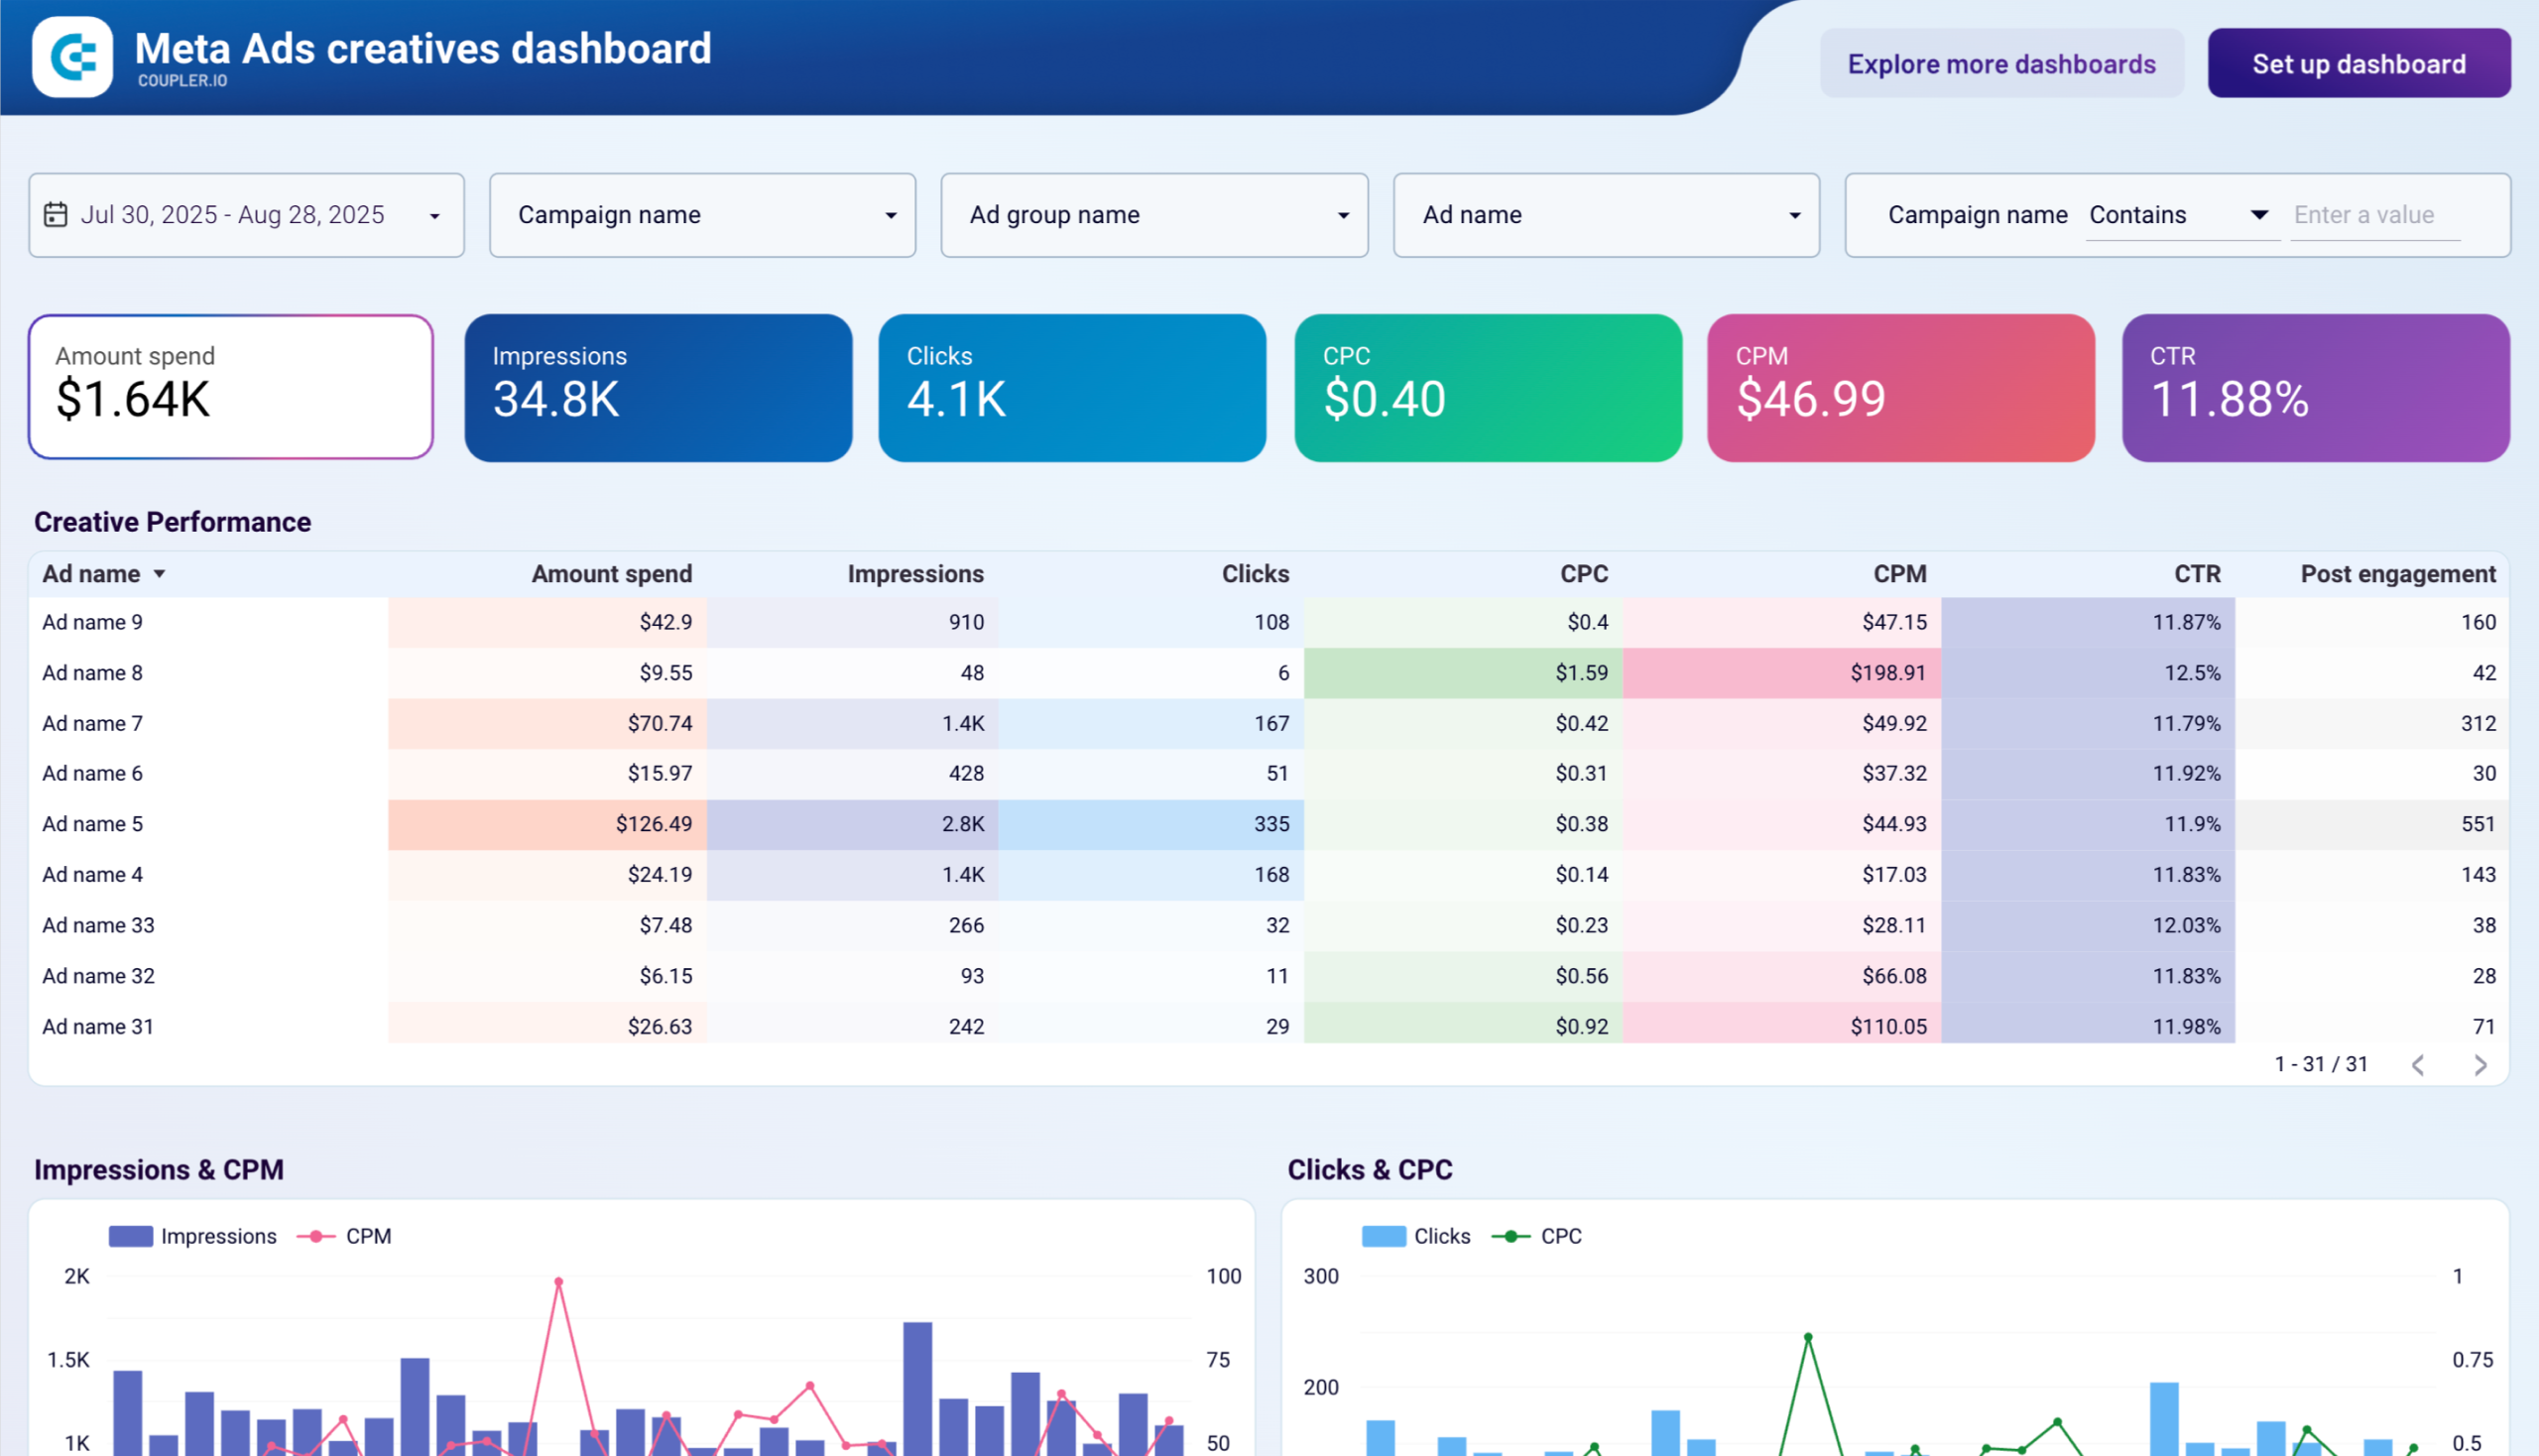
What insights you can derive:
- Creative performance comparison: Compare metrics like impressions, clicks, CPC, and engagement rates across all your ad creatives to identify top performers and areas for improvement.
- Impressions & CPM trends: Visualize how your ad impressions and CPM fluctuate over time to ensure your campaigns are cost-effective.
- Clicks & CPC dynamics: Track the relationship between the number of clicks and CPC to measure creative efficiency.
- Spend trends: Monitor daily spending patterns across your campaigns to manage budgets effectively and spot unusual spikes.
- CTR and post-engagement insights: Identify which ad creatives achieve the highest CTR and engagement to inform your future designs and messaging.
With Coupler.io, you can connect your Facebook Ads account and automate data refreshes as frequently as every 15 minutes. This dashboard is compatible with Looker Studio, giving you real-time insights to optimize your ad campaigns.
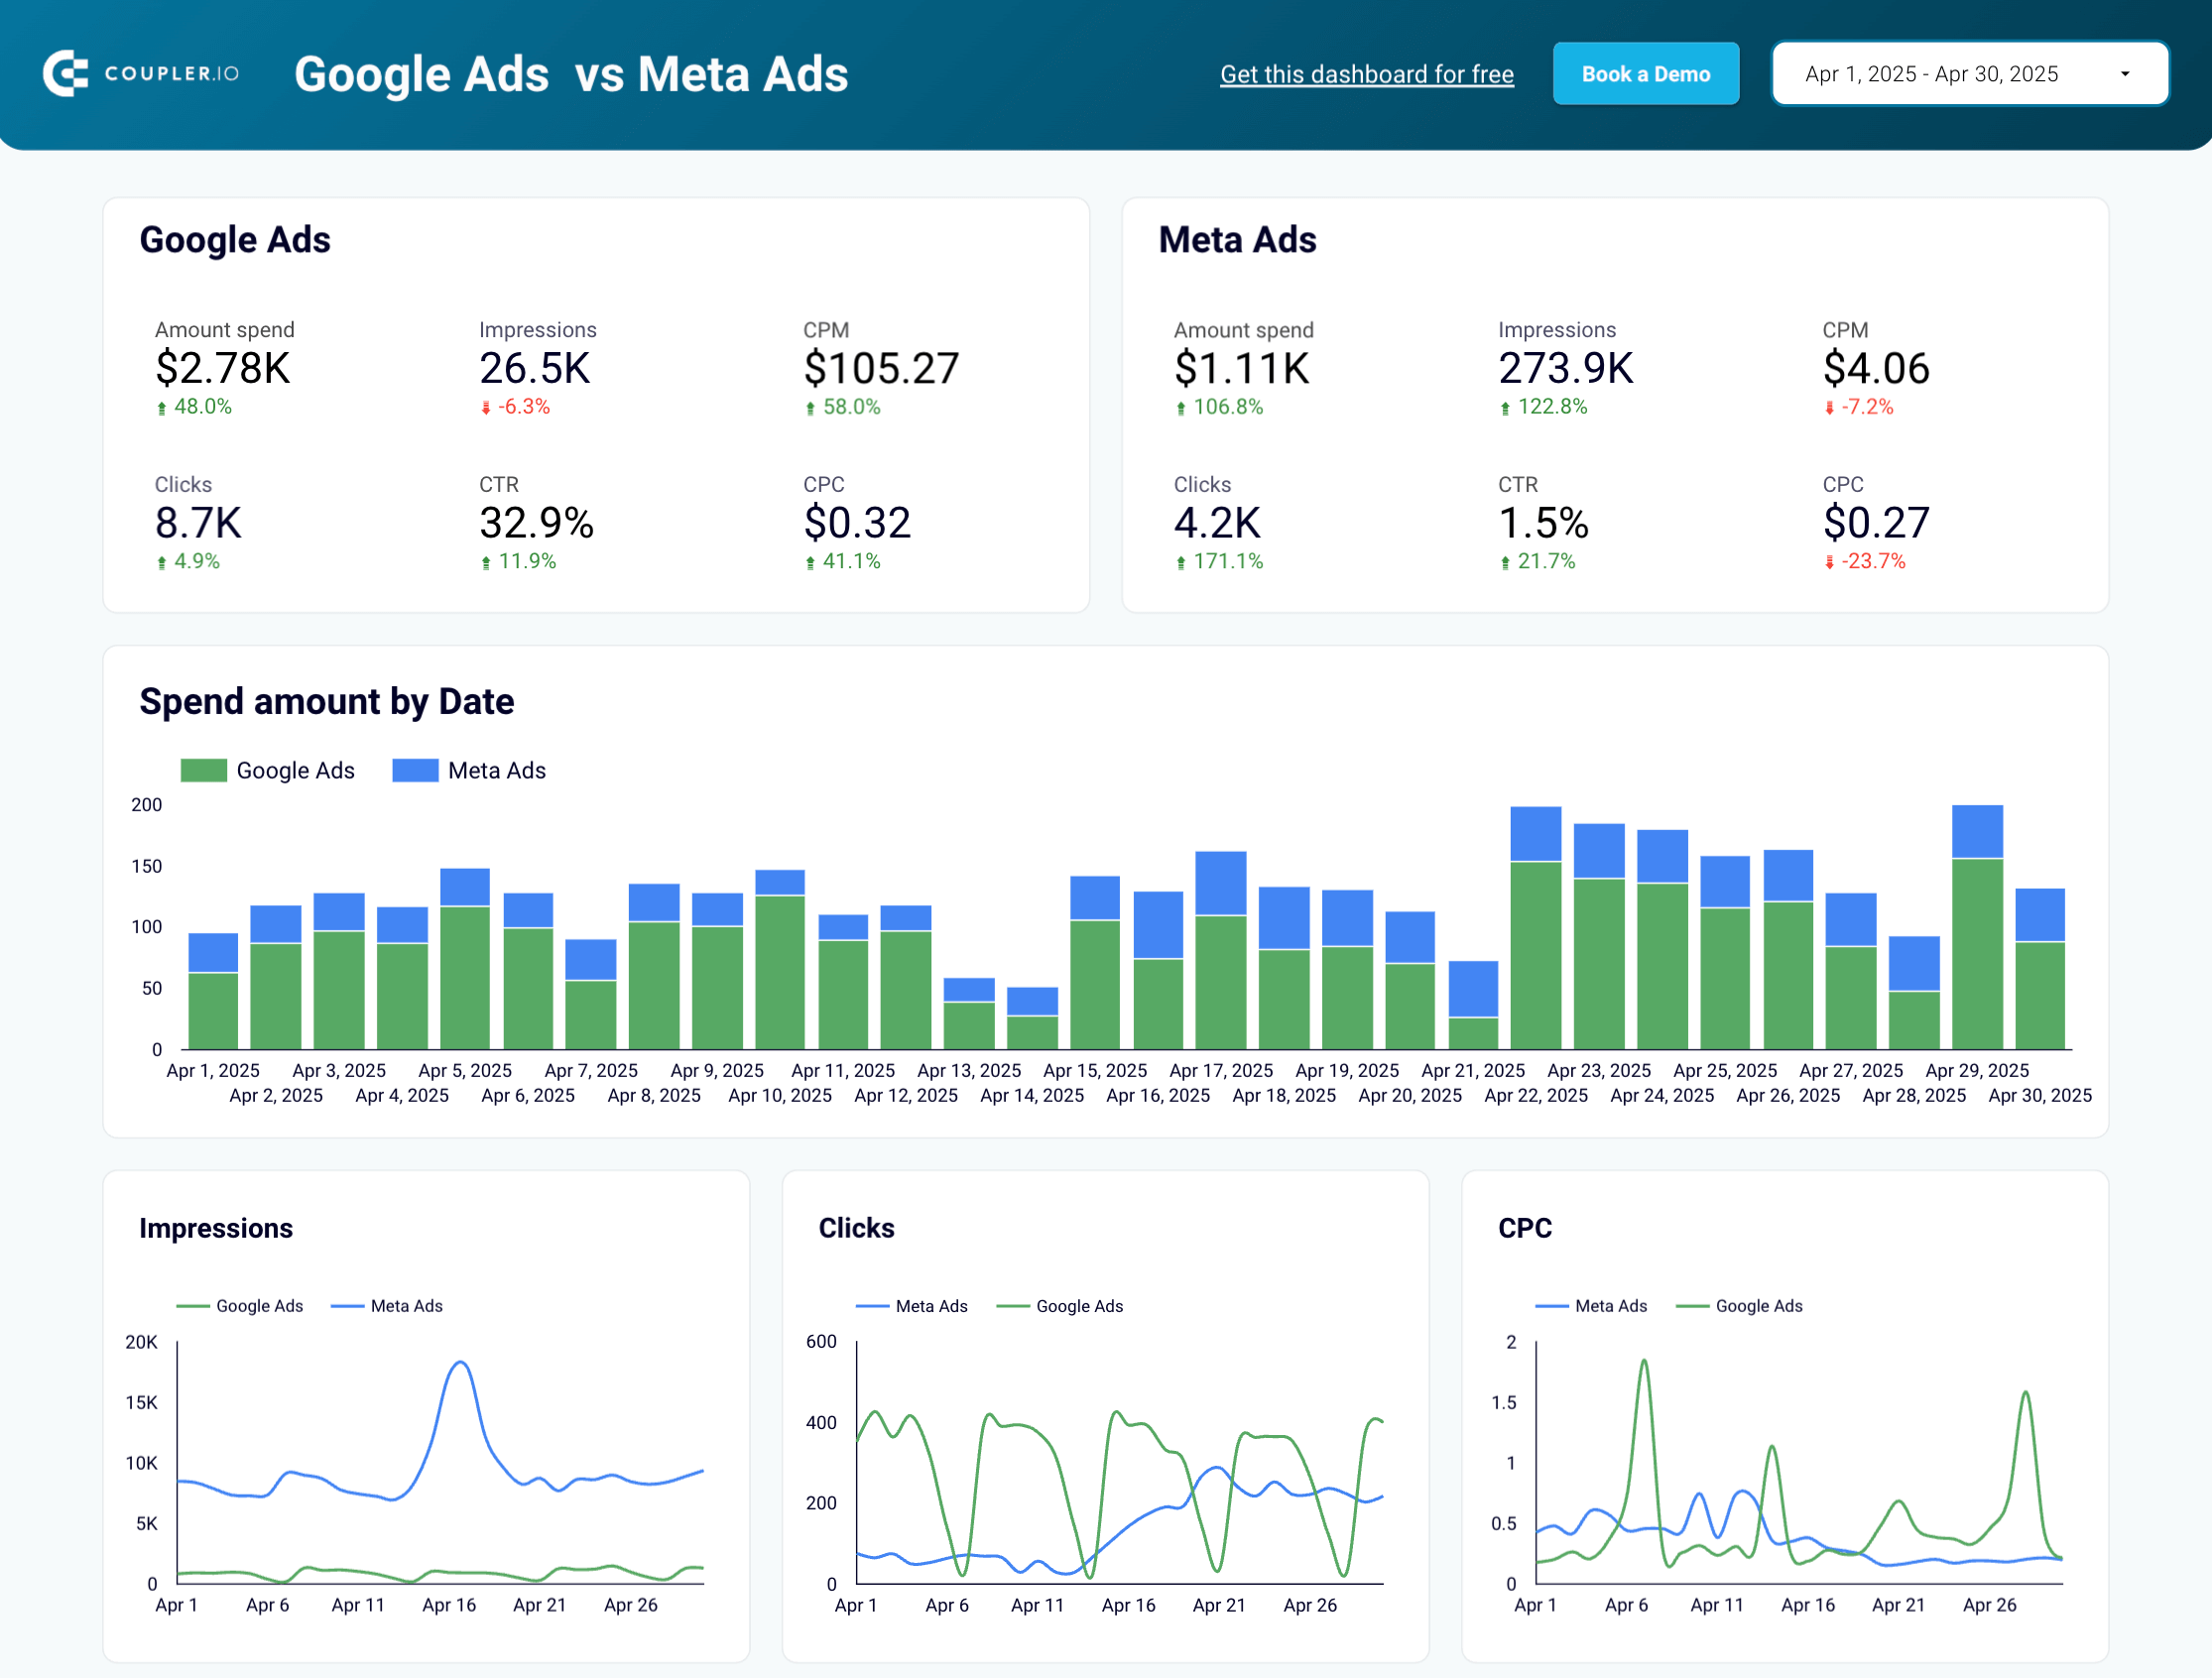
#9. Google Ads vs Meta Ads performance dashboard template
If you manage both Google Ads and Meta Ads campaigns, this Google Ads vs. Meta Ads template is for you. It offers a side-by-side comparison of performance metrics, enabling you to evaluate which platform drives better results for your business goals. By visualizing key metrics across both platforms, you can make data-driven decisions to optimize your digital advertising strategies.
Meta Ads and Google Ads campaign performance dashboard
 Preview dashboard
Meta Ads and Google Ads campaign performance dashboard
Preview dashboardWhat insights you can derive:
- Spend vs. Performance: Compare ad spend across Google Ads and Meta Ads and analyze their efficiency in generating impressions, clicks, and conversions.
- Cost Efficiency: Evaluate CPM, CPC, and CTR for both platforms to identify the most cost-effective channel for reaching your audience.
- Impressions and Click Trends: Monitor trends in impressions and clicks over time to understand platform engagement and adjust your targeting strategies.
- Campaign-Level Breakdown: Dive deeper into individual campaign performance for both platforms, assessing metrics like spend, clicks, CPM, and CTR to identify top-performing campaigns.
- Platform-Specific Analysis: Leverage granular insights for each platform to refine bidding strategies and allocate budgets effectively.
This Coupler.io template seamlessly pulls data from both Google Ads and Meta Ads into Looker Studio. Automated updates ensure real-time insights, empowering you to act quickly and optimize your ad spend.
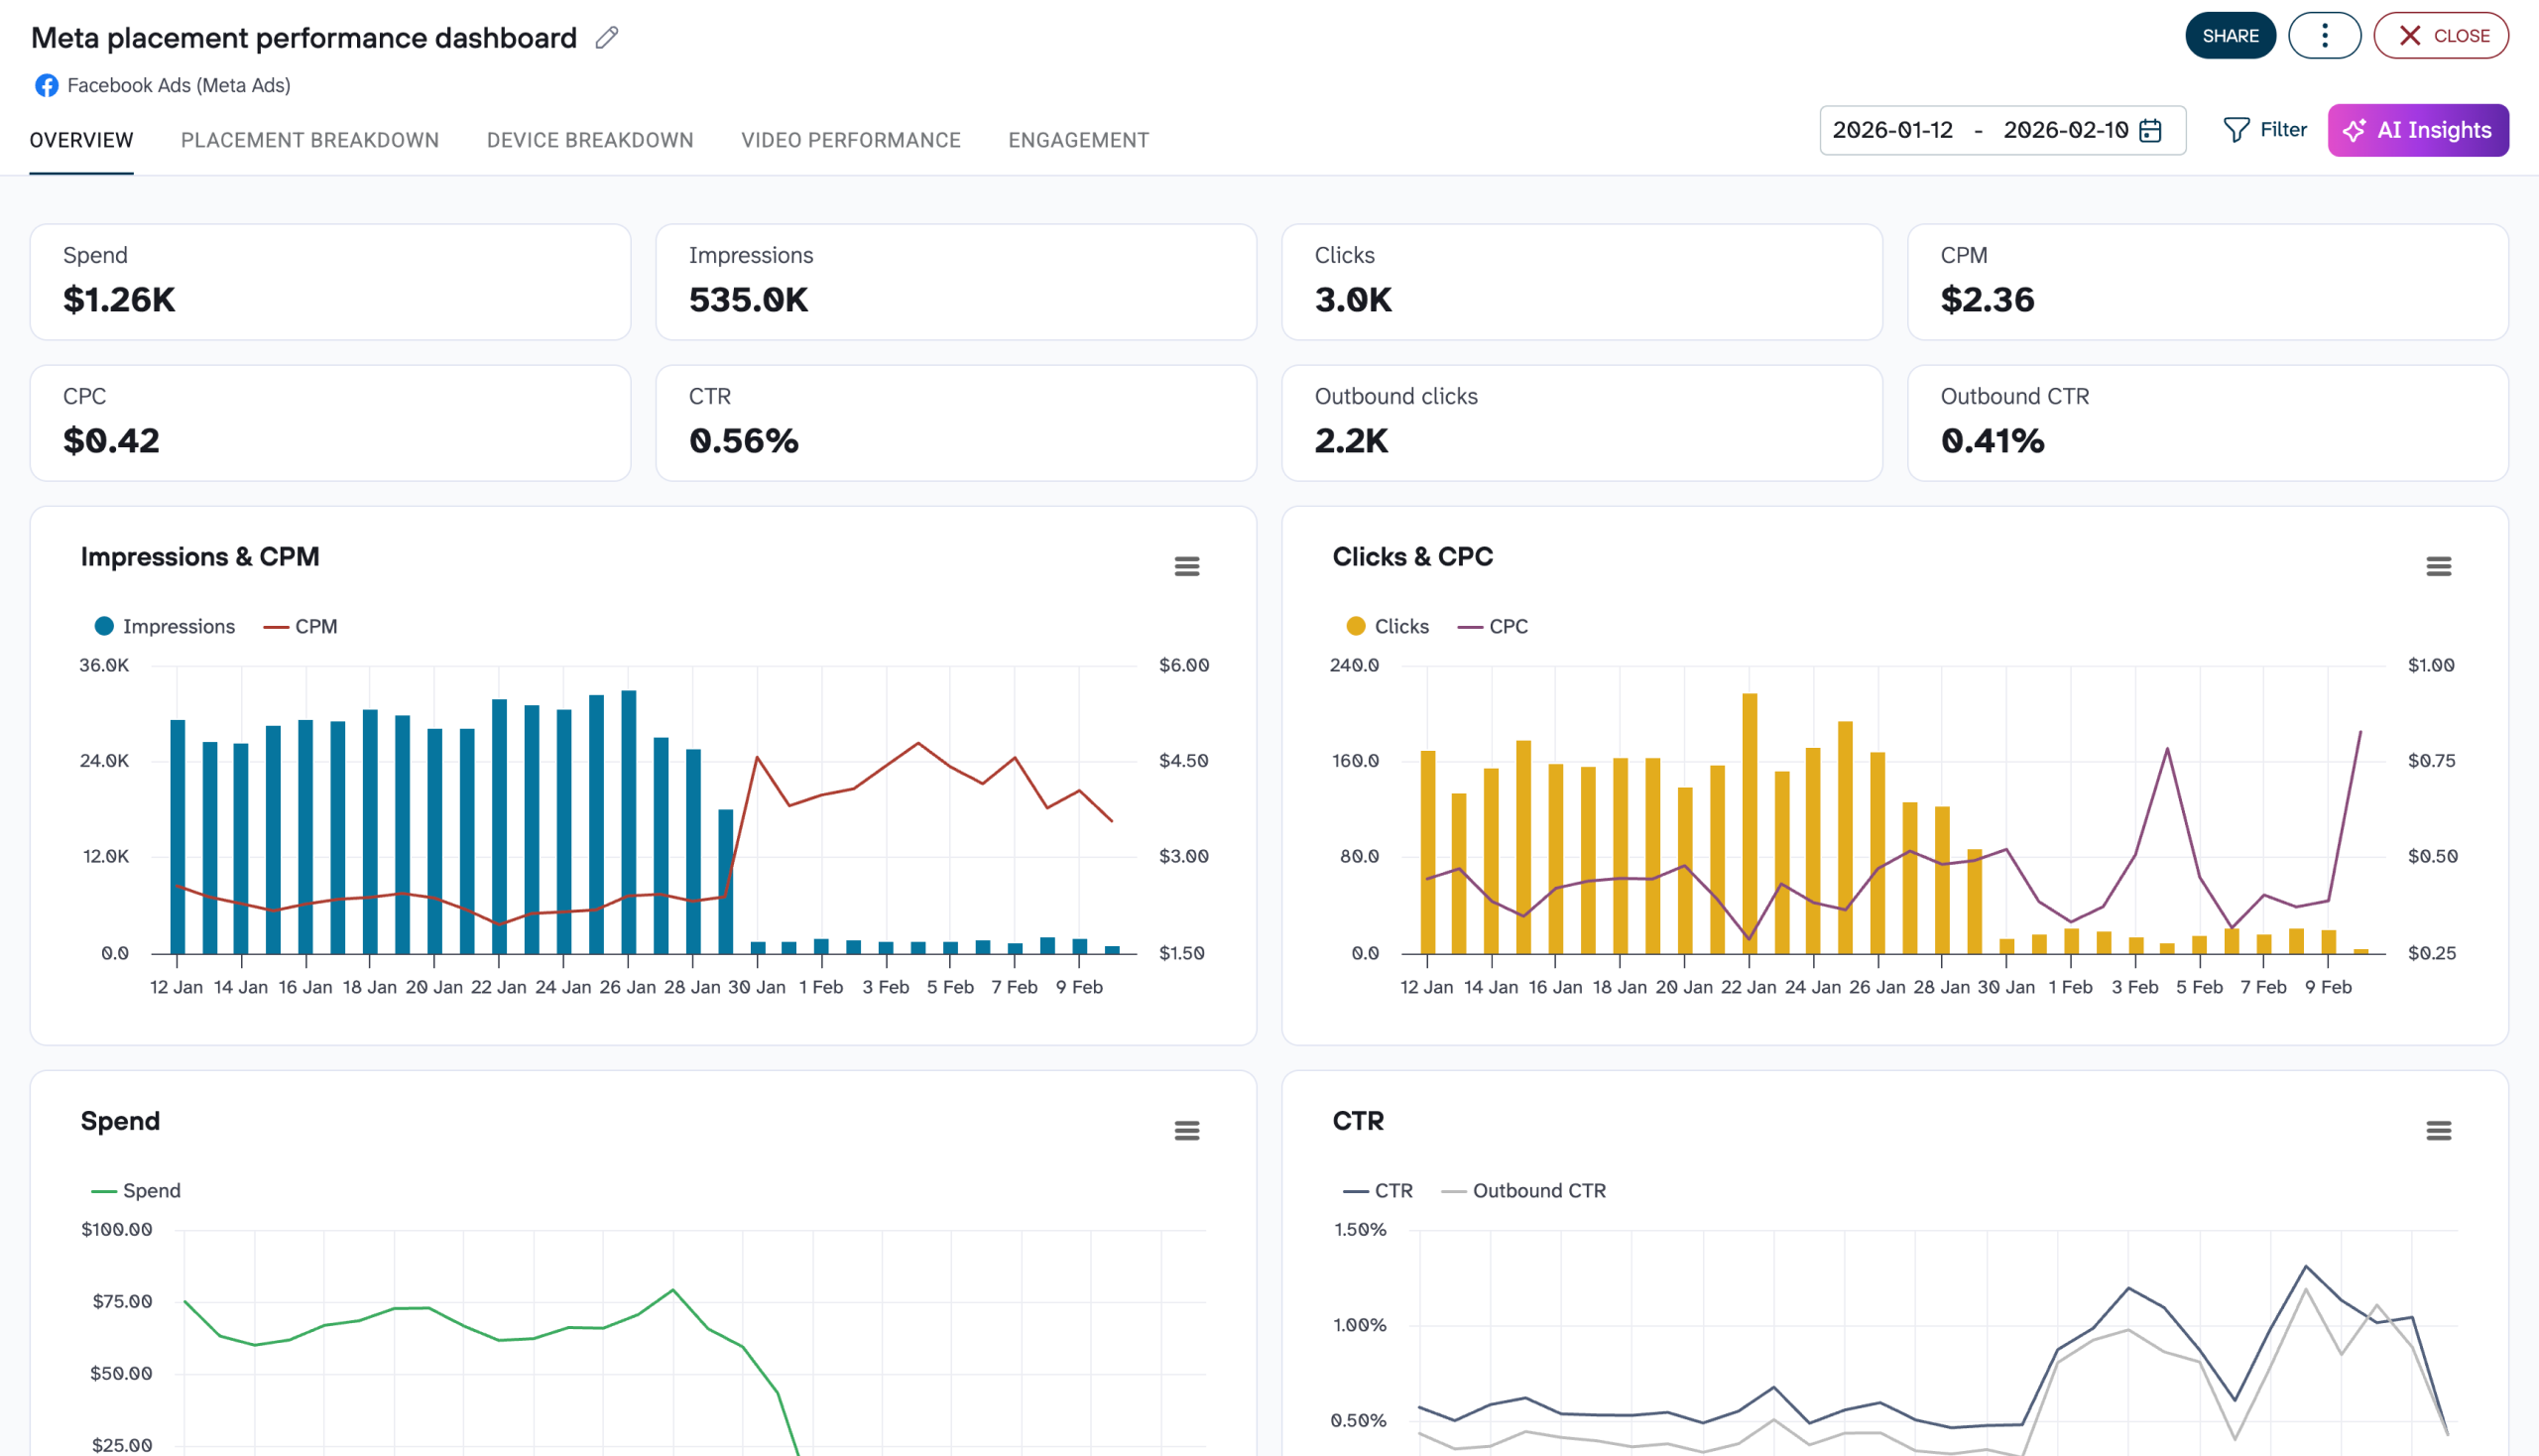
#10. Meta Ads placement performance dashboard template
The dashboard gives you a dedicated analytics view for placement-level and device-level Facebook Ads data, so you can move beyond campaign averages and see exactly which surfaces are delivering and which are not.
Meta Ads placement dashboard template
 Preview dashboard
Meta Ads placement dashboard template
Preview dashboardWhat insights you can derive:
- Placement vs. placement cost analysis: Directly compare CPM and CPC across all Meta placements to find where your budget generates the most clicks and impressions at the lowest cost.
- Engagement depth by format: Outbound CTR and engagement rate (reactions, shares, comments) reveal which placements drive genuine interaction versus passive impressions.
- Video retention funnel: A dedicated video page tracks completion rates at 25%, 50%, 75%, 95%, and 100% alongside Thruplay metrics.
- Device behavior patterns: See how mobile app, desktop, and mobile web audiences respond differently to the same ad, and whether one device type consistently outperforms others.
- Weekly trend alerts: Track how each placement’s metrics shift week over week..
Connect your Facebook Ads account through Coupler.io to populate the dashboard automatically on a refresh schedule you define.
With Coupler.io, you’re not limited to this single-channel Facebook Ads dashboard template. It provides other ready-to-go PPC reports and dashboards to analyze the performance of campaigns across different platforms.
Moreover, using the Facebook Ads MCP by Coupler.io, you can integrate data from Meta Ads with AI tools and have natural language conversations about performance issues and improvement suggestions. In the Coupler.io blog, you can find information about using AI for Facebook Ads and other platforms.
You may also find inspiration on optimizing your overall strategy in the top PPC trends for 2025.
Coupler.io allows you to connect Facebook Ads to multiple destinations and automate reporting. For example, the ads performance dashboard above is built in Looker Studio. At the same time, you can connect Facebook Ads to Power BI, or export data from Facebook Ads to BigQuery or a spreadsheet app – Facebook Ads to Excel.
We’ve already mentioned these Facebook Ads key metrics several times, so it’s high time to actually cover this in detail.
8 Facebook Ads key metrics
Here is a list of eight key metrics to analyze Facebook ad campaigns:
1. Reach
Reach – the number of unique users who saw the ad.
The reach metric in Facebook Ads analytics shows how many people saw your ad at least once, regardless of whether they engaged with it or not.
As a rule, a 10-30% reach of your target audience is considered to be an optimum indicator. However, to use an appropriate benchmark, you should take into account multiple factors such as industry, ad format, ad placement, ad budget, and other specific advertising goals and the audience you are targeting.
2. Impressions
Impressions – the number of times an ad was displayed on a user’s screen.
Every time your ad is displayed on Facebook, it’s an impression. Unlike the reach metric which measures the number of unique users who have seen your ad, impressions measure the total number of times your ad has been displayed.
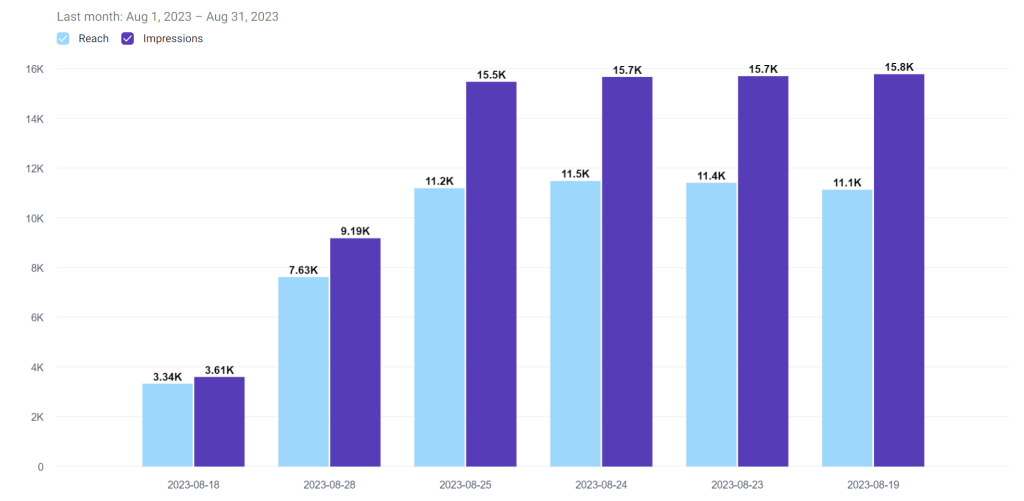
Reach and impressions usually go hand-in-hand since they are about reaching the target audience. However, impressions usually prevail in the number since an ad is being shown to a person more than once. This means that the number of impressions can be high but the number of people you reach is lower. You can try to optimize the reach-to-impression ratio by increasing the reach and reducing the frequency of ad display.
3. Clicks
Clicks – the number of clicks on the ad.
It’s clear that every time someone clicks on your ad, the number of clicks goes up. The more clicks you get the better. However, to consider your advertising campaign more or less successful, you should have at least 1 click per 100 impressions. This is where the click-through rate (CTR) comes in.
4. Click-Through Rate (CTR)
CTR – the ratio of clicks to impressions, expressed as a percentage.
A high CTR shows that your ad is resonating with your target audience and is driving a lot of clicks. A common benchmark for CTR is 1% but it will vary depending on the specifics of your ad campaign.
You’ll get CTR if you divide the number of clicks by the number of impressions, and express the result as a percentage.
CTR = clicks/impressions*100%
5. Cost per Click (CPC)
CPC – the average cost of a click on the ad.
Your goal is to keep your CPC low as it means you’re getting a lot of value for your advertising budget. CPC varies depending on industry and competition, so, it’s hard to say what a common or average metric you should strive for.
You’ll get CPC if you divide the cost of your ad campaign (amount spend) by the number of clicks.
CPC = amount spend/clicks
6. Conversion Rate
Conversion Rate – the percentage of users who completed a desired action.
Conversions here are the number of users who took a desired action, such as signup, click on the ad, filling out a form, etc. For example, if you sign up for Coupler.io via our Facebook ad, then our conversion rate will go up.
The optimum conversion rate is 2-3% and your goal should be to make it higher. A high conversion rate indicates that your ad is effectively driving valuable actions from your target audience.
To get the conversion rate, you also need to perform a mathematical operation – divide the number of conversions by the number of clicks.
Conversion rate = conversions/clicks*100%
7. Cost per conversion
Cost per conversion – how much a desired action completed by a user costs you.
Cost per conversion also represents conversion metrics. It basically indicates how much every conversion event costs to you. It’s one of the key performance indicators of every advertising campaign.
Cost per conversion can answer the question: Is my campaign profitable or not?
To have it profitable, your average conversion value, how much you earn, must be higher than the average cost per conversion. Basically, you need to make sure that the return on ad spend (ROAS) is above 1.
8. Return on Ad Spend (ROAS)
ROAS – the return on investment from the advertising campaign.
ROAS is the ratio of the campaign-generated revenue to the cost of the campaign. The optimum return on ad spend is 2 to 1, meaning that you earn $2 for every $1 spent on advertising. But of course, you need to grow your ROAS to get a good return on your advertising investment.
Aren’t you tired of math? ? To calculate your ROAS, you need to divide the revenue generated from your ad campaign by the money spent on the campaign.
ROAS = revenue/costs
For more on this topic, check our articles on Facebook Ads metrics and 2025 PPC benchmarks.
The role of Facebook Ads analytics in the health of your campaigns
The simple answer to the question ‘Why analyze Facebook ads data?‘ is to spend your advertising budget efficiently. With a data-driven approach to running advertising campaigns, you can be sure that your money won‘t be wasted and you’ll be able to maximize your returns.
Facebook Ads analytics will help you understand the health of your campaigns through key metrics: impressions, reach, clicks, click-through rate, cost per click, conversion rate, and return on ad spend. We’ll dive into these a bit later. However, you should keep in mind that this data is essential to identify areas of improvement and determine which strategies are working best for your campaigns.
Facebook Ads analytics provides you with valuable insights into how your campaigns are performing. You can see exactly how many people are taking specific actions on your website after clicking on your ads, such as making a purchase or signing up. Tracking conversions, in turn, allows you to understand the ROI of your ad campaigns better and make more informed decisions about where to allocate your advertising budget.
Another benefit Facebook Ads analysis provides is a wealth of data about the target audience, including information about age, gender, location, and interests. This information is crucial to understand how to target your audience more effectively.
You can compare the performance of different campaigns and target audiences to make more informed decisions about where to focus your efforts. All these insights are the result of sophisticated Facebook Ads funnel analysis. Now you understand the value of analytics. The next step is to learn how you can analyze Facebook ads data.
FAQ on how to analyze Facebook ads performance
We’ve collected a couple of frequently asked questions about analyzing ads on Facebook and provided you with guidance on how you can do this.
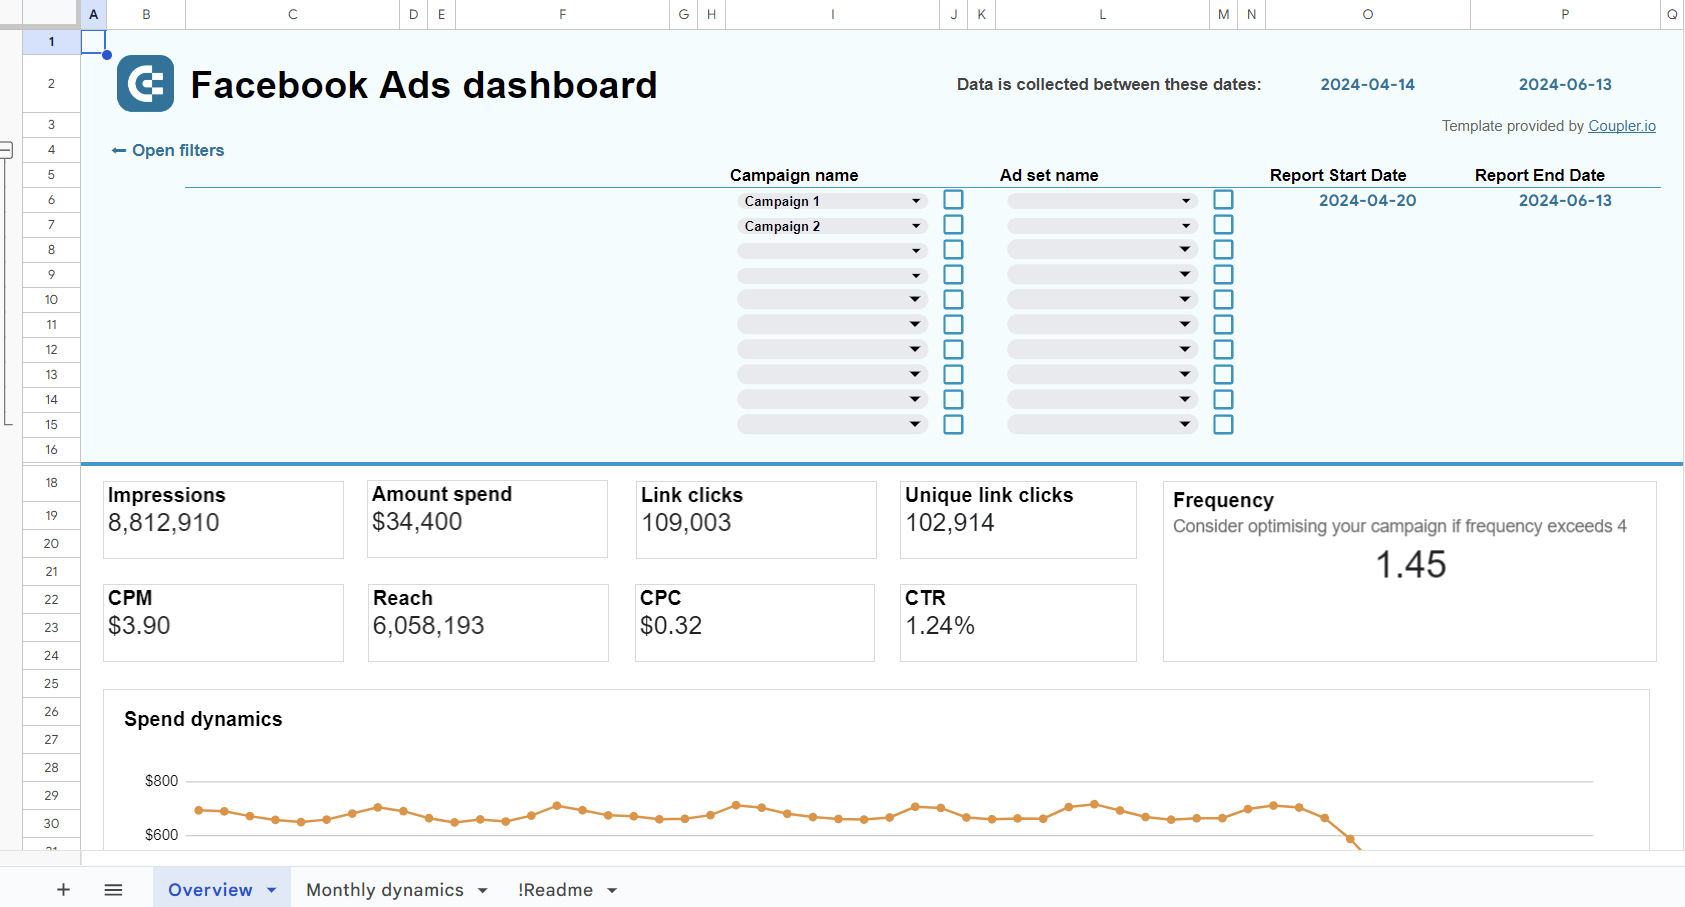
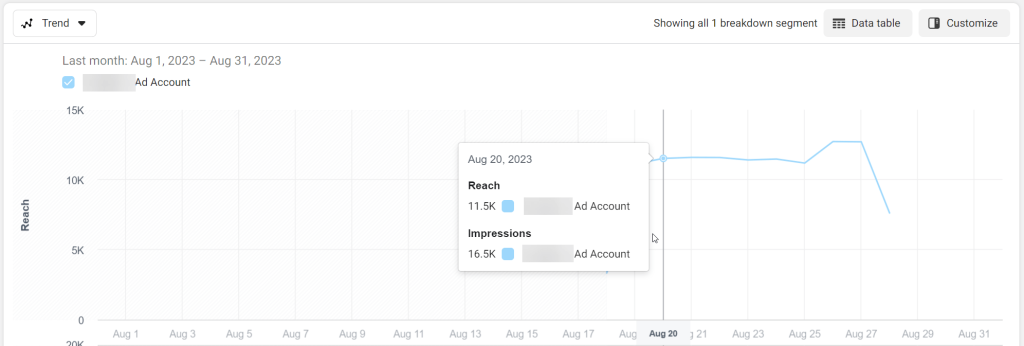
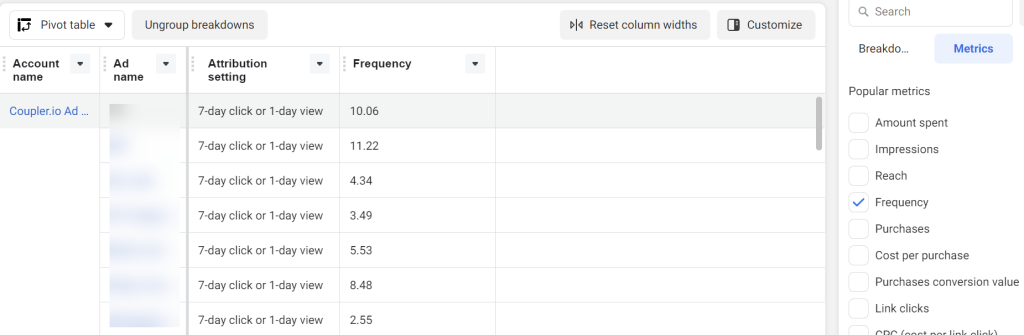
How to analyze frequency in Facebook ads
Meta Ads Reporting tool provides Frequency as a popular metric you can track. It’s defined as the average number of times a user has seen your ad. Here is what it may look like on the ads report.
How to analyze A/B testing Facebook Ads
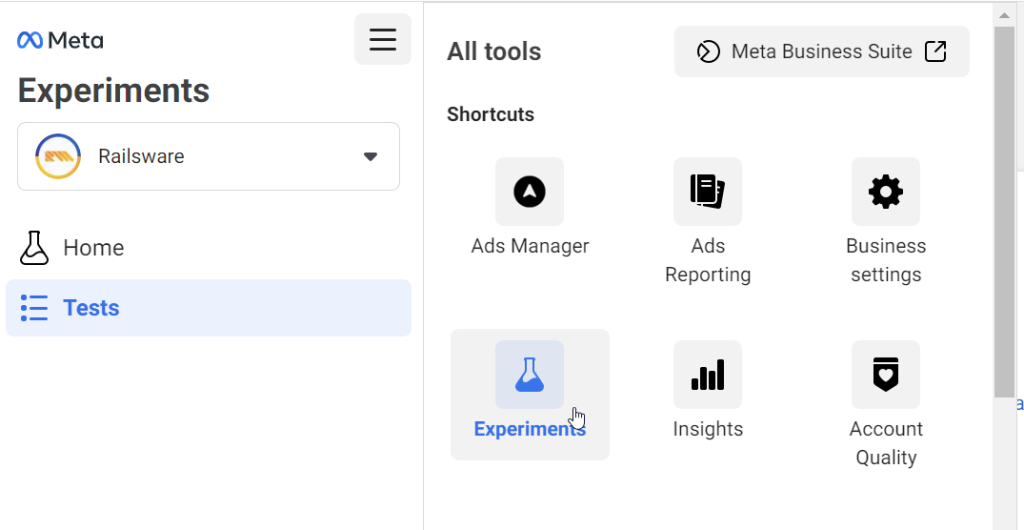
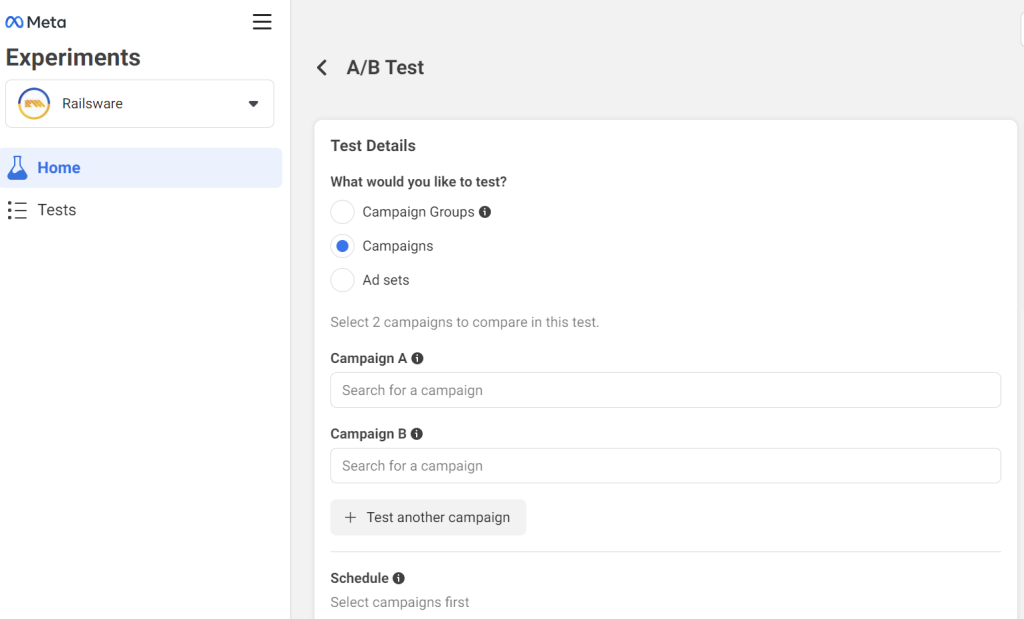
Facebook Ads allows you to experiment with different versions of your ads so you can see which works best. For this, you need to create campaigns for your A/B testing and actually create a test. Go to Experiments using the All tools menu.
- Click Get Started for A/B Test and fill out the required fields to create the A/B test.
Once the test is complete and you want to see its results, open your test. You’ll see two sections: Results and Test Details.
- The Results part contains a summary of the performance for your chosen metric, for example, CPC.
- The Test details part contains a summary of your overall test and ad campaign activity.
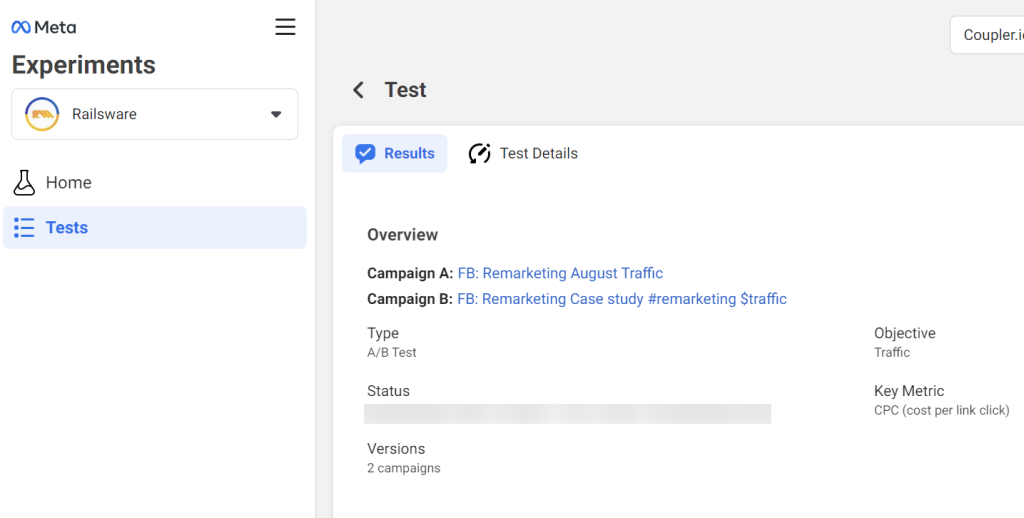
This data will let you understand which ad campaign showed better performance.
Bonus stage: manage Facebook Ads properly to make your analytics smart
What is Meta Ads Manager for?
- Create new ads. Ads Manager lets you create new ads in an easy and simple process. You will be guided to set your marketing objective, define the people you’d like to reach, manage the budget you want to spend, choose the places to show your ad, choose the ad format, and more.
- Manage multiple ads at once. You’ll be able to view, edit, and duplicate your existing campaigns at any time. It’s also easy to edit settings like audiences, budget, placement options, and creatives. You can even edit multiple ads at once.
- See how your ads are performing. With the Ads Manager reporting tools, you can see how your ads are performing in real-time. You’ll get insights on what to adjust – such as your ad creative, budget, or audience – so that they perform better over time.
Where is Ads Manager on Facebook
To access Ads Manager, go to https://www.facebook.com/adsmanager.
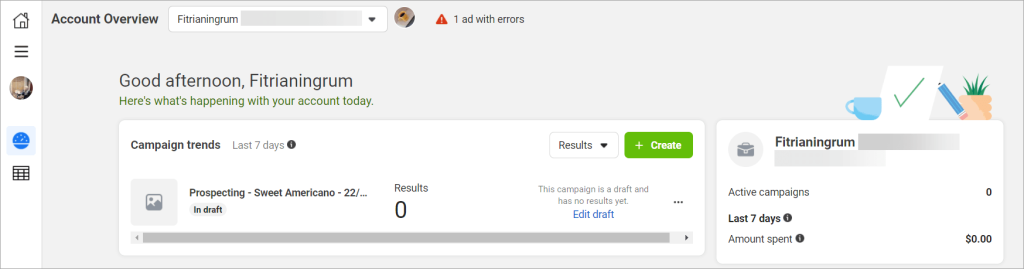
You’ll see the Ads Manager dashboard, which has two pages in its navigation.
The first one is the Account Overview page, where you can see everything that’s happening in your advertising account. If you’re running ads, you will see the results based on the objective and settings you selected. You will also see the amount you’re spending.
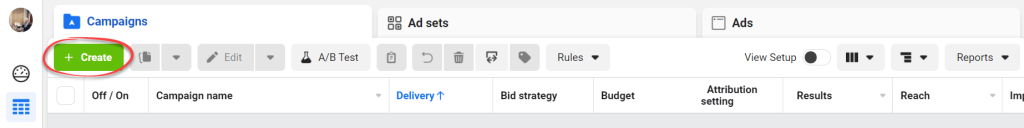
The second one is the Campaigns page, where you can see all the campaigns that you’ve created in a table. When you manage Facebook ads, you most likely spend most of your time on this page. You can track each campaign and see how well it is performing by looking at the columns in the table.
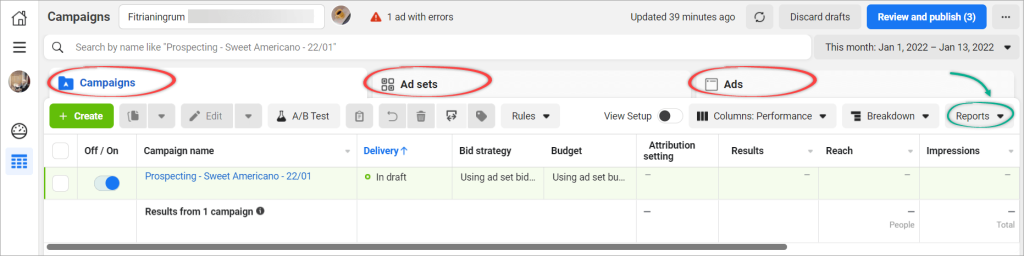
Notice that there are three tabs on this page: Campaigns, Ad sets, and Ads. In each tab, you will see a similar interface, such as a Create button on the left and a Reports dropdown on the right to access the ads reporting functionality.
The structure of Facebook ads
Facebook organizes ads into three distinct levels:
- Campaigns. At this level, you select your ad objective, which is the overall goal of your campaign.
- Ad sets. At this level, you choose your target audiences, which could be based on keywords, demographics, age, etc. You also choose your ad placements, determine a budget, and set a schedule.
- Ads. At this level, you design the ad creatives, which are the ads themselves. You choose your ad format, upload images or video, add headlines, and more.
You can have multiple ad sets under one campaign. Diversifying your target audience is key to finding successful ads. This way, you can see which of the many ad sets work best.
Within an ad set, you can also have multiple ads. This is really helpful to see which ad is better – videos or images, for example.
How to set up an ad in Facebook Ads Manager
The green Create button is your starting point to create all of your ad campaigns. If you click on it, Facebook will guide you through the necessary steps to create your Facebook ad.
Now, let’s take a look at the basic steps to create an ad. We’ll cover the steps on how to select your ad objective, how to manage budget, audiences, placement, and how to create your ad creatives.
#1: How to select your ad objective
Start by clicking the Create button. You will see a popup allowing you to choose your ad objective.
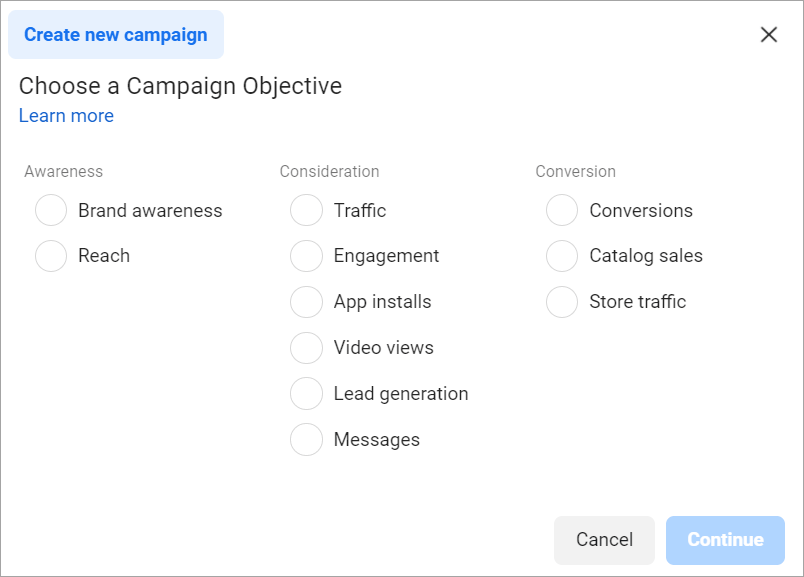
Choosing an objective is the first step in creating your ad campaign, and it’s what you are striving to achieve.
There are three main types of objectives for running an ad:
- Awareness — Your ads will show to the people that have never heard about your brand, product, or services. It’s to generate knowledge and interest in your product or service.
- Consideration — Your ads will show to the people that might be a little bit familiar but have never made a purchase. This objective is to allow people to engage with your business, click on specific links for more info, and keep your product or service top of mind.
- Conversion — Your ads will show to the people who are ready to convert. Those are the people that you’re ready to make a customer. Your ads prompt audiences towards a call-to-action (i.e., click to purchase, sign up for a promotion).
Once you’ve made your selection, optionally scroll down and enter your campaign, ad set, and ad names.
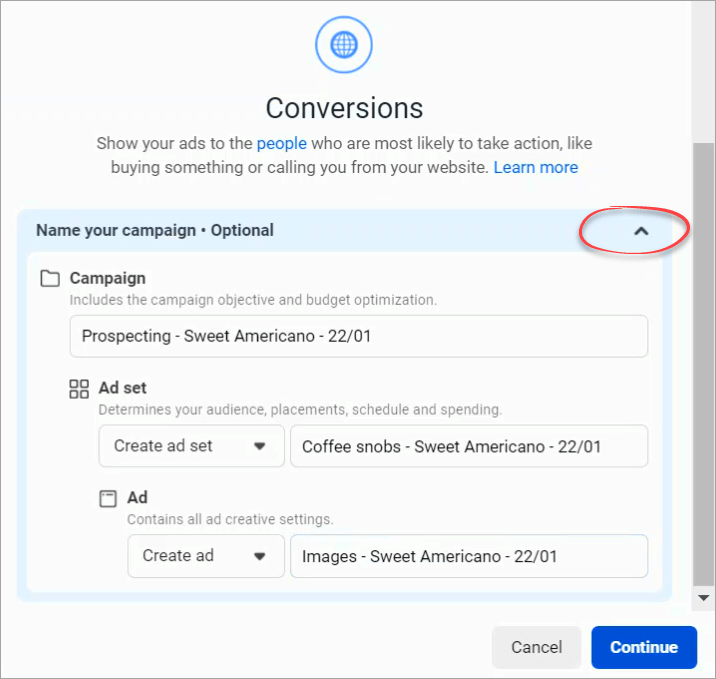
When done, click Continue. After that, you will be redirected to the campaign edit page.
#2: How to manage Facebook ads budget and schedule
To manage the budget of an ad set, go to a campaign edit page. Then, click on an ad set and scroll down until you find the Budget & schedule section.
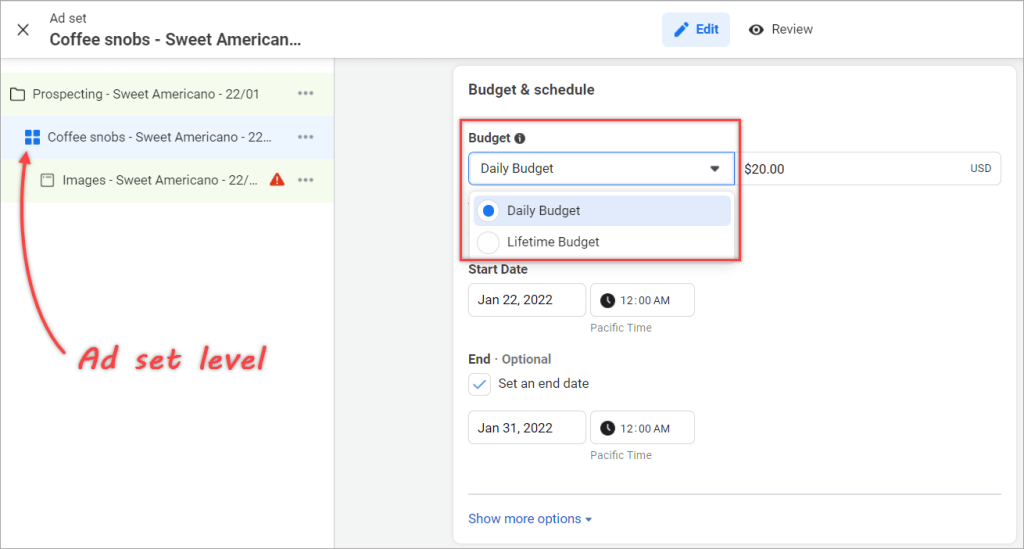
You can allocate your budget in two ways: Daily or Lifetime Budget.
Daily Budget
By default, Facebook suggests a $20 daily budget. However, you can essentially run an ad campaign for as little as $5 a day. Facebook then runs the Ads up to that limit, day after day, and charges you the agreed-on amount each day.
A daily budget of $20 means that you’ll need to pay $20 every day, on average. The actual amount spent daily may vary — it can be more or less than your daily budget.
You will need to set a start date for your ads to run. Optionally, you can set the end date.
Lifetime Budget
Instead of committing $20 per day, you may want to spend $300 per month. In this case, you’ll need to select the Lifetime Budget and specify the start and end dates of your ads.
#3: How to manage Facebook ads audiences
It’s very important to target a highly relevant audience with your ads. You don’t want someone clicking on your ad only for them not to be interested in what you’re selling because they are too young or too old, for example.
Managing audiences is done in the ad set level, as the following screenshot shows:
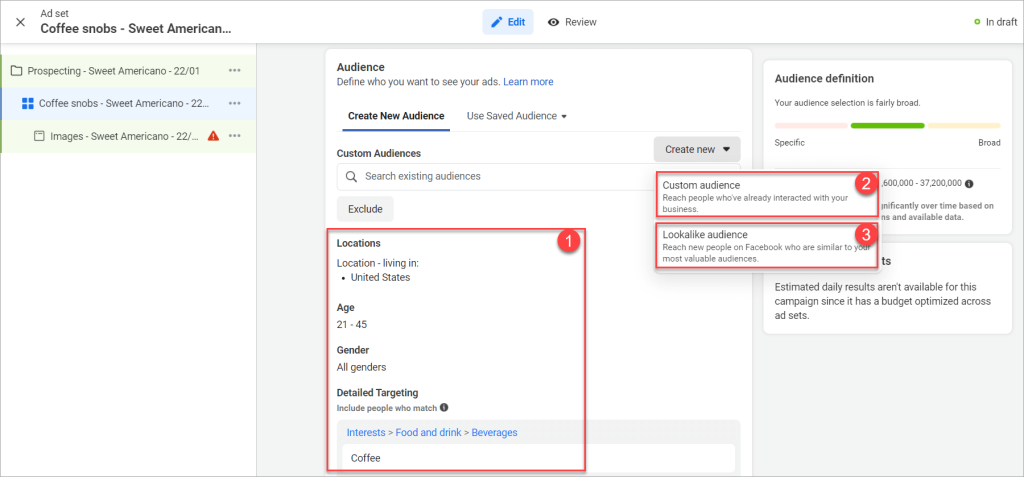
You have three audience selection tools to target your ad delivery:
- Core Audiences — You define an audience based on criteria such as age, gender, location, interests, language, and more.
- Custom Audiences — To get back in touch with people who have engaged with your business, online or off.
- Lookalike Audiences — To reach new people whose interests are similar to those of your best customers.
The ability to create Lookalike Audiences is one of the best features offered in Facebook Ads Manager. Essentially, this feature allows you to expand your advertising reach.
#4: How to manage Facebook ads placements
Just like managing budget and audience, you can manage Facebook ads placements at the ad set level. And in the following screenshot, you can see that there are two options to manage ad placements: automatic or manual.
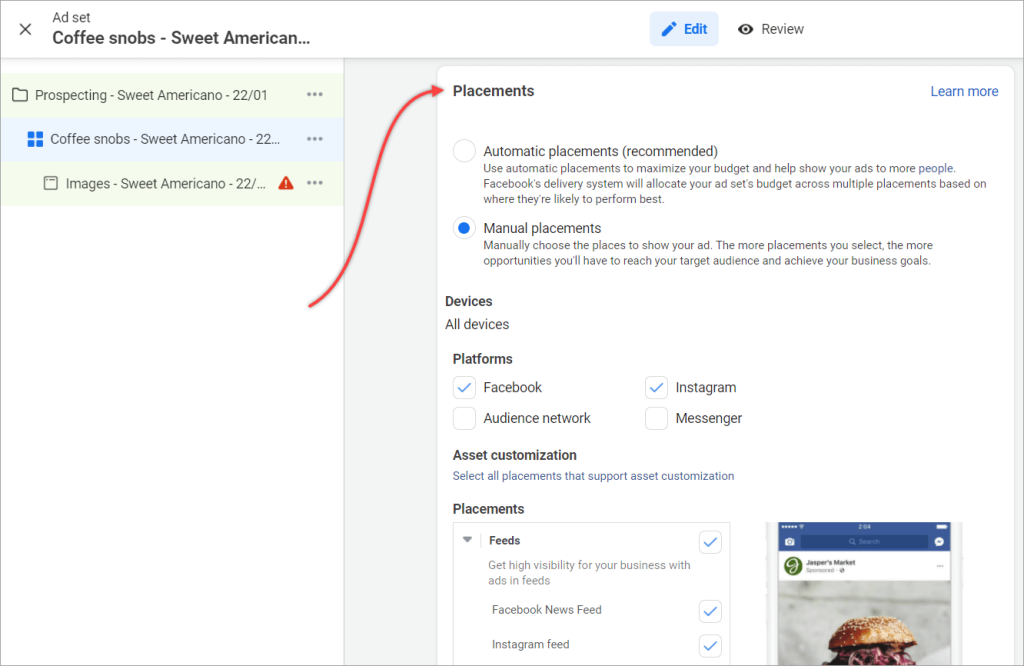
Automatic Placements is the recommended option to get your ad placed. Facebook’s powerful machine learning can test out different scenarios and placements a lot quicker than the manual option.
You may want to choose Manual Placements if you already know which placements work best for your audience. When selecting this option, you will need to manually configure where to place your ads based on things like:
- Device: Mobile, Desktop.
- Platforms: Facebook, Instagram, Audience Network, Messenger.
- Feeds placements: Facebook News Feed, Instagram Feed, etc.
- Stories and Reels placements: Facebook Stories, Instagram Stories, Instagram Reels, etc.
#5: How to choose your Facebook ads creative
To manage an ad creative, select an ad on a Campaign edit page. You’ll be able to customize the media, text, and call-to-action for your ad based on the ad format you selected.
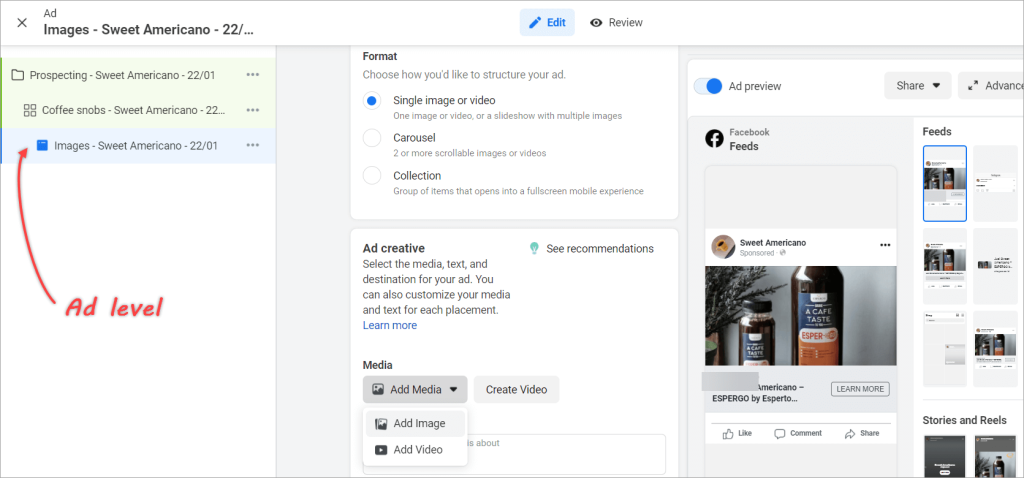
There are 3 different ad formats:
- Single image or video: One image or video, or a slideshow with multiple images.
- Carousel: Two or more scrollable images or videos.
- Collection: Group of items that display into a fullscreen mobile experience.
After uploading media such as an image or video, the next step is to insert a copy for your ad by providing the following things:
- A headline.
- Text to tell people what your ad is about.
- Call to action (subscribe, contact us, etc.).
- Destination (can be a website’s URL).
There’s also an Ad preview option on the right pane to preview your ad. If you find it takes a lot of time to load your ad, you can always turn it off.
Facebook ads management cost
So, how much do Facebook ads cost? Well, it’s hard to tell the exact amount. That’s because the cost will vary depending on several factors, such as your industry, target audiences, ad placements, and multiple other factors.
It’s hard to generalize, but you may well end up paying between $0.5 – $2 for every click a Facebook user makes on your ad.
Suppose, in your case; it costs $2 per click. So, to get ten clicks — enough in many cases for one sale as a result — you need to commit $20 a day, or about $600 a month. In this scenario, each sale costs you $20.
If a campaign seems effective, you may want to double your budget. It’s easy to adjust your budget as you want, and we’ll cover it in the later section.
Facebook ads campaign management tips
To wrap up this bonus section, we decided to share some advice that will be valuable for those who are just starting their path with Facebook ads campaigns.
- Write a great copy for your ad. You can’t just send any old text – you need great copywriting to make your ads more powerful and connect with your target audience better. Keep your copy short and simple, and have a clear call to action (CTA).
- Choose compelling images. Pick images that will grab your audience’s attention. Don’t just use any cute cat or baby images you find on the Internet ?
- Have someone else review your ad to ensure your ad is easy to understand.
- Test everything, from your ad copy, images/videos, ad placements, target audience, even your budget. You won’t know which ad will give you better results until you test them.
- Keep improving the performance of your ads. For example, if you find that your ads are bringing in many clicks but no sales, try refining your target audience. This will help you avoid losing more money on your ads.
Learn more about performance marketing for SaaS.https://l.rw.rw/dashboards/meta-ads-monthly-dashboard
It’s also important to know that Facebook reviews every single ad you publish on the platform. So, be sure to check their advertising policies to ensure your ad complies and prevent it from being rejected. Understanding what you can and cannot advertise on Facebook may save you a lot of time and money in the future.
Even if you follow all the advice above, this won’t guarantee the success of your campaign. This is where Facebook Ads analytics should come into play to help you figure out the bottlenecks and areas to improve. Then you’ll be able to fix those problems and understand how to optimize Facebook Ads and increase their performance over time.
For more tips on optimizing ad campaigns for different platforms, check our article on Facebook Ads not converting and on setting up LinkedIn Ads analytics. You can also enrich your marketing analytics by learning how to leverage first-party data.
Good luck with your data!

Create dynamic Facebook Ads analytics reports using Coupler.io
Get started for free