
Managing reports for multiple clients on GoHighLevel means hours of manual work each month—especially on the Starter plan where custom reporting isn’t even available. Even on higher-tier plans, native reporting has significant limitations that can slow down your agency operations.
In this article, we show the easiest way to automate GoHighLevel reports on any plan without spending hours.
Problems with the native reporting options
The custom reporting and scheduling features in GoHighLevel come with a few limitations, such as:
- Lacks in-depth analytics – The reports offer basic metrics and visualizations, but it does not allow advanced analysis. For example, you can not perform a cohort analysis of the customers to monitor repeat purchases.
- Limited widgets – GoHighLevel’s “custom reports” are not truly custom. You’re limited to the widgets offered by the platform for creating reports. The platform does not allow you to combine disparate metrics into a single chart for analysis.
- Time zone discrepancies – Users often face timezone issues with GoHighLevel reports, leading to inaccurate data in reports. This means that a lead captured on Monday can appear in Tuesday’s totals because of timezone differences, leading to inaccurate reporting.
- No support for external data sources – GHL reports use data available within the platform only. You cannot pull data from external e-commerce platforms like BigCommerce, Shopify, or WooCommerce that aren’t natively supported. This means if you’re running an online store alongside your GHL marketing activities, you can’t create unified reports showing the complete customer journey from lead to purchase.
The solution is to build a custom dashboard outside GoHighLevel in spreadsheets (Google Sheets or Excel) or BI tools (Looker Studio, Power BI). This alternative approach offers greater reporting flexibility.
You can achieve this by using Coupler.io, a data integration and AI analytics platform that connects GoHighLevel and 300+ other data sources to 10+ destinations like Looker Studio, Power BI, and spreadsheets. These data flows can also be automated so that your reports display up-to-date information.
It takes less than ten minutes to build a data flow using Coupler.io‘s no-code interface.
How to automate GoHighLevel reporting with Coupler.io?
You can automate GoHighLevel data flow using Coupler.io in three easy steps:
Step 1. Connect your GoHighLevel account
In the form below, select the destination. For example, you can connect GoHighLevel to Looker Studio and Google Sheets.

Sign up for a Coupler.io account for free with no credit card required. Once logged in, connect your GHL account to the dataflow.
Then, choose the data entity, i.e., Opportunities, Invoices, Contacts, etc., and proceed.

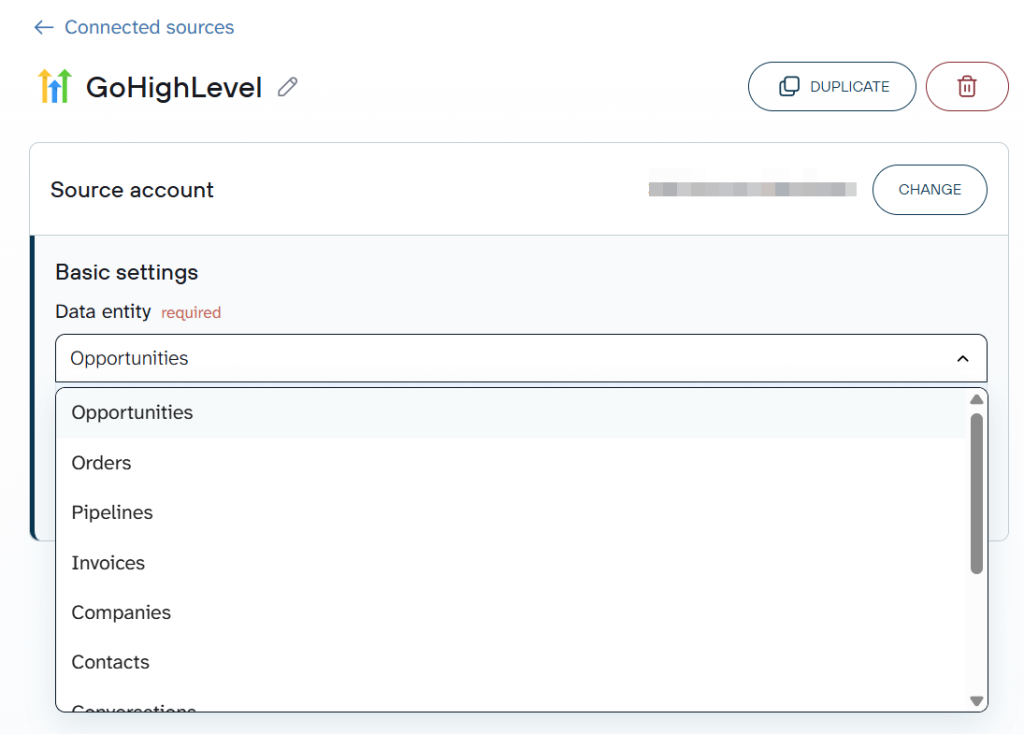
If required, you can connect other data sources to the flow before moving ahead.
Step 2. Organize your data set (optional)
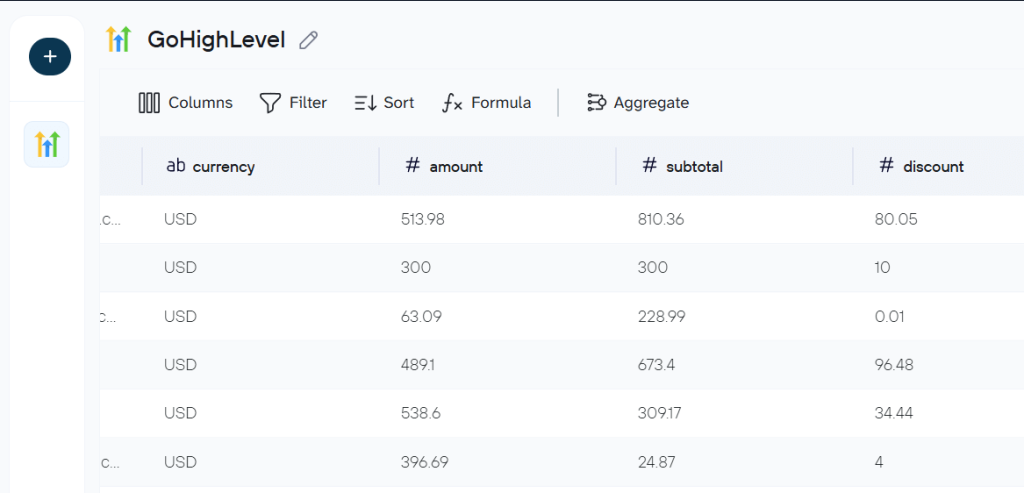
Generally, the raw GHL data is not ready for direct use in reporting (e.g., it contains unnecessary columns or lacks certain KPIs). Therefore, you may need to perform transformations to use it for reporting.
In this step, you can perform operations like:
- Hide unwanted columns
- Rename or rearrange the columns
- Filter or sort data
- Aggregate data using sum, average, count, min, or max
- Add new calculated columns

If you have added multiple data sources, like different GHL reports or other marketing platforms, you can combine them into a single data set.
Step 3. Load data and schedule refresh
Follow the instructions shown on screen and connect to your chosen reporting destination. Similarly, Coupler.io lets you integrate data from GHL with AI tools like ChatGPT, Claude, and Perplexity. This enables you to ask questions and get answers about your data. Read till the end to learn more about it.
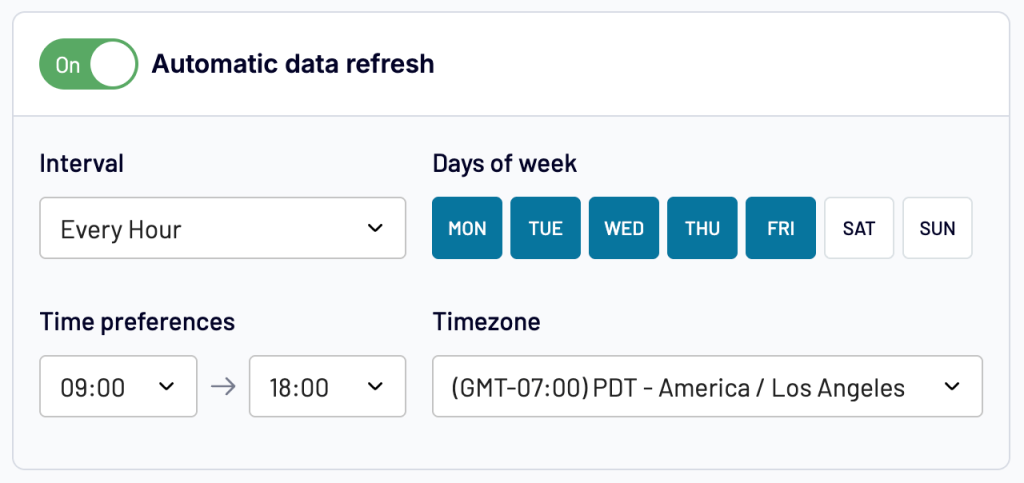
Then, you can configure the automatic data refreshes to keep the GoHighLevel report updated. Set the data refresh interval (e.g., every 15 minutes, 1 hour, etc.), choose the days of the week and time preferences.

In addition to GoHighLevel, you can connect more data sources to the report using Coupler.io to create a single marketing dashboard. Some popular marketing data sources include Google Search Console, Google Analytics, and Mailchimp.
Save time with ready-made GoHighLevel reporting dashboards
Building a report from scratch is a time-consuming process. You need to set up all the required data sources and configure charts manually, which could be overwhelming. One easier and faster option is to use ready-made reports.
Coupler.io offers plug-and-play dashboard templates to analyze your data instantly, which only require you to connect your GoHighLevel account and are self-updating.
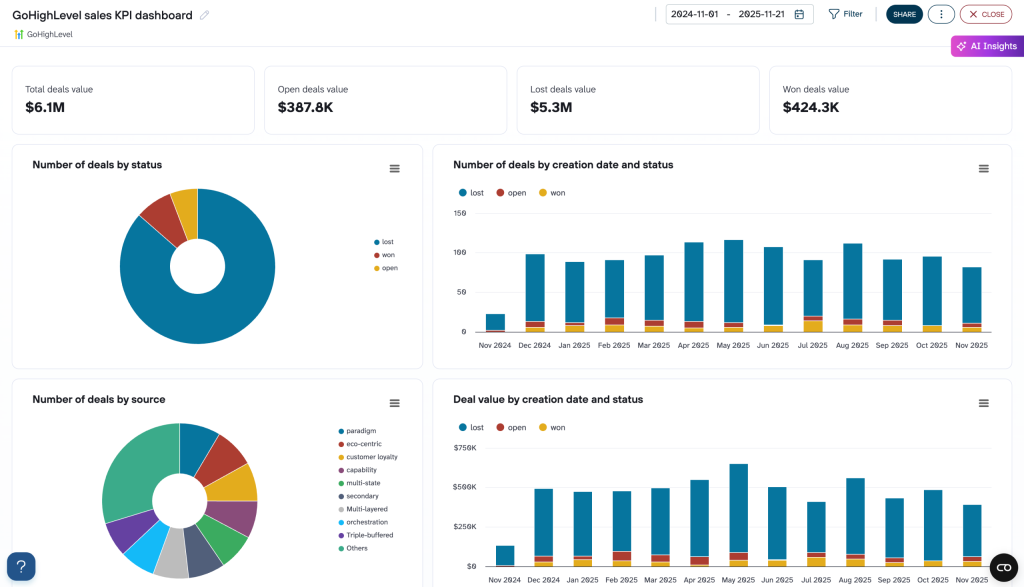
Sales KPI dashboard
This GoHighLevel reporting template helps your sales team track the entire pipeline by consolidating all your important sales data into a clear report. Plus, the entire report can be filtered for a specific date range, pipeline, and deal source.
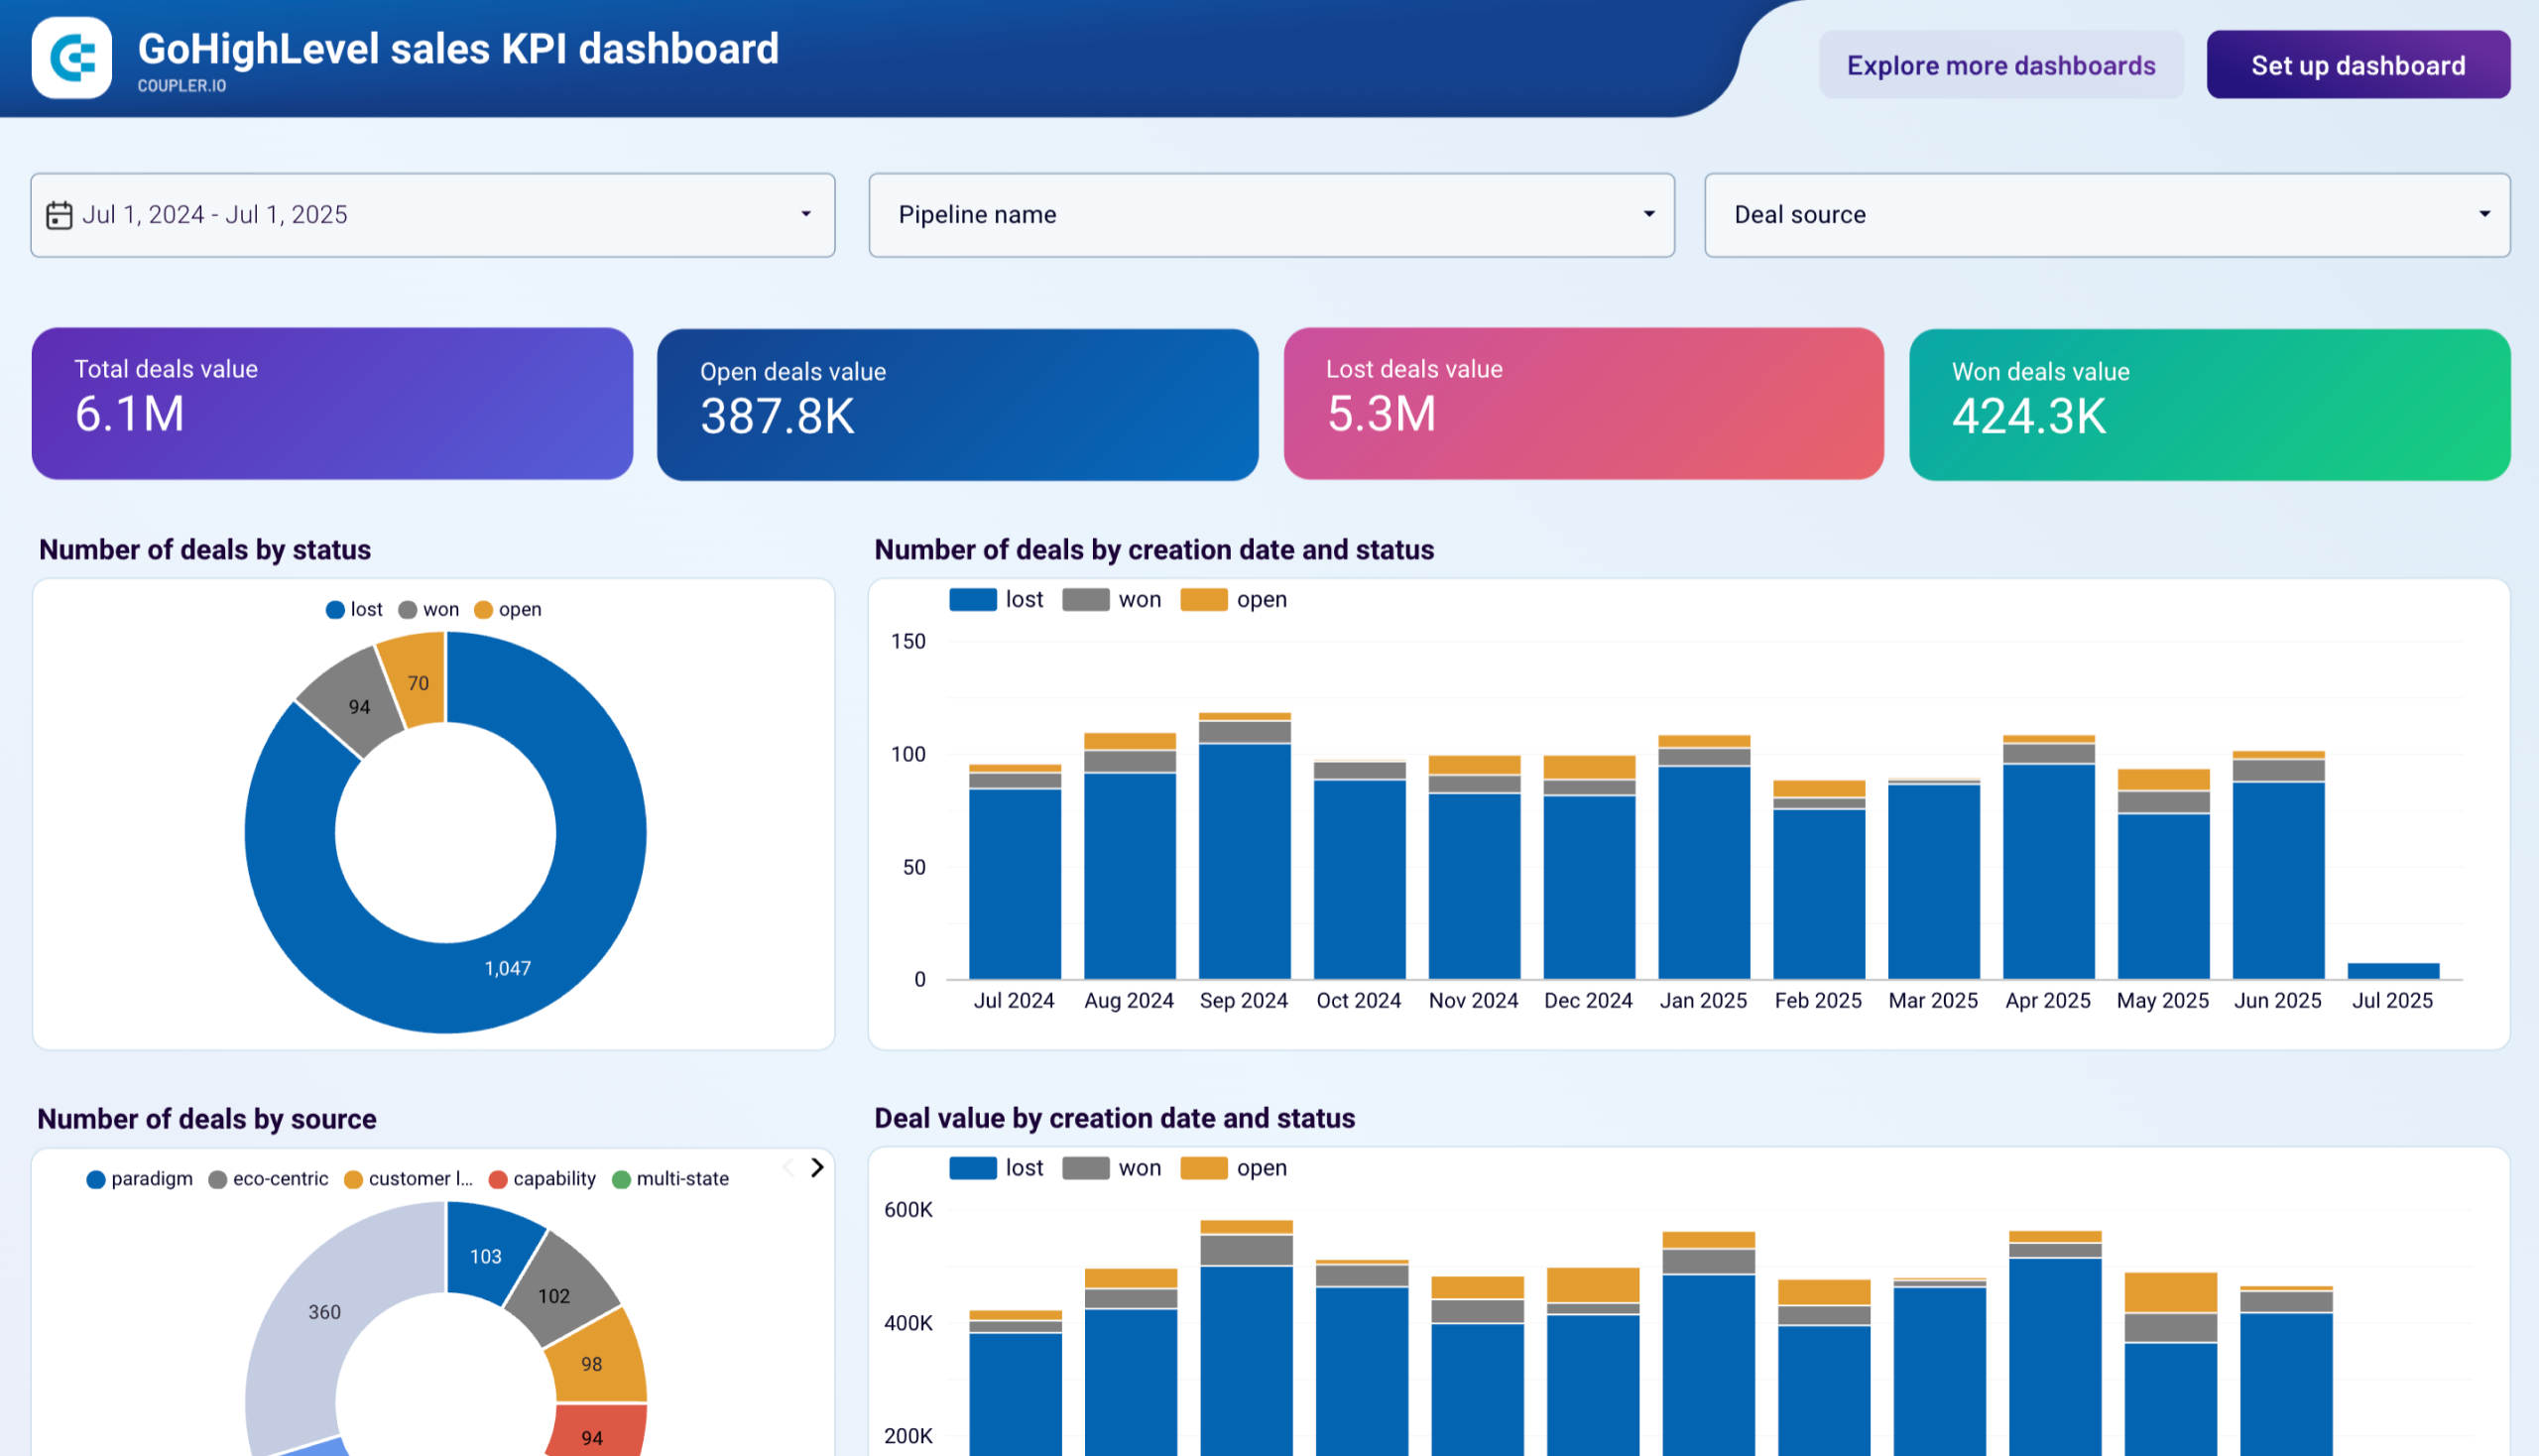
You get an instant view into your sales funnel health with total deal value metrics, along with the value of deals that are open, won, and lost.
The chart helps you discover which lead sources generate the most deals and revenue so you can focus your marketing efforts where they have the most impact. Further, understand how your sales velocity and quality over months are through trend charts by the number and value of deals.
Sales KPI dashboard for GoHighLevel


Sales KPI dashboard for GoHighLevel
Preview dashboardThe report also helps you identify bottlenecks in your sales pipeline by showing the number of deals at each stage. This helps you discover the sales funnel areas to focus on for better conversions.

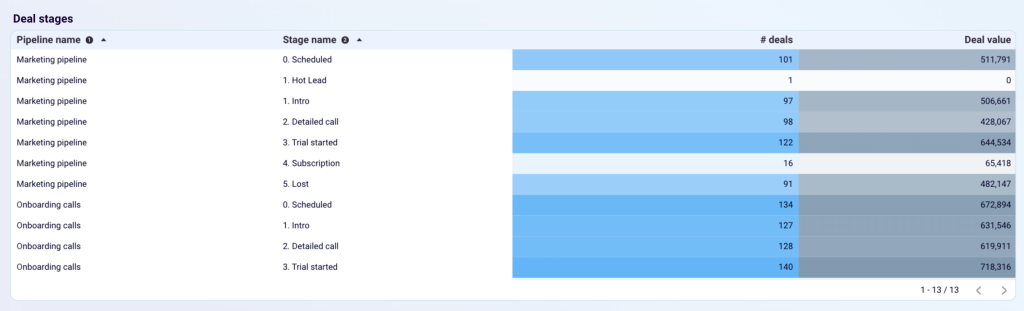
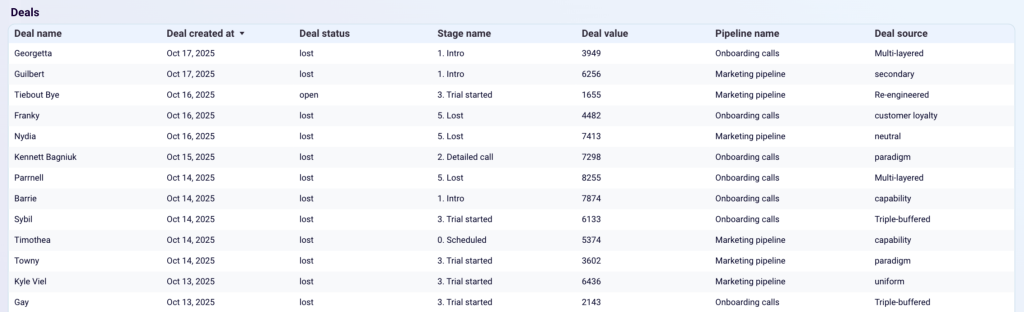
In addition to the high-level charts, you get a detailed breakdown of all the deals at the bottom. This allows a more granular sales analysis and helps you find information about a specific deal without logging into any platform.

You can use the dashboard in Coupler.io or as a Looker Studio template. Open it and follow the instructions given in the Setup guide tab. You’ll need a Coupler.io account, which is free to create. Once you log in, connect your GoHighLevel account to the ready-made data flow to start using the dashboard.
Sales KPI dashboard for GoHighLevel
Monitor key sales performance indicators from GoHighLevel with tracking of deal values, win rates, and pipeline progression. Analyze deal sources, track status changes over time, and evaluate pipeline stage effectiveness to identify successful patterns and optimize your sales process for better conversion rates.


Sales KPI dashboard for GoHighLevel in Looker Studio
Evaluate sales team performance and pipeline health with key metrics on deal progression, revenue trends, and conversion rates to identify best practices and optimize your sales process.

Customer acquisition dashboard
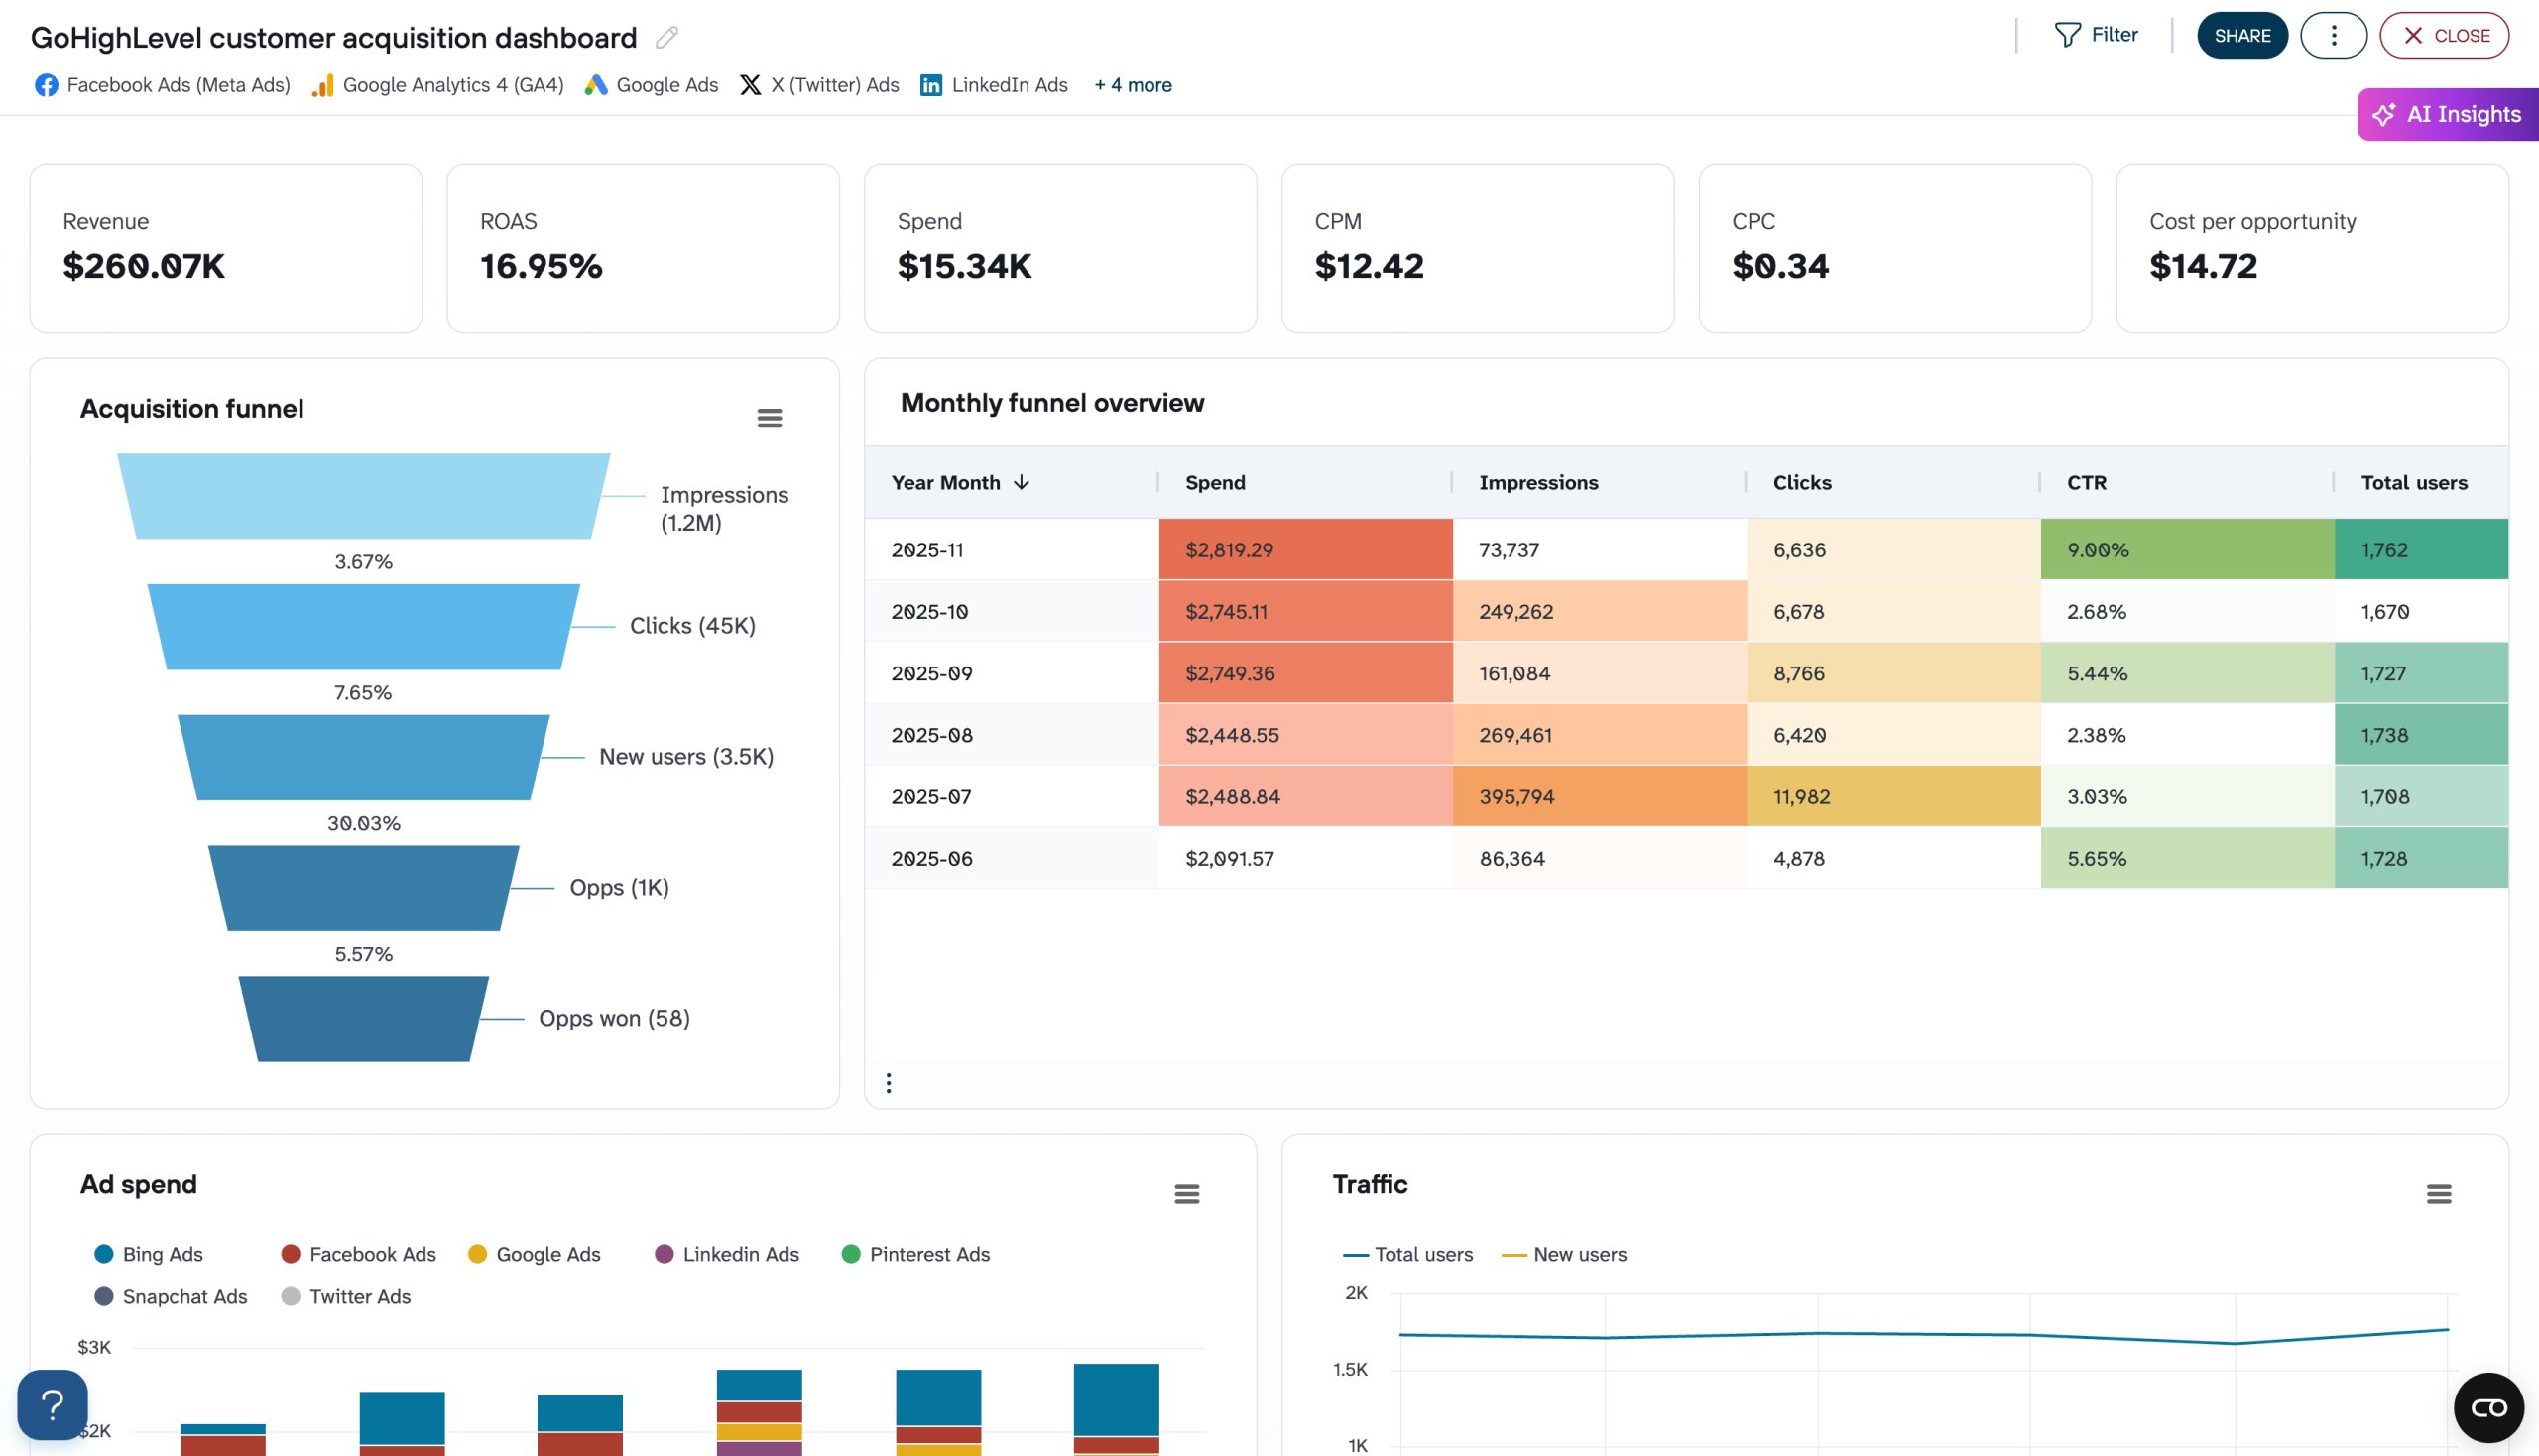
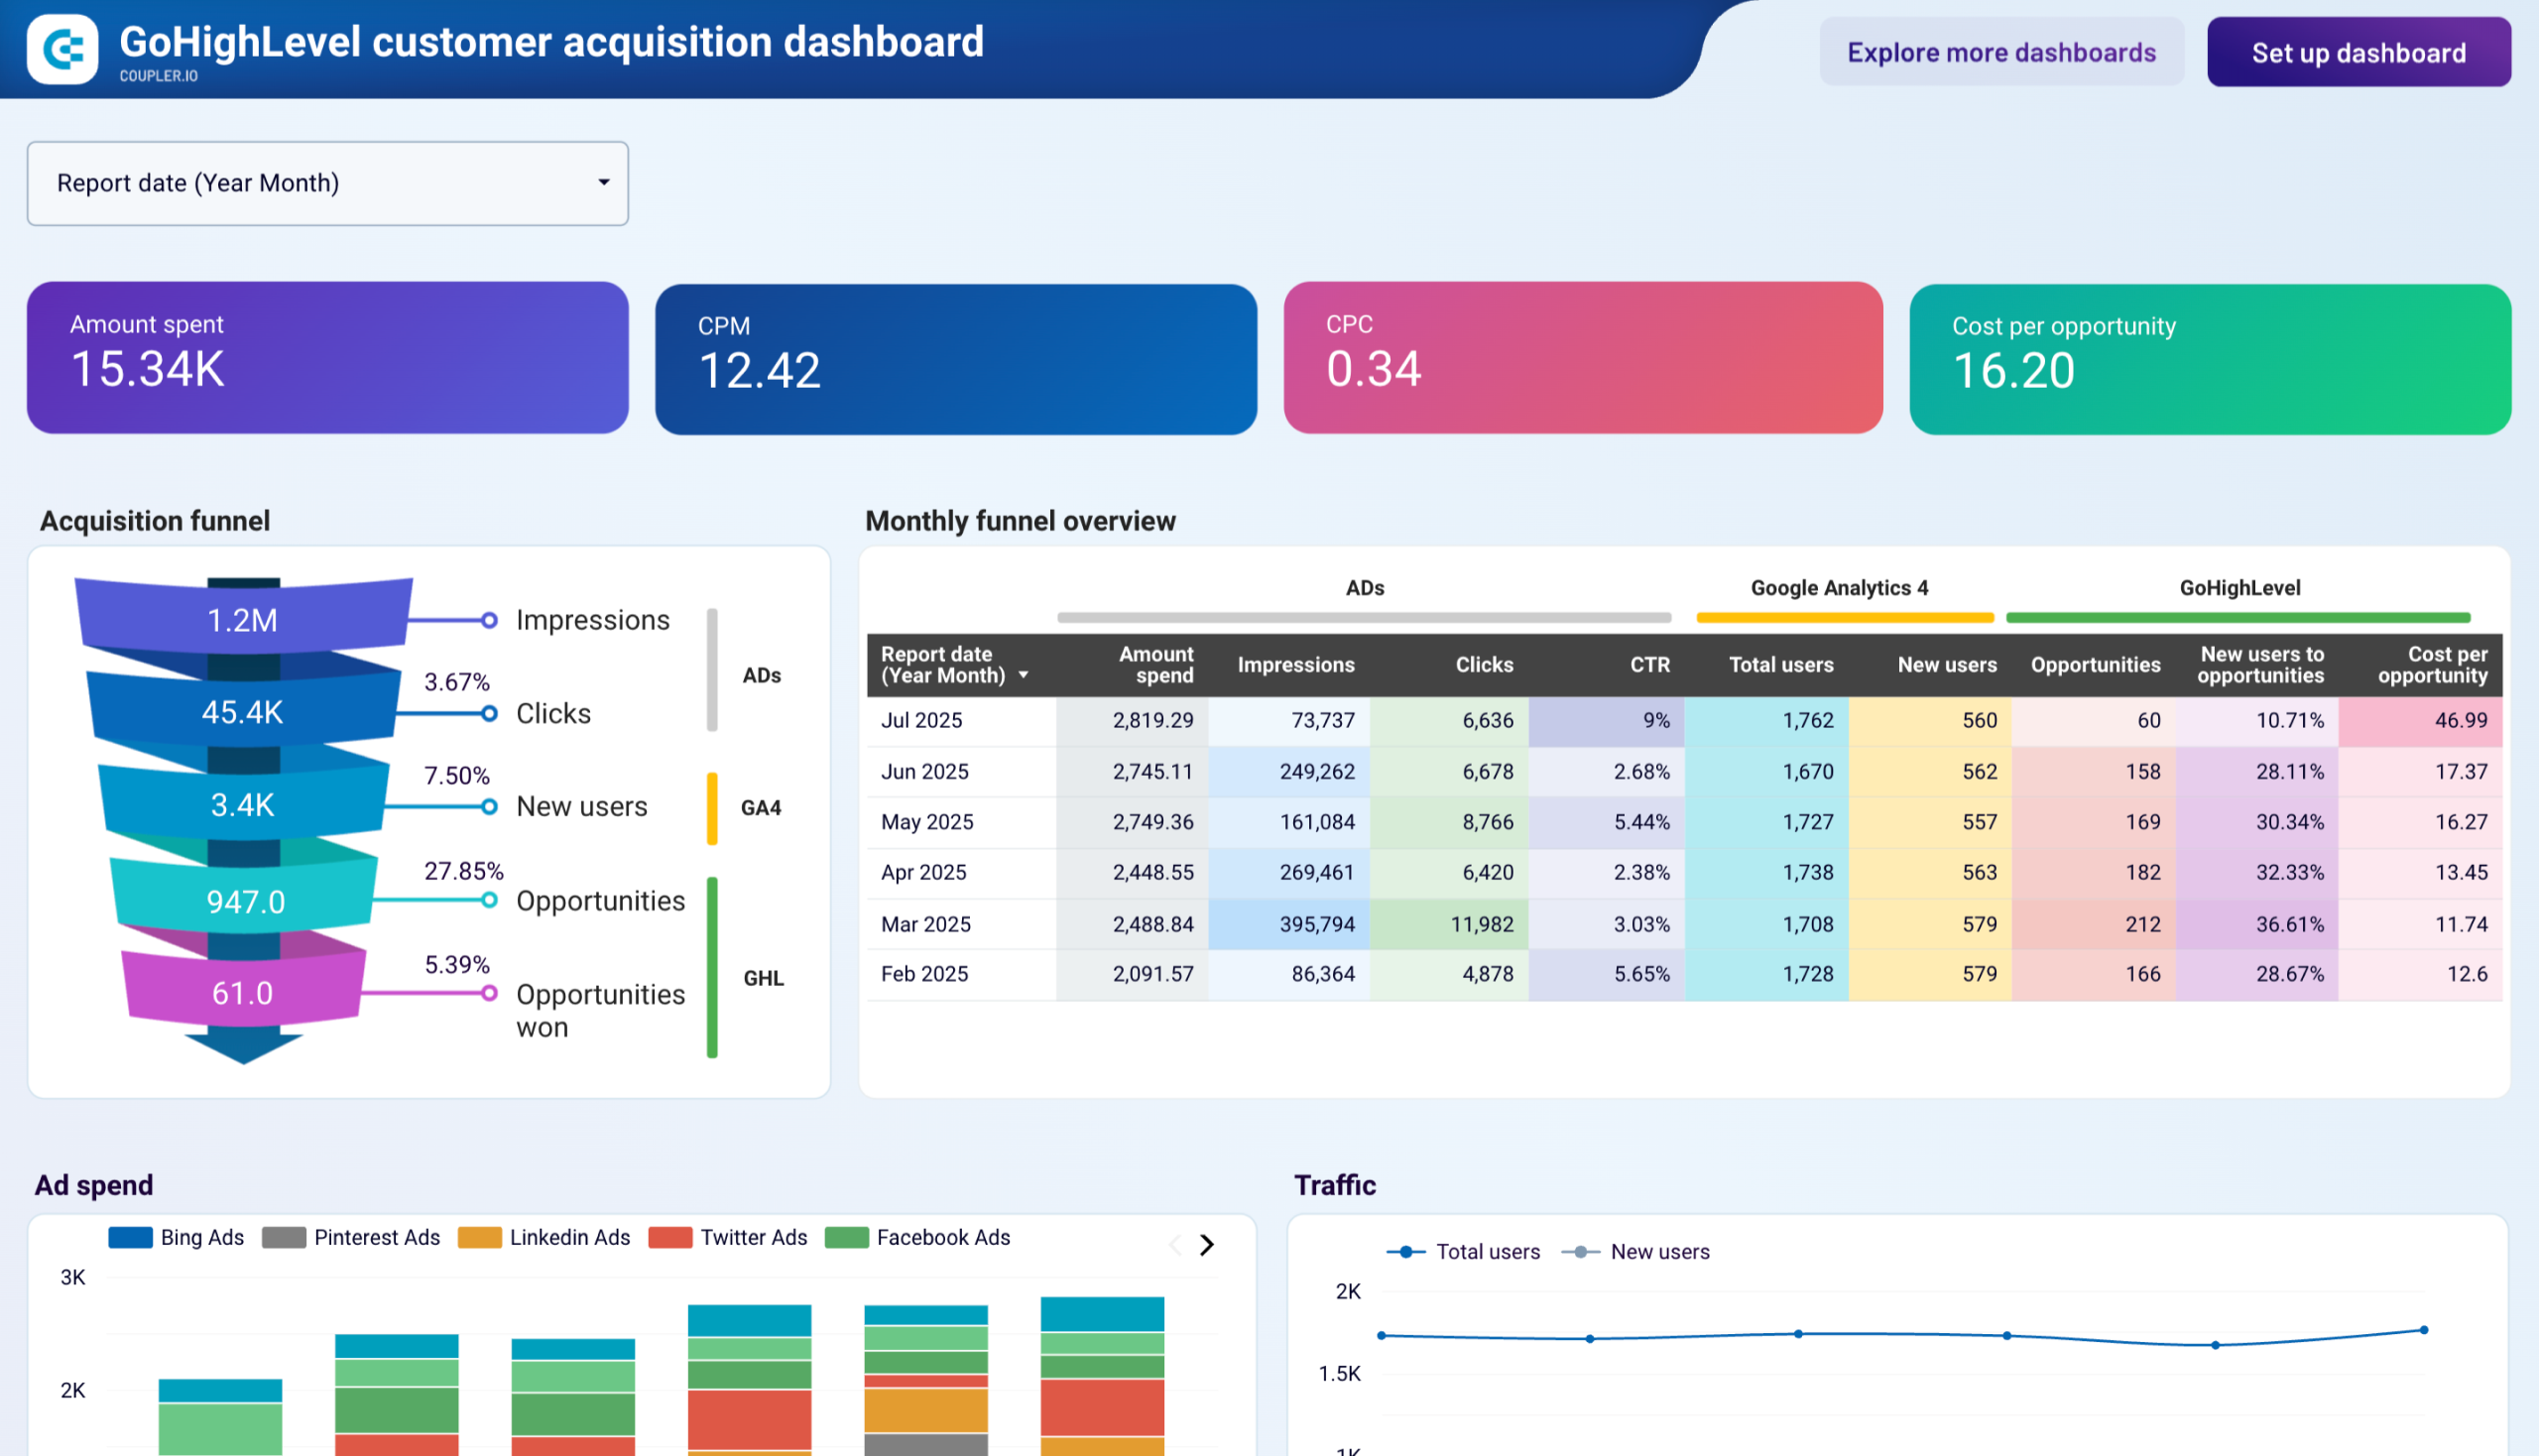
If you’re running ads on multiple platforms, then this GoHighLevel dashboard is for you. It blends data from multiple PPC platforms and Google Analytics with the GoHighLevel reporting to offer a complete funnel view of customers from “impressions” to “deals”.
In a quick view, you can analyze the effectiveness of your paid marketing campaigns through metrics like revenue, ROAS, and CPC. The report also visualizes the acquisition funnel with conversion rate at each step, so that you can identify the stages where customers drop off the most and improve it.
Further, you get a month-wise overview of funnel performance across the stages to see how it performs over time.
Customer acquisition dashboard for GoHighLevel
Customer acquisition dashboard for GoHighLevel
Preview dashboardThe ads spend traffic chart helps you understand where your budget is going over months. Side-by-side you get a traffic chart, showing the number of users over months. This allows you to easily relate user growth with your ad spend.

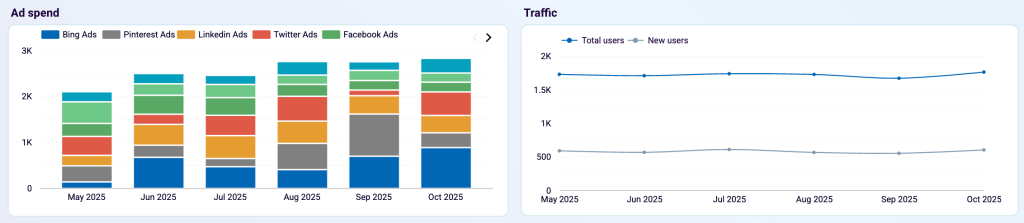
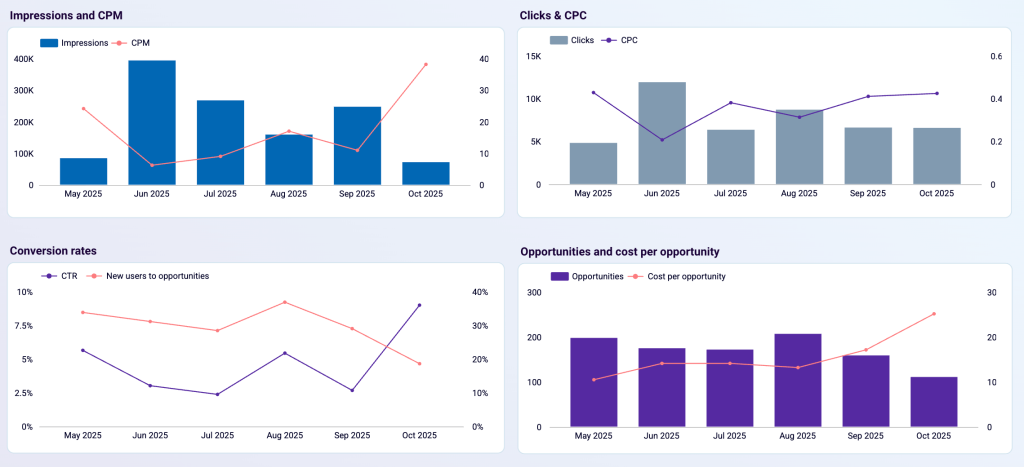
Moreover, you can drill down into monthly charts for important ad metrics related to your ads campaigns, like impressions, CPC, conversion rate, and cost per opportunity. These dynamics enable you to track the overall performance of ads over time and optimize the campaigns.

You can use this dashboard template with your data in Coupler.io or Looker Studio. Follow the instructions to set up a connector for your data sources.
Customer acquisition dashboard for GoHIghLevel
Visualize your complete lead generation funnel from advertising platforms to GoHighLevel conversions. Track ad spend across multiple channels, monitor funnel progression from impressions to opportunities, and analyze cost efficiency metrics to optimize acquisition costs and improve conversion rates throughout your marketing pipeline.
Customer acquisition dashboard for GoHighLevel in Looker Studio
Monitor your lead generation pipeline with comprehensive acquisition funnel analysis from initial contact to customer conversion to optimize lead quality and improve conversion rates.
While the automated dashboards by Coupler.io offer advanced capabilities, it’s worth understanding HighLevel’s native reporting options as well. They provide a good starting point for basic reporting needs and can inspire elements to include in your custom dashboards.
Native GHL Reports: Best for basic metrics, getting started, and quick checks within the platform.
Custom Dashboards (Coupler.io): Best for multi-source data, advanced analysis, client deliverables, and automated scheduling across multiple clients.
Types of native reports in GoHighLevel
The platform offers standard basic reports for at-a-glance analysis and custom reports for in-depth reporting, along with scheduling options.
Basic reports
Included in all GoHighLevel plans, you can find various predefined reports with basic metrics and visualizations. However, you can not perform any modifications in these reports.
To access these reports, select a sub-account, go to HighLevel dashboard > Reporting and select one of these tabs to view basic report:
- Google Ads dashboard
- Facebook Ads dashboard
- Attribution dashboard
- Call reporting dashboard
- Appointment dashboard
- Audit report dashboard
For example, here’s what the basic Google Ads report in GoHighLevel looks like:

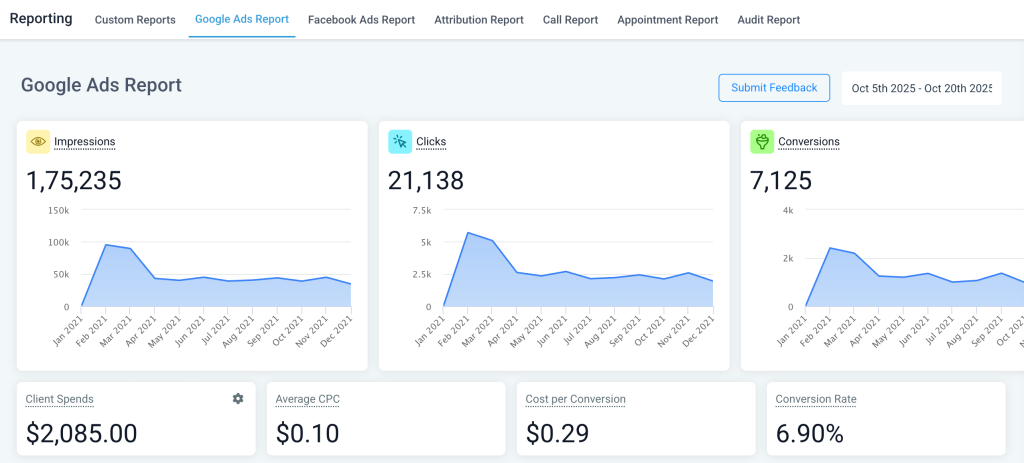
The basic reports stay within the GoHighLevel interface, meaning you can not directly share them via Emails with clients. They’ll need to access the GoHighLevel interface to access these reports.
GoHighLevel custom reports
The custom reports offer more flexibility with scheduled reports via emails to clients. This feature is helpful to deliver GoHighLevel reports on a weekly or monthly basis to clients.
It helps you create a tailored report, with full control over the metrics, visuals, content, and design.
To access GoHighLevel custom reports, go to HighLevel dashboard > Reporting and switch to the Custom Reports tab. You can create a blank report from scratch or pick from a library of report templates.

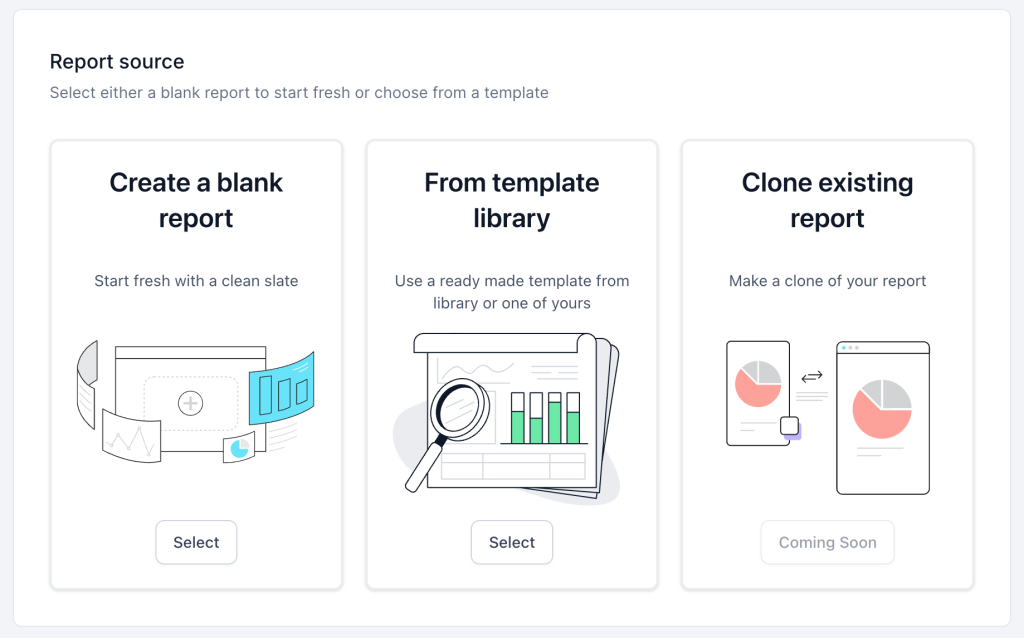
In the report editor, pick from the available widgets to add to the report and customize it as per your business needs.

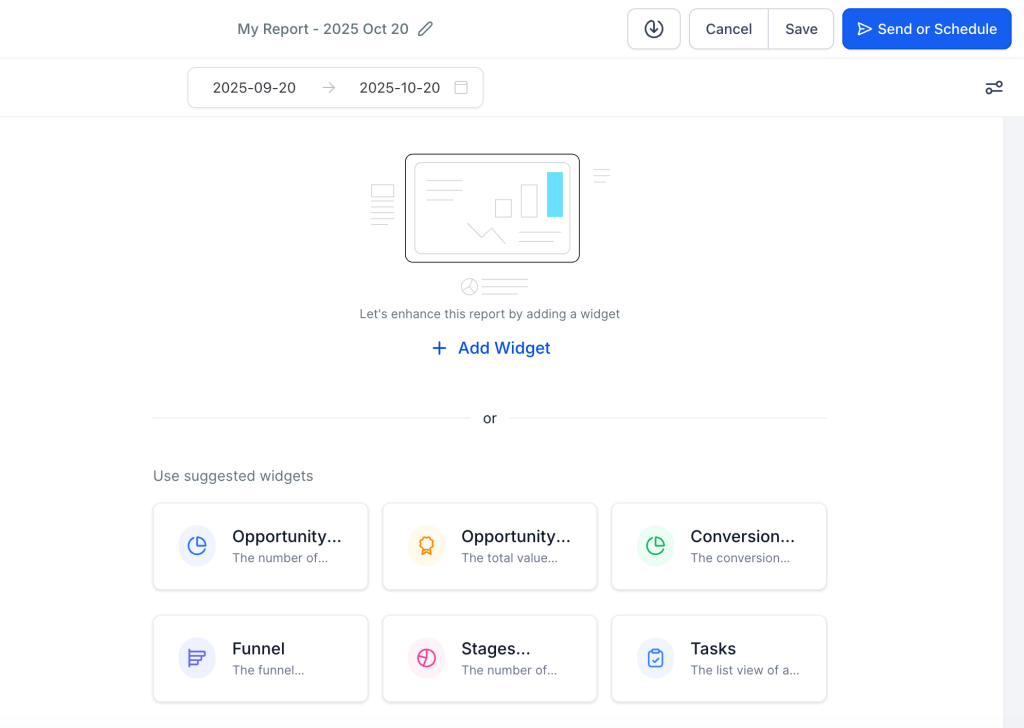
Once the report is good to go, save it and configure a schedule to deliver it automatically. You can set the interval frequency (for e.g. daily, weekly), time, date range, and other options.

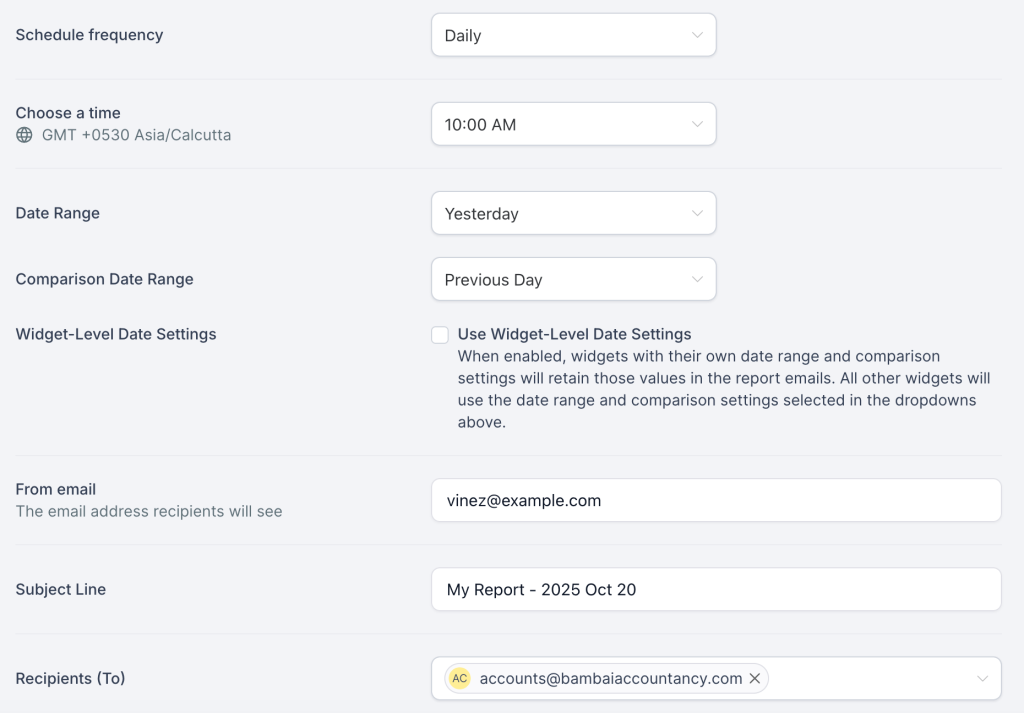
Now, this client report will be emailed to stakeholders on the set schedule automatically. This way, agency owners can free up a lot of time preparing manual reports in HighLevel.
GoHighLevel reporting powered by AI
Regular reports are good for monitoring KPIs and routine data trends. But to really understand the “what” and “why” behind those charts, you may need to manually dig, filter, and cross-reference data points, which is slow and inefficient!
That’s where AI for analyzing GHL data is helpful. Coupler.io allows you to connect your HighLevel data to AI tools like ChatGPT, Claude, and Perplexity for conversational analytics, i.e., you can ask AI questions about your data and get answers.
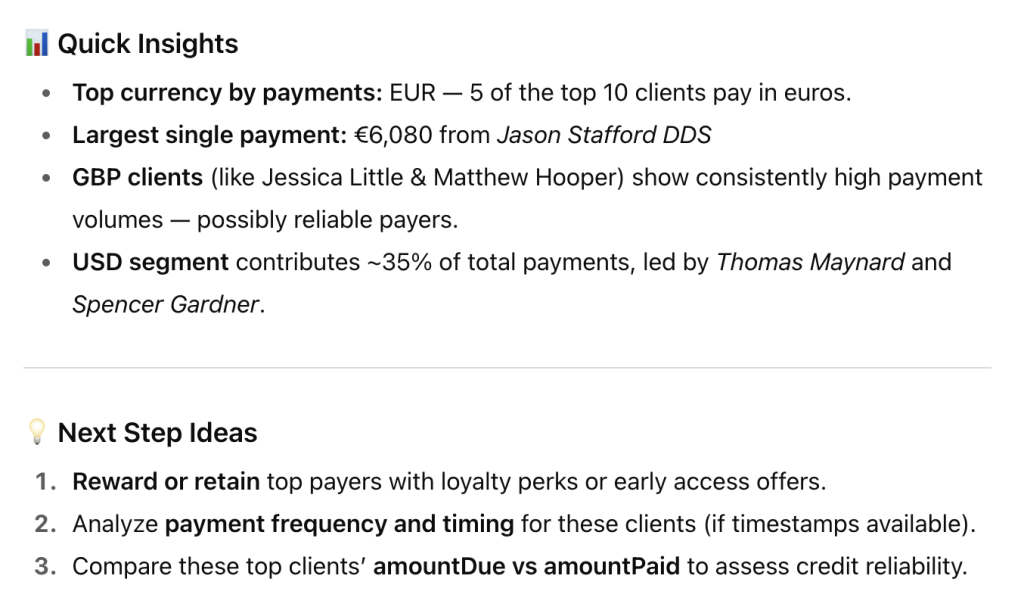
For example, I connected my GoHighLevel reporting data to ChatGPT and asked about “the top 10 clients by total payments.” It pulls the required data from the dataset and provides the required information.

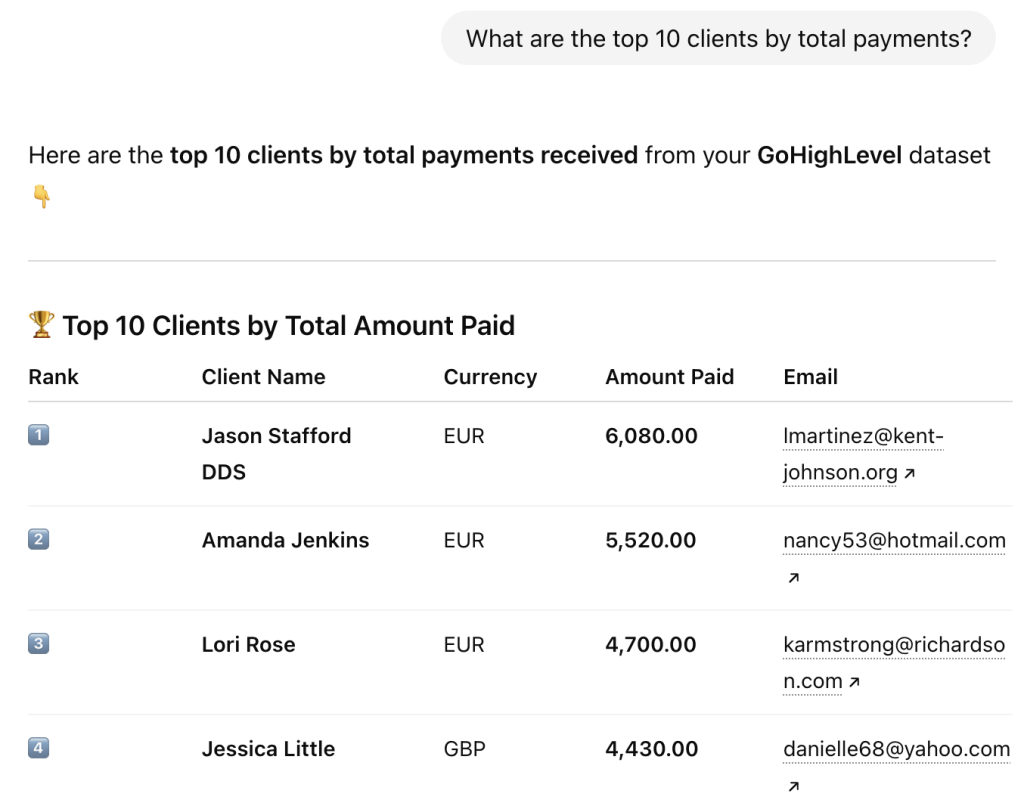
In addition to that, ChatGPT also offered me additional insights like top currencies, largest paying clients, etc., along with actionable tips for further data analysis.

You can ask follow-up questions for deeper analytics or another query to analyze multiple aspects of your business data.
Note: Instead of exposing the entire dataset, only the specific data points or summaries are shared with AI tools by Coupler.io. Therefore your business data remains private and is not used by AI models for training.
Interestingly, you can also share Coupler.io’s data flows to AI tools with your clients and amaze them with AI-powered reporting.
Talk to AI about your GoHighLevel data
Try Coupler.io for free