
Digital marketing experts would greatly benefit from a direct Google Ads to Power BI connector for their analytics. It would be so nice to automate the data flow from Google Ads to their report. However, Power BI does not let you load data directly like it does with Google Analytics, for example. So, what can you do?
Cheer up because there are at least three ways to integrate Google Ads and Power BI, and we’ll present each separately in this awesome tutorial. Read on!
Three ways to connect Google Ads to Power BI
Well, you can count on three ways or pillars to load data from Google Ads to Power BI. Each way has its pros and cons, of course, so it’s up to you to choose the one that works best for you.
Google Ads to Power BI integration by Coupler.io
If you want to get your data rapidly and seamlessly, then Coupler.io is your choice. It’s a data integration platform to automate data flows from over 400 data sources, including Google Ads, to Power BI. It does not require any technical skills to configure and can be set up in around 5 minutes.
Google Ads to BigQuery (Data transfer) to Power BI
If you feel uncomfortable with the word “third-party,” you can try another way that consists of two substeps:
- First – integrate Google Ads with BigQuery using data transfer service.
- Second – get data from a BigQuery data warehouse to Power BI using the built-in connector.
Google Ads to Power BI using API
The third option is for tech-savvy marketers since you’ll need to work with Google Ads API and write code, for example, in Python, to retrieve data and send it to some SQL database. Then, you can get data from the SQL database to Power BI using the native connector.
Have you already made up your mind on what options are best for you? Check them out in action to help you make your decision. Let’s start with the shortest way – Coupler.io.
Google Ads to Power BI integration by Coupler.io
You don’t need to be an engineer or data analyst to connect Google Ads to Power BI using Coupler.io. This data integration platform is designed to turn your raw data into meaningful reports.
To set up a Google Ads Power BI connector, click Proceed in the form below, where we’ve already preselected Google Ads as the source and Power BI as the destination. You’ll be prompted to create a Coupler.io account for free. Next, complete three steps.

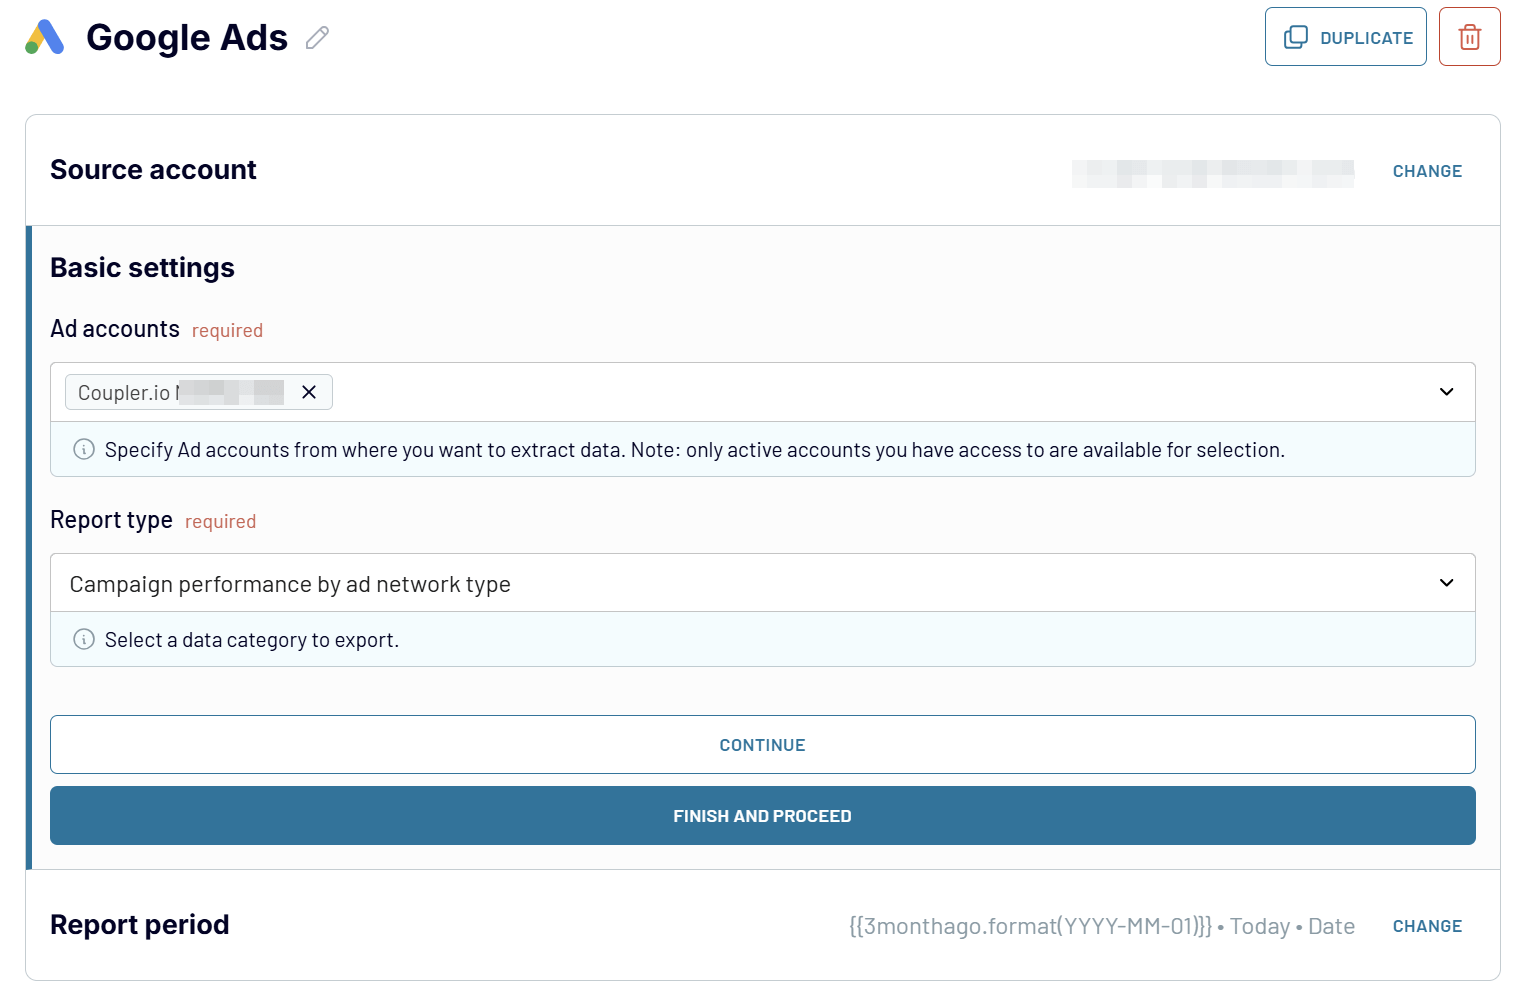
Step 1. Extract data
- Connect your Google Ads account to Coupler.io.
- Select an active ad account from where you want to extract data and choose a data category to export. Coupler.io allows you to load raw data and reports from Google Ads to Power BI. For this example, let’s choose a Campaign performance report.
- Specify the start and end date, as well as the periods to split your data. The importer already contains default preselected values. Feel free to change them if needed.

Coupler.io allows you to load data from multiple sources into one destination. This way, you can combine data from multiple Google Ads accounts or multiple ad platforms. Click Add one more source if you need this and configure the chosen source as described above.
This feature allows you to create an interactive dashboard where you can track Google Ads metrics from all your accounts. It can also be helpful for other use cases, such as creating cross-channel reports, where Google Ads data is displayed along with metrics from other ad apps.
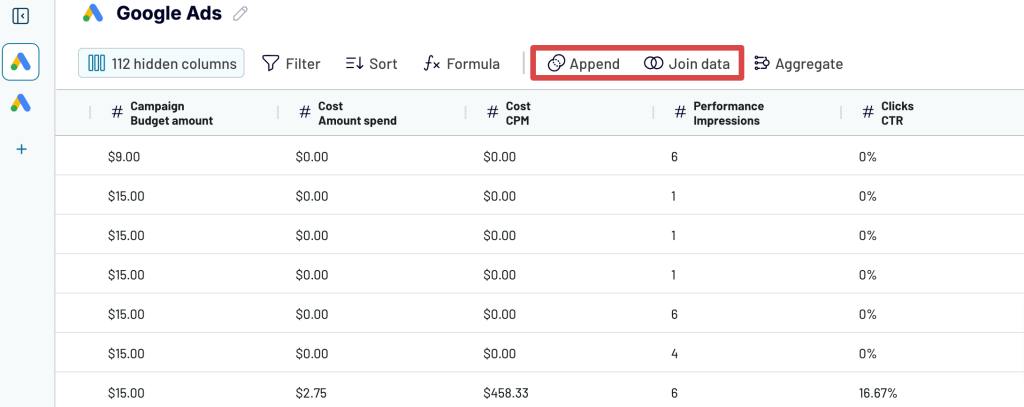
Step 2. Transform data before loading it to Power BI
Before loading Google Ads data to Power BI, you can preview and apply some transformations such as:
- Hide, rename, and reorder columns and change their data type.
- Create new columns using supported calculation formulas.
- Sort and filter data based on the selected criteria and specified values.
Here’s how the data transformation module looks in Copuler.io:

Thanks to Coupler.io’s ETL functionality, you can send an analysis-ready dataset to Power BI.
Step 3. Load data to Power BI and schedule refresh
Eventually, you can load data from Google Ads to Power BI. Follow the instructions in the wizard:
- Save and Run the importer.
This is a crucial point. Power BI will not fetch your Google Ads data if you don’t do this.
- Copy the Power BI integration URL generated in the Integration URL field.
- Open Power BI desktop. Select Get data => Web and insert the integration URL.
In a few moments, your data from Google Ads will open in the Power Query Editor.

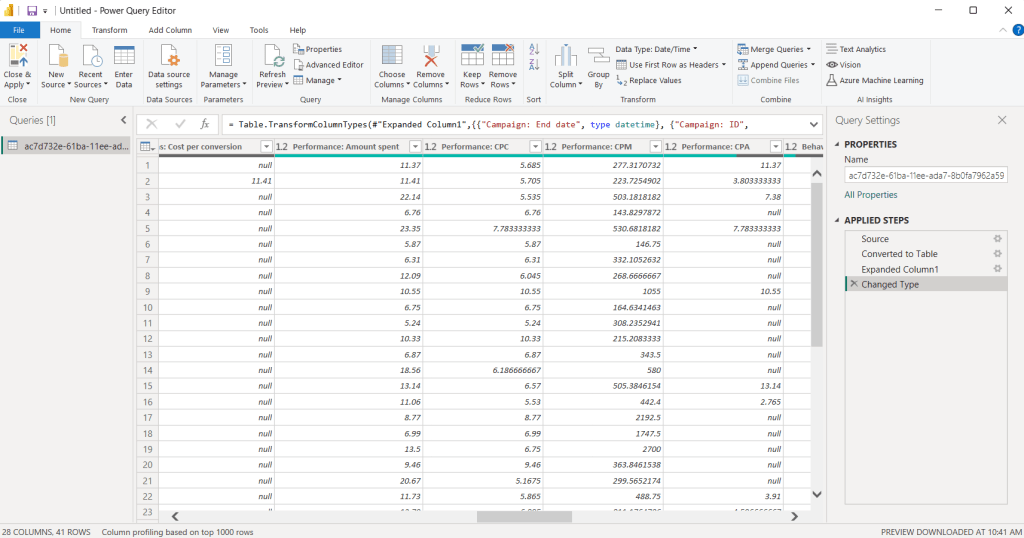
You can make any transformations on the Power BI side and then click Close & Apply to load your dataset to Power BI.
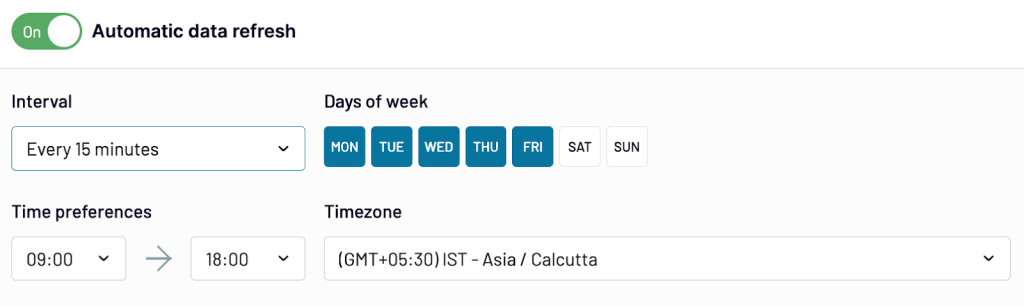
That’s not all. Let’s get back to Coupler.io and enable the Automatic data refresh. Configure the schedule to automate data flow from Google Ads to Power BI. You can have it as frequently as every 15 minutes! It’s almost real-time sync. This lets you make your Power BI reports self-updating and access real-time data.

Congrats! Your automated data pipeline is ready.
With Coupler.io, Google Ads is connected to Power BI, where you can visualize data, create actionable reports, and use Google Ads dashboards (see a sample ready-made one below) for analysis and business intelligence. All this is a great instrument for conducting data analysis and making data-driven decisions.
Pros and cons of using Coupler.io to connect Google Ads to Power BI
| Pros | Cons |
|---|---|
| – No-code integration – Automatic data refresh on a schedule – Support for other data sources and destinations | Not free. See pricing details |
Google Ads dashboard templates for enhanced reporting
Once you’ve successfully connected Google Ads to Power BI, the next step is transforming your raw data into actionable insights. Rather than building dashboards from scratch, you can leverage pre-built templates that provide proven reporting frameworks and save hours of development time. These ready-to-use solutions offer different levels of analysis depending on your specific needs and advertising strategy. Each template is powered by the Google Ads data connector by Coupler.io
Google Ads dashboard
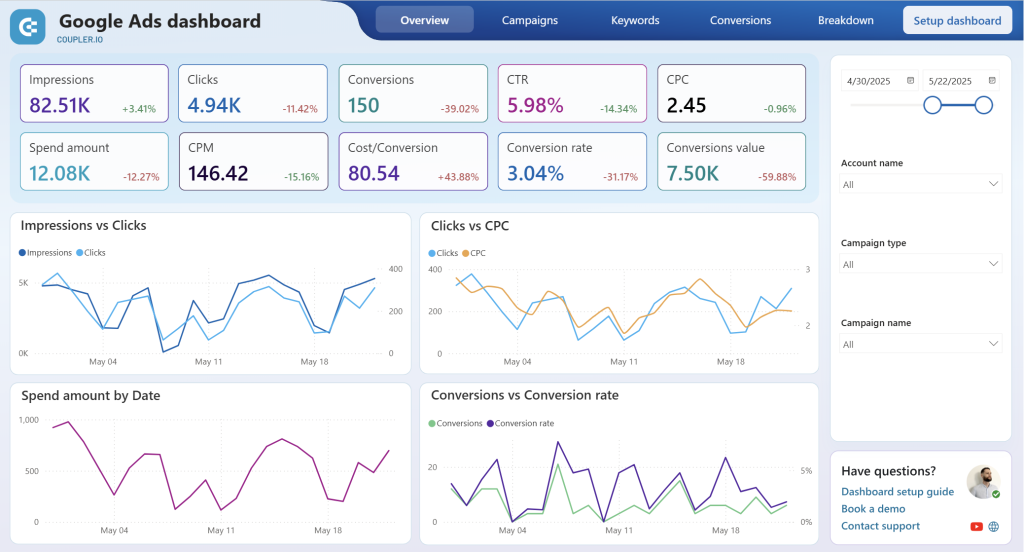
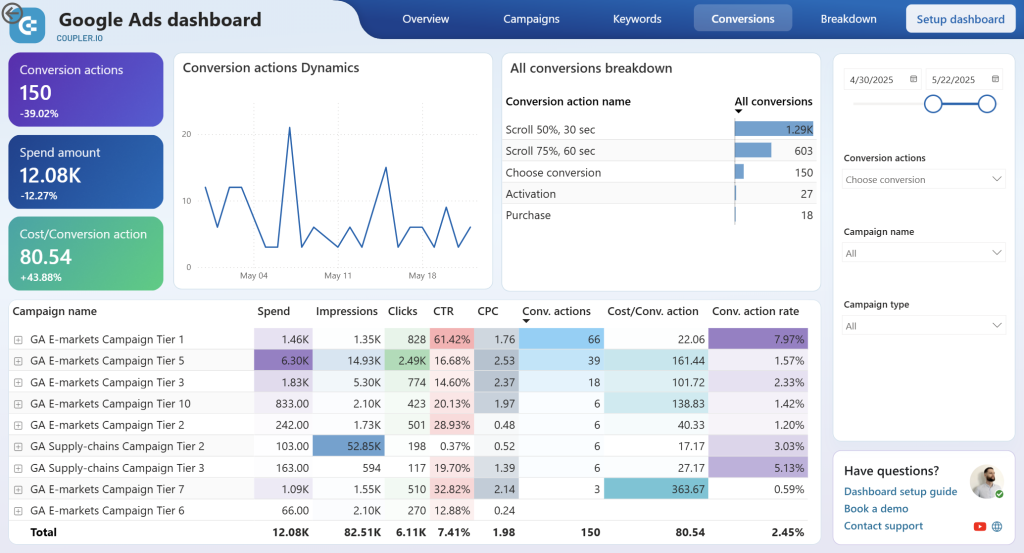
The Google Ads dashboard template is specifically designed for marketers who want deep insights into their Google Ads performance. This template provides advanced data visualization with pie charts, bar charts for demographics, and customized maps with selected dimensions and metrics.

Key features:
- Comprehensive campaign overview: Monitor all key metrics, including impressions, clicks, conversions, CTR, CPC, and spend in one unified view
- Advanced filtering capabilities: Filter by campaign type, campaign name, or specific metrics to analyze performance across different segments
- Conversion funnel analysis: Track the complete conversion path with detailed breakdown of all conversion actions you’ve established
- Demographic insights: Analyze performance by age range, gender, device type, and geographic location with easy-to-read visualizations
- Keyword performance tracking: Detailed keyword-level analysis showing impressions, clicks, CTR, CPC, and conversion metrics
- Time-based analysis: Monthly dynamics view with timeline perspective, filterable by country and time period

What you can monitor:
- Performance metrics: Track 82.51K impressions, 4.94K clicks, 150 conversions, and $12.08K spend with period-over-period comparisons
- Campaign effectiveness: Identify top-performing campaigns and analyze conversion rates across different campaign types
- Cost optimization: Monitor cost per conversion ($80.54) and conversion rates (3.04%) to optimize budget allocation
- Audience insights: Understand which demographics and locations drive the highest conversion rates
- Keyword optimization: Identify high-performing keywords and optimize bidding strategies based on performance data
The dashboard quickly answers questions about your top-performing campaigns with simple tables and provides fast hints into campaign progress through metric comparisons.
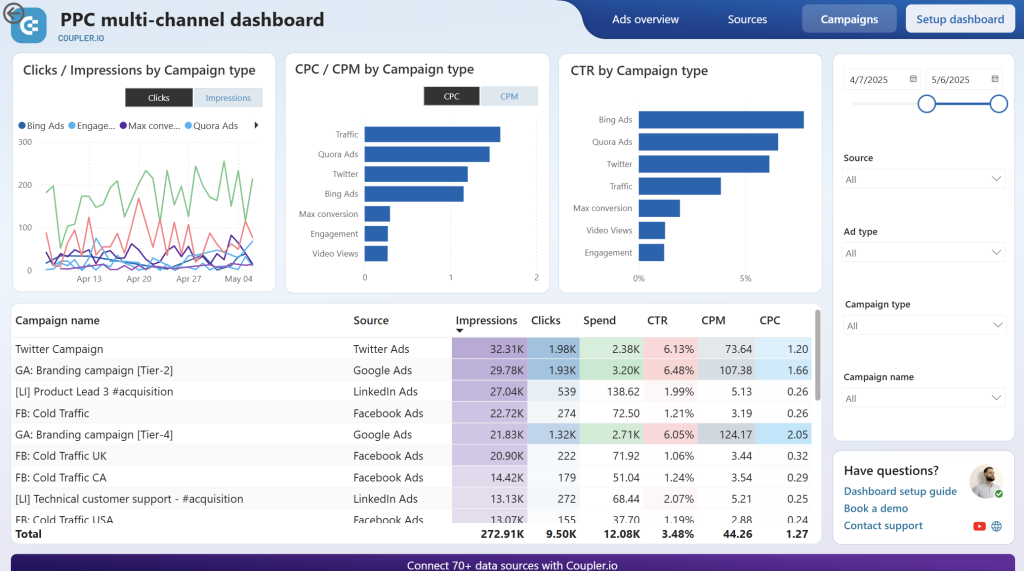
PPC multi-channel dashboard
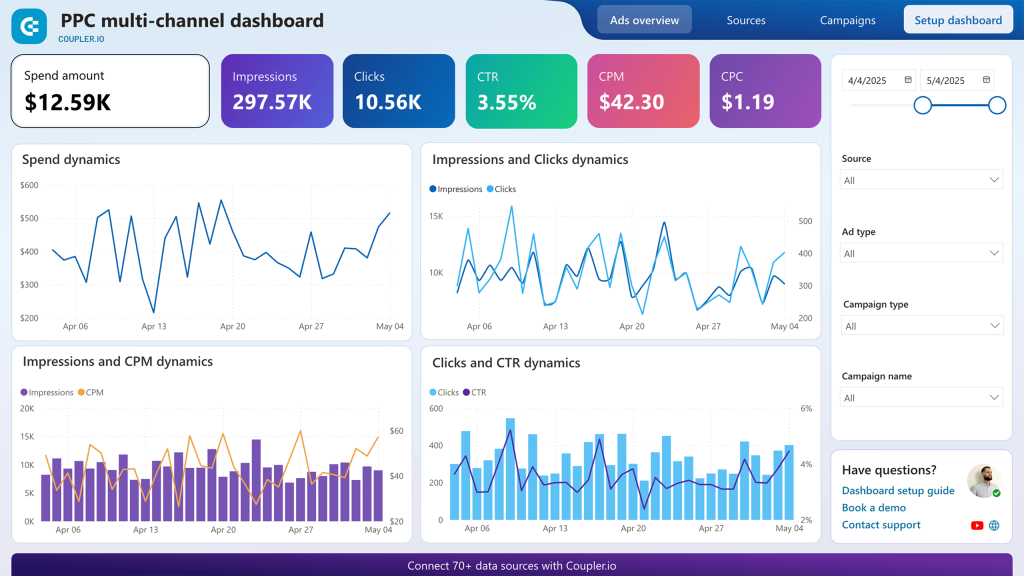
For marketers running Google Ads alongside other advertising platforms, the multi-channel PPC dashboard provides a unified view of all your paid advertising efforts. This template eliminates the need to switch between Google Ads and other platform interfaces to compare performance.

Key features:
- Cross-platform integration: Consolidates Google Ads data with Facebook Ads, LinkedIn Ads, Twitter Ads, TikTok Ads, Quora Ads, and Bing Ads
- Unified performance tracking: Compare Google Ads metrics directly against other platforms in real-time
- Budget allocation insights: Analyze spend distribution across all advertising channels to optimize ROI
- Platform comparison: Side-by-side analysis of CTR, CPC, CPM, and conversion rates across different advertising platforms

What you can monitor:
- Cross-platform performance: See how Google Ads’ performance compares to Facebook Ads, LinkedIn Ads, and other channels
- Unified spend tracking: Monitor total advertising spend across all platforms with consolidated reporting
- Channel effectiveness: Identify which platforms deliver the best ROI for your marketing budget
- Conversion comparison: Compare conversion rates and cost per conversion across all advertising platforms
This dashboard is ideal for marketers who need to justify budget allocation across multiple advertising channels and want to identify the most effective platforms for their campaigns.
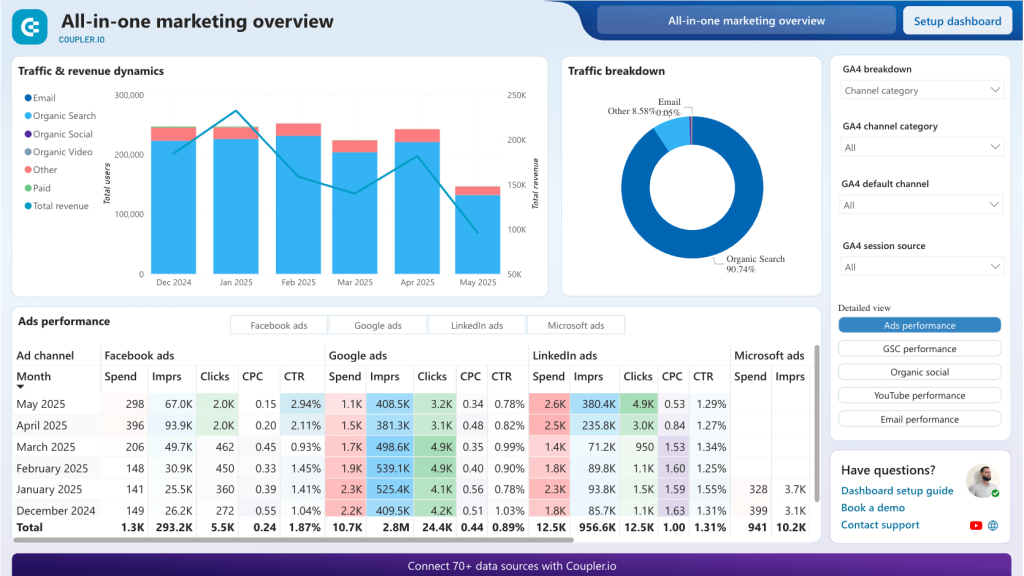
All-in-one marketing dashboard
Tired of fragmented data hindering your marketing performance? Our all-in-one marketing overview dashboard for Power BI cuts through the noise, giving you a crystal-clear view of your paid ad campaigns, Google Ads included, and beyond. It’s your single source of truth for making smarter & faster marketing decisions that drive real results.
Key features:
- Complete marketing integration: Combines Google Ads with email marketing, social media, content marketing, and web analytics
- Customer journey tracking: Follow prospects from initial Google Ads impression through the entire conversion funnel
- Marketing attribution: Understand how Google Ads contributes to overall marketing goals and revenue
- ROI analysis: Compare Google Ads performance against all other marketing investments
What you can monitor:
- Marketing channel effectiveness: Compare Google Ads performance against email marketing, social media, and other channels
- Customer acquisition cost: Analyze the total cost of acquiring customers across all marketing touchpoints
- Revenue attribution: Track how Google Ads contributes to overall business revenue and growth
- Campaign synergy: Understand how Google Ads works together with other marketing efforts
Apart from integrating data from nearly a dozen of the most popular marketing sources, this dashboard brings your Google Ads stats to the forefront, letting you quickly track crucial metrics like ad spending, impressions, clicks, cost-per-click (CPC), and click-through-rate (CTR). With the data aggregated by month, you can see how all your campaigns perform over time to make data-backed decisions about adjusting bids, refining copies, or reconsidering ad spend.
Google Analytics PPC dashboard
This dashboard consolidates data from Google Ads, Facebook Ads, LinkedIn Ads, and other platforms with website stats from Google Analytics 4. It shows you what’s actually happening with your paid campaigns — from ad clicks to website conversions — all in one place.
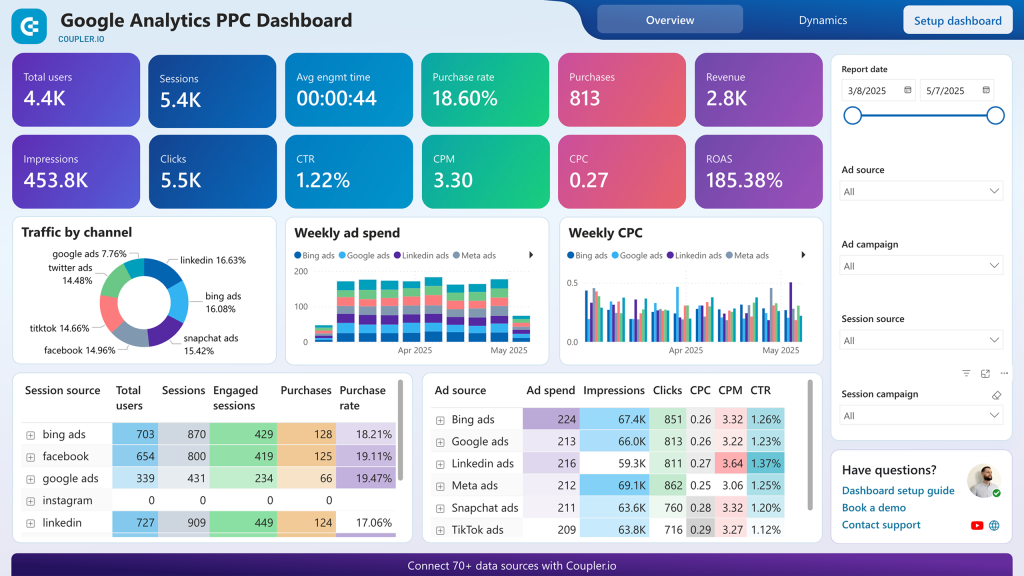
With this two-page report template, you can easily track key metrics like total users, impressions, clicks, revenue, and cost-per-click across all your ad platforms. The weekly ad spend and CPC charts also help you stay on top of budget distribution. Use the ad/session source filters or tables to pinpoint the platforms that offer the best ROI and prioritize your PPC efforts accordingly.
Key features:
- Web analytics integration: Combines Google Ads data with GA4 for comprehensive user journey analysis
- Post-click behavior tracking: Monitor what happens after users click your Google Ads
- Conversion path analysis: Track the complete journey from ad click to website conversion
- Revenue attribution: Connect Google Ads performance directly to sales and revenue data
What you can monitor:
- User behavior analysis: Understand how Google Ads visitors interact with your website
- Conversion optimization: Identify which ads drive the highest-quality traffic and conversions
- Customer lifetime value: Analyze the long-term value of customers acquired through Google Ads
- Performance attribution: See how Google Ads performance impacts overall business metrics
This dashboard provides crucial insights into campaign effectiveness beyond just click-through rates and conversions, helping you optimize for actual business results.
Each template can be customized to match your specific reporting requirements, and the automated data refresh ensures your dashboards always reflect the latest performance metrics. This eliminates manual data gathering and provides the foundation for data-driven advertising decisions that can significantly improve your campaign ROI.
Google Ads to BigQuery (Data transfer) to Power BI
Coupler.io is a good option, but you may want to check out alternative ways. Well, this one is tricky since it consists of two substeps:
- First, you need to transfer data from Google Ads to BigQuery using the Data transfer service.
- Second, you need to load data from BigQuery to Power BI using the built-in connector.
Let’s do this.
Step 1. Transfer data from Google Ads to BigQuery using the Data transfer service
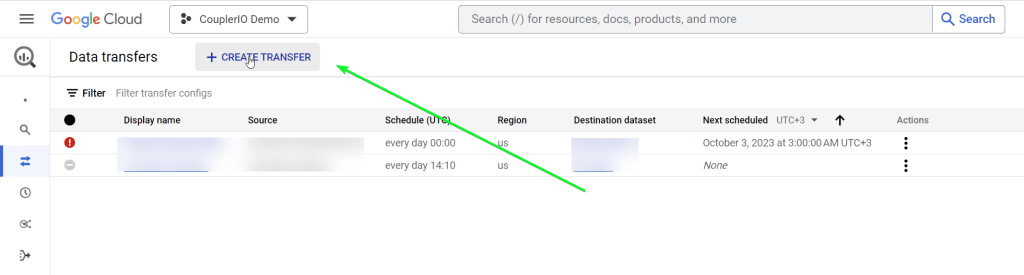
- Go to Google BigQuery Console and open Data transfers.


- Click Create Transfer. Then, choose Google Ads as a data source.

- After that, configure the transfer:
- Enter the Transfer config name – display name for the transfer configuration.
- Specify the schedule to run the data transfer.
- Enter an existing dataset name for your transfer or create a new one.
- Specify the Google Ads customer ID.
- Optionally, you can filter tables and specify the conversion date.

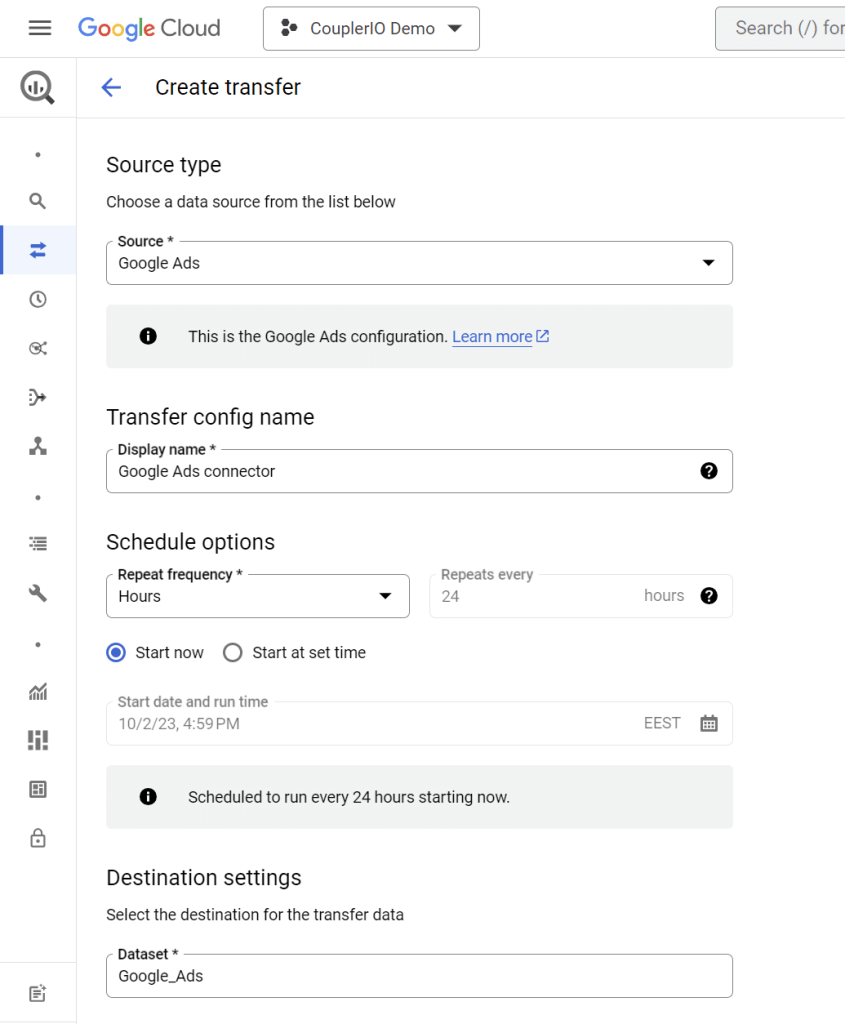
Click Save to save and run your data transfer. Here is what it looks like:

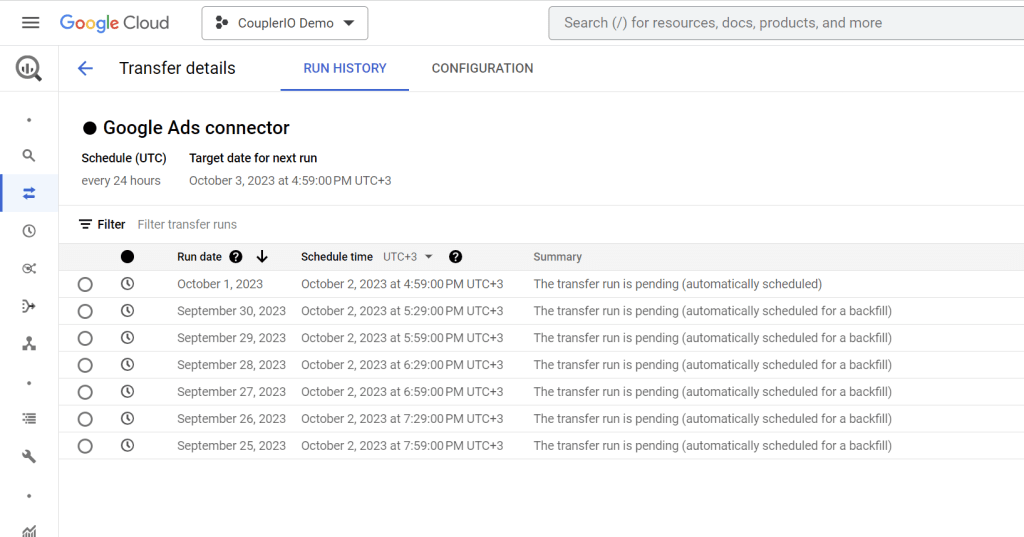
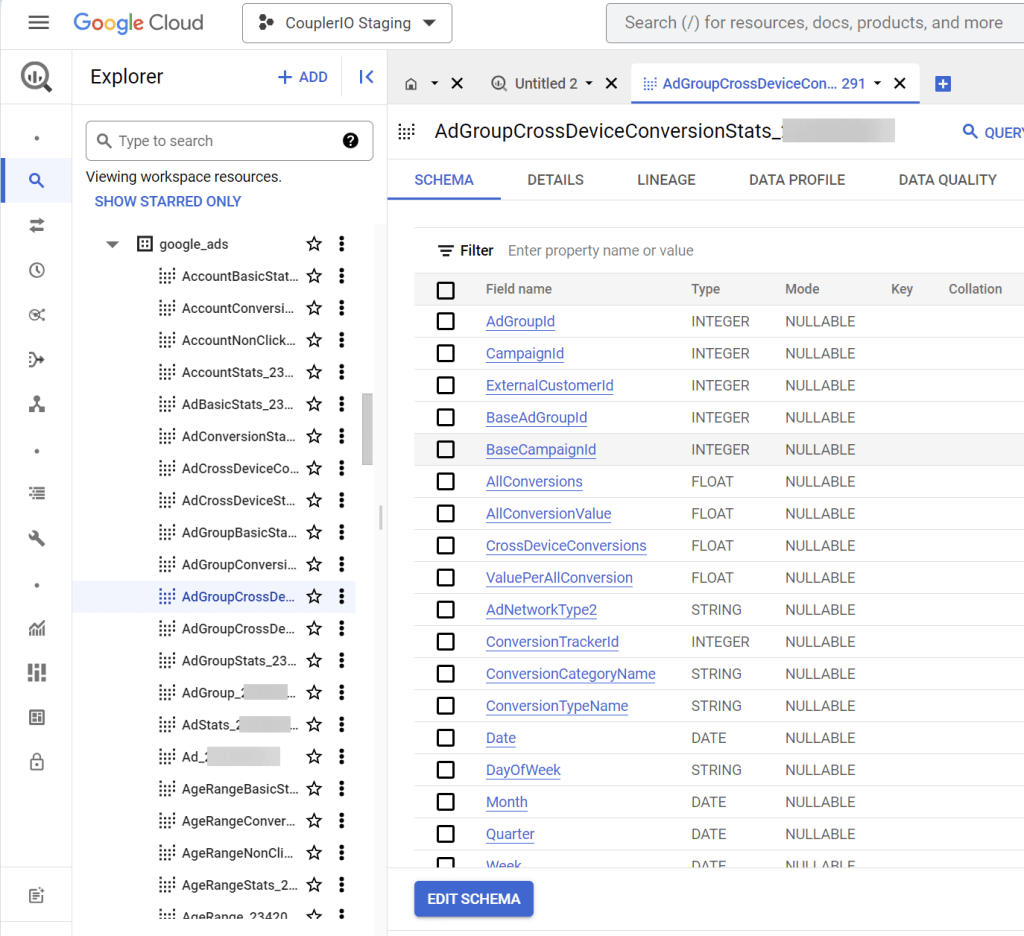
Once it’s successfully run, the tables in the specified dataset in BigQuery will be populated with data from Google Ads.

Step 2. Load data from BigQuery to Power BI
This step is simpler than the previous one since Power BI has a built-in BigQuery connector. You can learn more about importing data in our Power BI Tutorial.
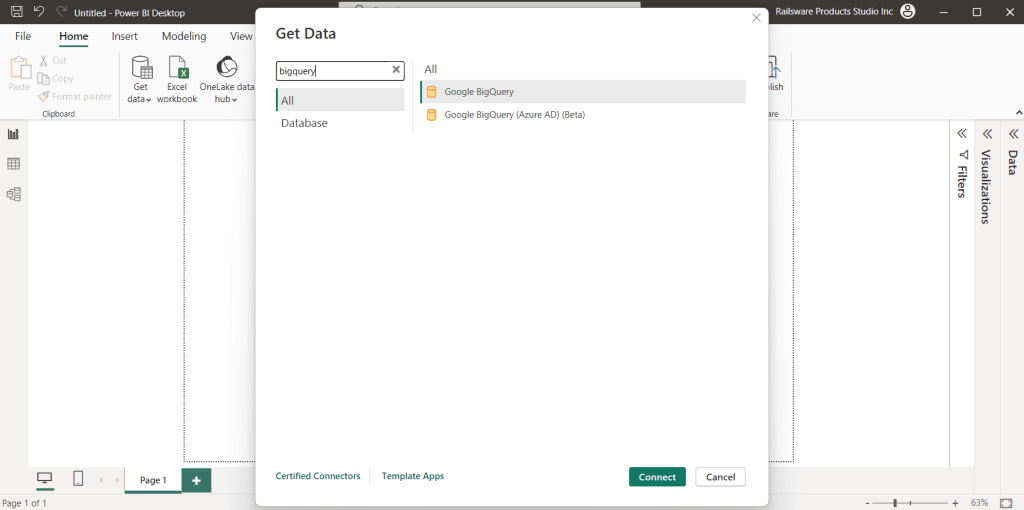
You will find it in Get data => More… = Google BigQuery.

We’ve described how to use it in our blog post about connecting Power BI to BigQuery. On a high level, the flow looks as follows:
You’ll need to connect BigQuery to Power BI. This can be done in two ways:
- Organizational account – click the Sign in button and follow the usual flow.
- Service Account Login – specify your Service Account email address and JSON key file contents.
Once the connection is established, a Navigator window appears in which you need to choose a BigQuery Project, a dataset, and a table to load data from.
The last step of the Power BI BigQuery connector setup is to click Load and choose an importing option:
- Import – to bring a copy of the selected dataset into Power BI.
- DirectQuery – to set up a live connection to this dataset.
That’s it. Your Google Ads data will be transferred to BigQuery on a schedule and, from there, it will land in Power BI. This method is not as simple as the Google Ads to Power BI connector by Coupler.io, but you can use it for data flow automation.
Pros and cons of connecting Google Ads to Power BI via BigQuery
| Pros | Cons |
|---|---|
| – Collection of Google Ads data in a structured way in Google BigQuery – Automatic data refresh | Requires technical expertise to work with BigQuery. |
Google Ads to Power BI using API
Now, the third option to connect Google Ads and Power BI – the API. Since not all marketers have deep technical expertise, most prefer to avoid such complex integration methods. Why? Because you not only need to tinker with Google Ads API but also write a code to retrieve and load data.
Here are the steps this method includes:
1. Enable the Google Ads API.
2. Create a code script to
- retrieve the data from Google Ads. You need to determine what data you want to retrieve from the API and use one of the client libraries. For example, Python, to make a script.
- send the data to an SQL database on a desired frequency.
3. Automate the script execution using a cloud tool. You can go with Google Cloud, ASW, or any other option.
Pros and cons of connecting Google Ads to Power BI via the API
| Pros | Cons |
|---|---|
| – Customized connection of Google Ads to Power BI – Automatic data refresh at a desired schedule – Google Ads data stored in an SQL databases as a backup | Requires technical expertise to understand how the API works and how to write a code script. |
Which way would you choose to connect Power BI to Google Ads?
Well, the choice is actually not as hard as it seems. Everything depends on the resources you have available. For example, if you have a data analyst or data engineer on your project, it will likely be an easy task for them to set up an integration via the API.
The second option, the one via BigQuery as a mediator, would probably suit startups and projects that need a temporary solution. It’s not a very reliable and convenient way to connect Google Ads to Power BI from a user perspective.
Coupler.io and its Google Ads to Power BI integration is a golden mean option. It can be a peace of mind solution for both marketers and data analysts. The data integration platform is a one-stop shop with automation and other features available out of the box. It allows you to easily connect Google Ads to Power BI within minutes, as well as use data connectors for other SaaS apps to build a richer data visualization.
Make your choice and let it be a smart one to increase the efficiency of your reports. If you are considering other BI tools, check our blog for articles on connecting Google Ads to Tableau and Looker Studio. I also recommend taking a look at our article on Google Ads optimization and connecting Google Ads to Redshift.
Connect Google Ads to Power BI with Coupler.io
Get started for free