
Most of you know and use Google Finance for researching investment opportunities and other finance-related things. This service lets you create your own stock portfolio and monitor it in real-time. You can also track information about securities, currency rates, and so on in one place.
Google Sheets has a dedicated formula called GOOGLEFINANCE that imports stock prices, exchange rates, and historical data directly into your spreadsheet. It’s useful but not always reliable, so this tutorial also covers a more stable alternative using the Yahoo Finance API through Coupler.io, a data integration platform and AI analytics solution.

GOOGLEFINANCE Google Sheets explained
GOOGLEFINANCE pulls data from Google Finance into Google Sheets cells using a formula. You can get real-time stock prices, historical close/open/high/low values, currency exchange rates, and mutual fund metrics. The function supports both single-value lookups (current price of a ticker) and date-range queries that return a table of historical data.
Below is the syntax breakdown, followed by formula examples you can copy into your own spreadsheet.
GOOGLEFINANCE syntax in Google Sheets
According to the Google official documentation, here is the GOOGLEFINANCE formula syntax:
=GOOGLEFINANCE("ticker-symbol", "attribute", "start-date", "end-date", "interval") "ticker-symbol"is an abbreviated name for traded securities such as stocks, shares, currency, etc. For example,"NYSE:V"is the ticker symbol for Visa Inc. on the New York Stock Exchange;"USDEUR"is the ticker symbol for the exchange rate of the currency pair US dollar to Euro.
All other parameters for the GOOGLEFINANCE function are optional:
"attribute"is the parameter to specify the type of data about"ticker-symbol"to import from Google Finance. For example, the"currency"attribute denotes the currency in which the security ("ticker-symbol") is priced. By default, GOOGLEFINANCE function returns the"price"attribute. Discover all GOOGLEFINANCE function attributes."start-date"and"end-date"represent a date span for collecting historical data. The date should be represented in the format MM/DD/YYYY, for example"12/24/2020"; or using one of the date-related functions, for example=DATE(yyyy,mm,dd). Skip these parameters to return real-time data.- Alternatively, the
end-dateparameter can be specified as the number of days from thestart-date.
- Alternatively, the
-
"interval"is the parameter to specify the granularity of the imported data. GOOGLEFINANCE function allows you to get daily data (use"Daily"or"1") or weekly data (use"Weekly"or"7"). Daily is set by default.
GOOGLE FINANCE formula examples
Take a look at this basic example of how GOOGLEFINANCE function works:
=GOOGLEFINANCE("GOOG","price","1/1/2014","12/31/2014", "DAILY")
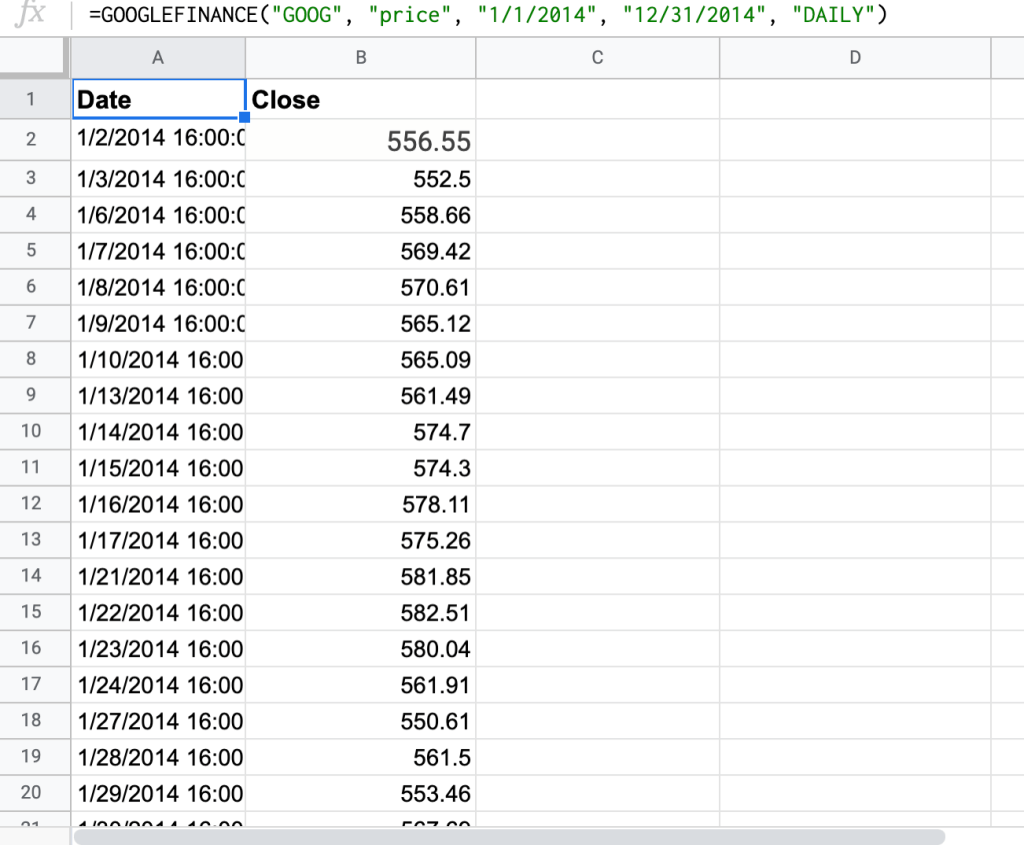
In this formula example, we use GOOGLEFINANCE to import data about the stock price of Google back in 2014.
"GOOG"is the ticker symbol"price"is the attribute"1/1/2014"is the start date"12/31/2014"is the end date"DAILY"is the interval (we can omit it in the formula)
GOOGLEFINANCE attributes you can use in Google Sheets
| Attributes for real-time data | |
|---|---|
| priceopen | The price at of market opening. |
| high | The current day’s high price. |
| low | The current day’s low price. |
| volume | The current day’s trading volume. |
| marketcap | The market capitalization of the stock. |
| tradetime | The time of the last trade. |
| datadelay | How delayed the real-time data is. |
| volumeavg | The average daily trading volume. |
| pe | The price/earnings ratio. |
| eps | The earnings per share. |
| high52 | The 52-week high price. |
| low52 | The 52-week low price. |
| change | The price change since the previous trading day’s close. |
| beta | The beta value. |
| changepct | The percentage change in price since the previous trading day’s close. |
| closeyest | The previous day’s closing price. |
| shares | The number of outstanding shares. |
| currency | The currency in which the security is priced. Currencies don’t have trading windows, so open, low, high, and volume won’t return a value for this argument. |
| Attributes for historical data | |
|---|---|
| open | The opening price for the specified date(s). |
| close | The closing price for the specified date(s). |
| high | The high price for the specified date(s). |
| low | The low price for the specified date(s). |
| volume | The volume for the specified date(s). |
| all | All of the above. |
| Attributes for mutual fund data | |
|---|---|
| closeyest | The previous day’s closing price. |
| date | The date at which the net asset value was reported. |
| returnytd | The year-to-date return. |
| netassets | The net assets. |
| change | The change in the most recently reported net asset value and the one immediately prior. |
| changepct | The percentage change in the net asset value. |
| yieldpct | The distribution yield, the sum of the prior 12 months’ income distributions (stock dividends). |
| returnday | One-day total return. |
| return1 | One-week total return. |
| return4 | Four-week total return. |
| return13 | 13 week total return. |
| return52 | 52 week (annual) total return. |
| return156 | 156 week (3 year) total return. |
| return260 | 260 week (5 year) total return. |
| incomedividend | The amount of the most recent cash distribution. |
| incomedividenddate | The date of the most recent cash distribution. |
| capitalgain | The amount of the most recent capital gain distribution. |
| morningstarrating | The Morningstar “star” rating. |
| expenseratio | The fund’s expense ratio. |
Now let’s check out the power of GOOGLEFINANCE through other real-life examples.


Track stock prices without formulas with Coupler.io
Book a demoTutorial on how to use GOOGLEFINANCE function in Google Sheets
How to track stocks using the GOOGLE FINANCE formula
Stocks represent a part of the company’s ownership and are traded on a stock exchange such as NASDAQ or through brokers. People buy stocks for several purposes: trading, getting dividend income, etc. To assess your stock easily and observe its changes, GOOGLEFINANCE function takes your stock data directly from Google Finance to your Google Sheets.
First, you will need to get the ticker symbols of the companies you are interested in to get your current stock value or price. You can either Google it (for example, “Meta ticker“) or use a tool such as Yahoo Finance. For example, you want to import the stock price or value of Meta Platforms Inc. traded on NASDAQ. The ticker symbol for Meta is "META"; for NASDAQ, it will read "NASDAQ:META".
Meta Platforms was previously listed under the ticker "FB" until June 2022. If you find older examples or resources using "NASDAQ:FB", that ticker no longer works. Use "META" or "NASDAQ:META" instead.
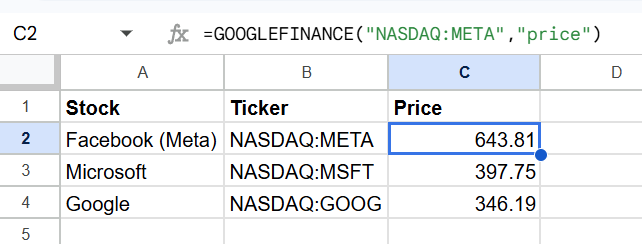
Type "NASDAQ:META" in the formula along with "price" as the attribute. Here is how your GOOGLE FINANCE formula should look:
=GOOGLEFINANCE("NASDAQ: META","price")

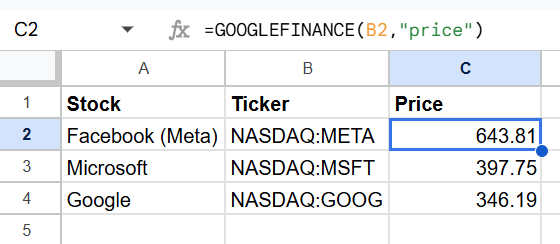
Alternatively, it is possible to reference cells in your argument. The formula with our ticker symbol in cell B2 looks like this:
=GOOGLEFINANCE(B2, "price")

How to use GOOGLEFINANCE function to get historical data about stocks
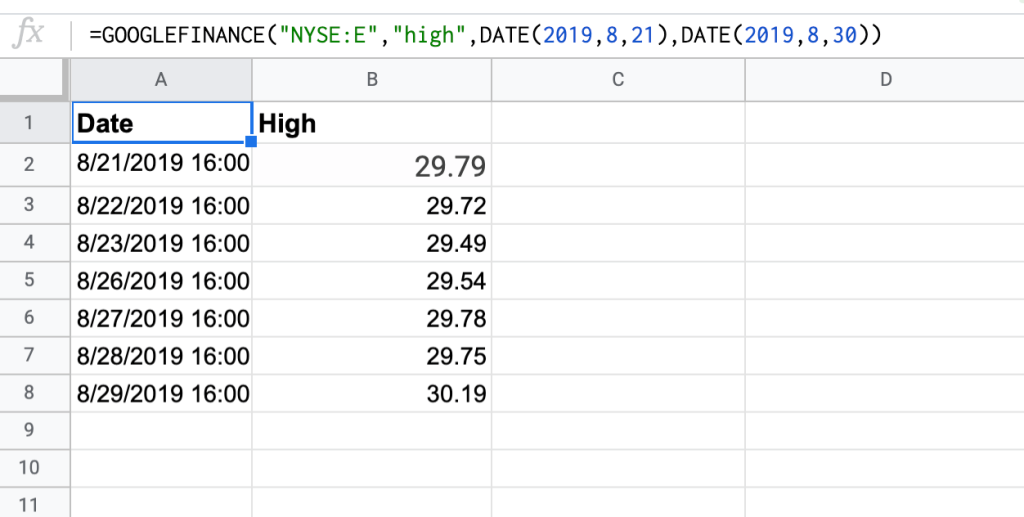
You may need to acquire historical stock data to examine the company’s history, anticipate future events, etc. Let’s import historical stock data about Eni S.p.A., an Italian multinational oil and gas company. It’s ticker symbol is "NYSE:E"; "high" is the argument for the high price for the specified date span. Here is the GOOGLEFINANCE formula:
=GOOGLEFINANCE("NYSE:E","high",DATE(2019,8,21),DATE(2019,8,30))
Use GOOGLEFINANCE function to work with currency
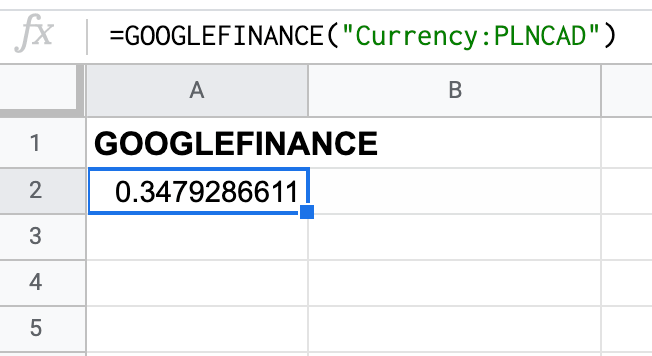
It is quite easy to access the current exchange rate in your sheets using the GOOGLE FINANCE formula. For example, we need to import the rate of the currency pair PLN to CAD. Here is the GOOGLE FINANCE formula:
=GOOGLEFINANCE ("Currency:PLNCAD")

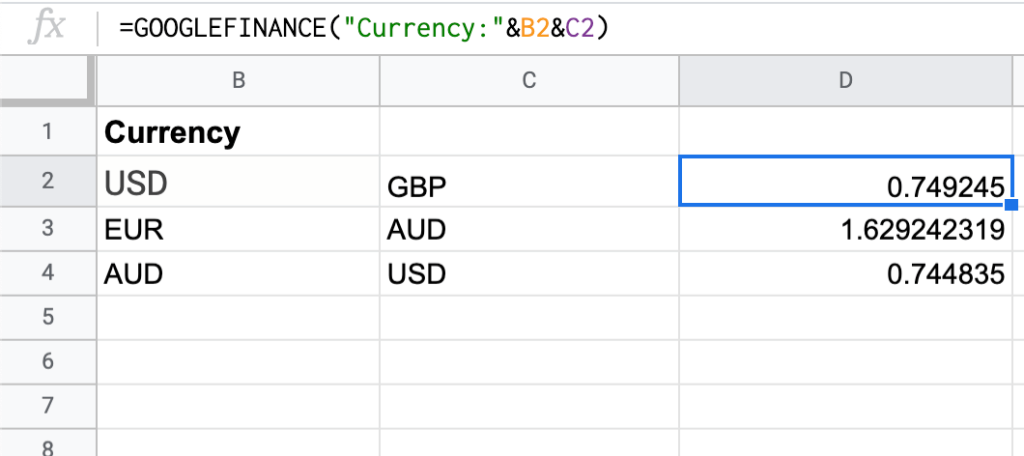
An alternate method of doing this is by using the cell of your argument. Here is the formula to get the USD to GBP currency rate:
=GOOGLEFINANCE ("Currency:"&B2&C2)

Get currency exchange value with GOOGLEFINANCE
Importing a pure currency rate is not as convenient as converting the value from one currency to another right away. With Google Sheets and GOOGLEFINANCE function, you can easily build a currency converter. All you need to do is import the exchange rate and multiply it by the value to convert.

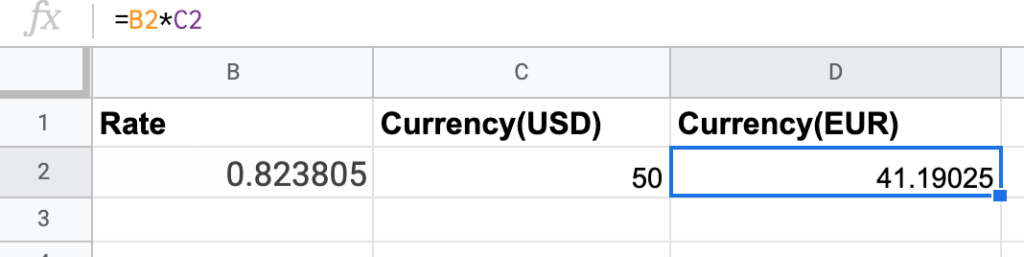
In this example, B2 cell contains the formula:
=GOOGLEFINANCE ("Currency:EURUSD")
D2 cell contains the formula, which multiplies the exchange rate returned to B2 and the value to convert from C2:
=B2*C2
Import historical currency exchange rates with GOOGLEFINANCE
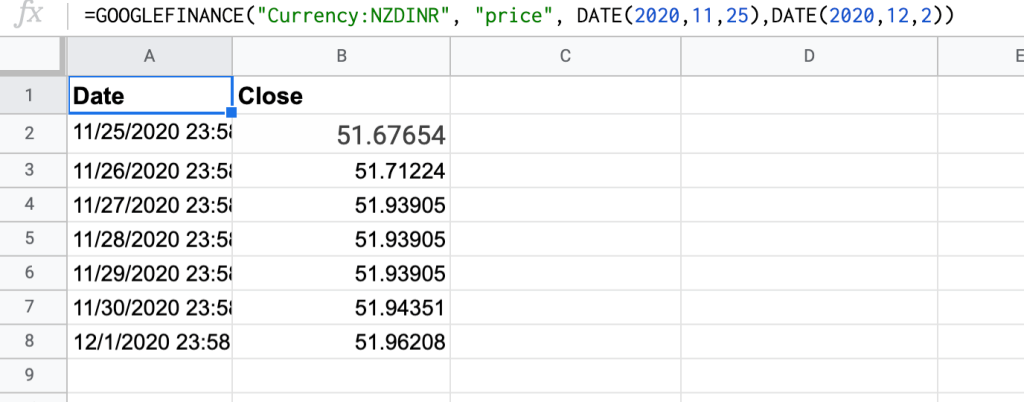
Historical currency exchange rates give us information on how currencies have behaved in the past. For example, let’s import the historical exchange rate for the currency pair New Zealand Dollar to Indian Rupee (NZDINR). The GOOGLE FINANCE formula is
=GOOGLEFINANCE("Currency:NZDINR", "price", DATE(2020,11,25), DATE(2020,12,2))

How often does the GOOGLEFINANCE function update in Google Sheets?
Most of us use GOOGLEFINANCE for real-time data. So, we need to know how fast it can do the job.
GOOGLEFINANCE can have a delay of up to 20 minutes, and you will need to manually open your spreadsheet before an update can happen. The spreadsheet will fetch only the values saved the last time the spreadsheet was opened.
GOOGLE FINANCE not working – what are the reasons?
The GOOGLEFINANCE function has some limitations, and it’s not always reliable. There is no guarantee that too many GOOGLEFINANCE formulas won’t return an #N/A error at some point. The data you can get using the GOOGLEFINANCE function is not for financial industry professional use.
Another reason for the #N/A error is the attempt to retrieve historical data from Google Finance via the Sheets API or Apps Script. Why? Google Finance API is no longer supported and is not documented.
How to avoid the GOOGLE FINANCE internal error?
You can’t fix the internal error of your GOOGLEFINANCE formula, but you can use a more reliable alternative. Coupler.io has a dedicated Yahoo Finance connector that pulls stock price data directly into Google Sheets (and other destinations) on a schedule, with no API configuration. Once the data is in a structured destination, you can also run it through AI tools to analyze price movements or compare tickers without writing formulas by hand.
How to retrieve data from Yahoo Finance API without coding
Coupler.io is a data integration platform and AI analytics solution that connects 400+ sources to spreadsheets, BI tools, data warehouses, and AI tools. There are ready-to-use integrations like HubSpot to Excel. For Yahoo Finance, there are two ways to pull data depending on what you need:
- Yahoo Finance Price connector — a dedicated, pre-built integration for stock price data. No API setup. You enter tickers, pick an interval, and the data flows on a schedule. This covers most use cases.
- JSON connector — a flexible connector for querying the Yahoo Finance API directly. Use this when you need data the Price connector doesn’t cover: financial statements, earnings history, insider transactions, institutional ownership, and more.
Both methods allow you to automate data load from Yahoo Finance API to Google Sheets, Excel, BI tools, data warehouses, and even AI tools within a single data flow.
Export Yahoo Finance price data with the dedicated connector
The Yahoo Finance Price connector is the fastest way to get stock price data into Google Sheets or any other destination. It does not require you to configure JSON URLs, query strings, HTTP methods, and other parameters. Try it right away for free with no credit card required using the form below. Feel free to change the destination app if needed.

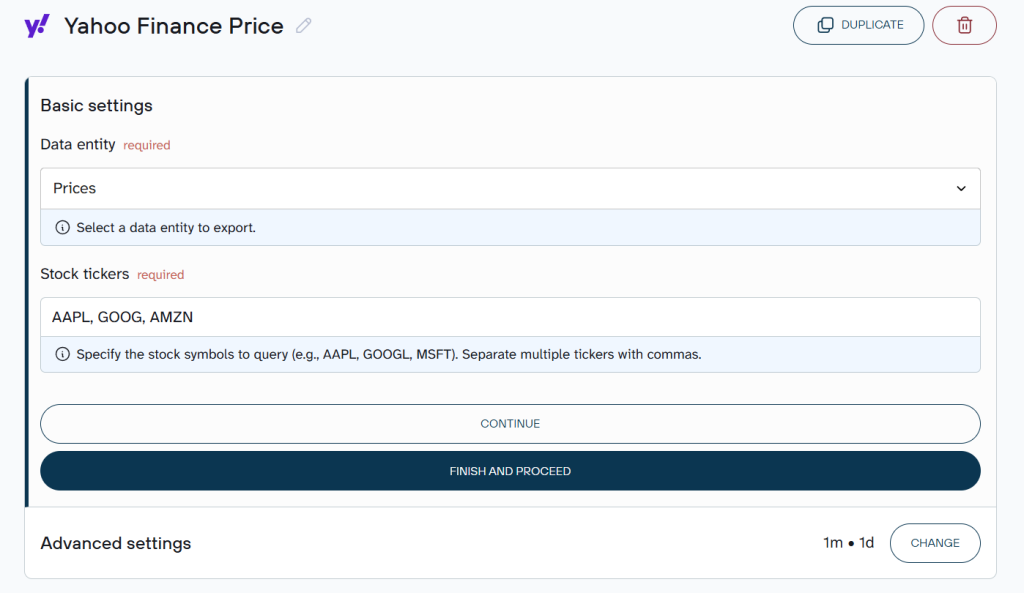
1. Collect data
Configure the basic settings:
- Data entity — select “Prices”
- Stock tickers — enter the stock symbols you want to track, separated by commas (e.g., AAPL, GOOGL, MSFT, META)
Then set the advanced options:
- Price interval — the time interval between data points (e.g., 1d for daily, 1h for hourly)
- Date range — the historical period to pull (e.g., 1y for one year, 6mo for six months)

2. Transform data
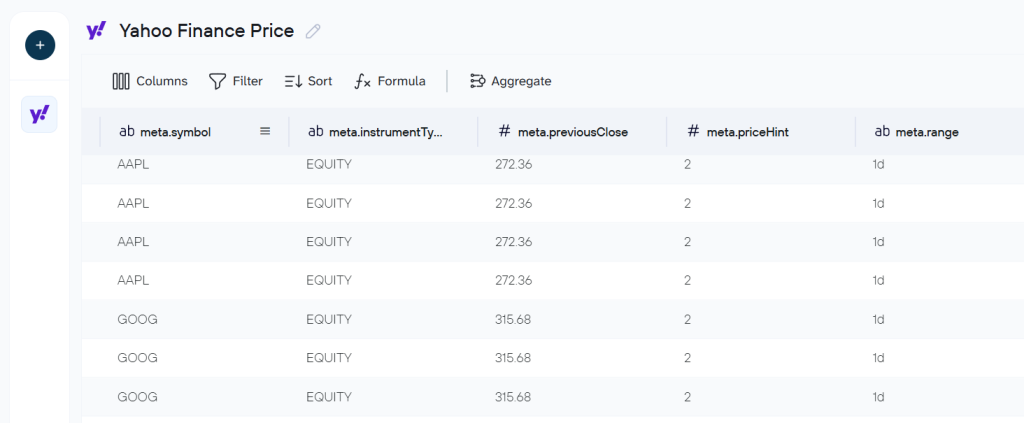
Preview the incoming data and adjust it before it reaches your destination. You can filter rows, hide columns you don’t need, rename fields, add custom formulas, or aggregate values.

3. Load data and schedule refresh
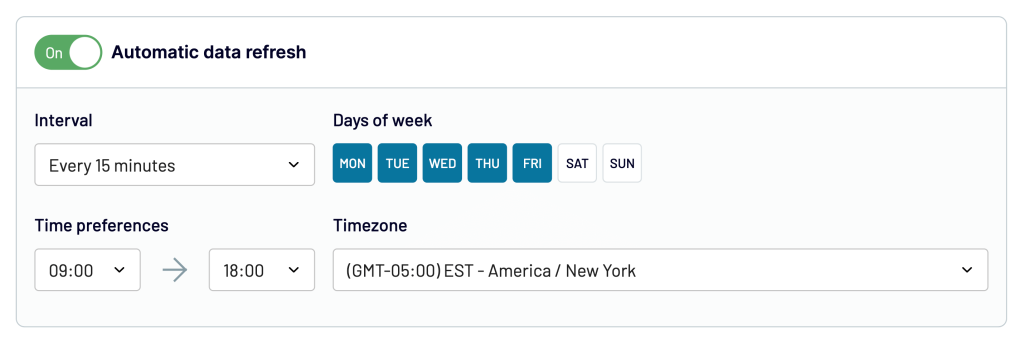
Follow the in-app instructions to load Yahoo Finance data to the chosen destination. To automate data refresh on a schedule, toggle on the respective function and set a schedule so the data stays up-to-date without manual re-exports.

You can send the same Yahoo Finance data to multiple destinations within a single data flow: Google Sheets for a tracker, BigQuery for historical analysis, and an AI tool for conversational queries, all from the same setup. Once the data flow is running, AI Agent lets you ask questions about your price data in plain English directly inside Coupler.io. The Analytical Engine handles the calculations and passes confirmed numbers to AI, so you can ask things like “which ticker had the largest drawdown over the past 90 days” or “compare AAPL vs. MSFT daily closing price volatility this quarter” without building formulas. If you prefer Claude, ChatGPT, or another external AI tool, AI Integrations connect the same data flow to those tools through Coupler.io’s MCP server.
Get Yahoo Finance data for reporting and AI analysis
Try Coupler.io for freeExport other Yahoo Finance data with the JSON Client
The Price connector covers stock prices, but Yahoo Finance has much more: financial statements, earnings history, balance sheets, cash flow data, insider transactions, institutional ownership, and recommendation trends. For any of that, use Coupler.io’s JSON Client to query the Yahoo Finance API directly.
Yahoo Finance API was shut down in 2017, but sometime in 2019, its unofficial API came out. With it, you can query:
- Finance summaries
- Stocks
- Quotes
- Movers
- and more free stock market data.
I’ve already preselected the source and destination apps: JSON and Google Sheets, respectively. Just click Proceed to sign up for free and create an API importer.
After that, you’ll need to complete the following steps:
1. Collect data
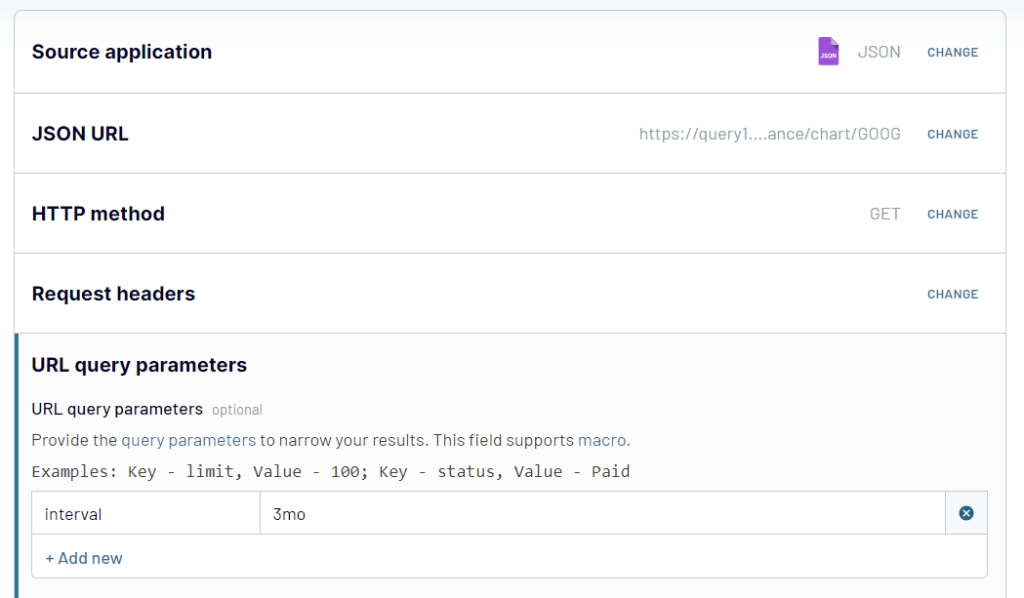
- JSON URL – insert the JSON URL to import data from and click Continue.
JSON URL for historical data about prices, splits and dividends:
https://query1.finance.yahoo.com/v8/finance/chart/{ticker}
- HTTP method – use GET as the HTTP method.
- URL query string – depending on the data you want to retrieve, the query string will differ. For example, here is the string to specify the time interval
interval: 3mo

Check out all data query options.
Proceed to the Transform data step.
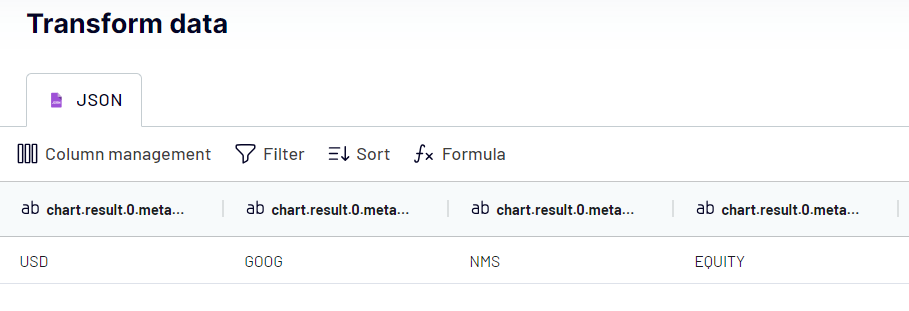
2. Transform data
Same as the Price connector: preview, filter, rename, aggregate. The Transform step works identically regardless of which source you used.

3. Load data and schedule refresh
Select your destination and schedule. The same multi-destination and AI capabilities apply here: you can load financial statement data into BigQuery for SQL analysis, into Google Sheets for a report, and into an AI tool to ask questions about earnings trends or balance sheet changes over time.
Coupler.io also connects to other financial APIs, including Alpha Vantage and IEX. Check out how I built a currency tracker in Google Sheets using a similar setup.
Data entities and parameters to use for importing data from Yahoo Finance
Historical data about prices, splits and dividends
JSON URL:.../v8/finance/chart/{ticker}
URL query string:
| URL query string parameter | Description |
|---|---|
symbol: {ticker} | Provide the ticker symbol. |
period1: {unix-timestamp} | Start date in the Unix timestamp format. For example, 1704087009 is the unix timestamp for Jan 01 2024 05:30:09 GMT+0000. |
period2: {unix-timestamp} | End date in the Unix timestamp format. |
interval: {interval} | Specify the time interval, for example: – 3mo denotes 3 months– 1d denotes one day |
includePrePost: true | Add data before and after the market. |
events: div%7Csplit | Add dividends and splits. |
Major data (obsolete)
JSON URL: .../v10/finance/quoteSummary/{ticker}
| Data entity | URL query string |
|---|---|
| Price | modules: price |
| Key statistical data including (YTD Daily Total Return, profit margins, float shares, etc.) | modules: defaultKeyStatistics |
| Expense Ratio | modules: fundProfile |
| Profile Data | modules: assetProfile |
| Income statements history | modules: incomeStatementHistory |
| Quarterly income statements history | modules: incomeStatementHistoryQuarterly |
| Balance Sheet history | modules: balanceSheetHistory |
| Quarterly balance Sheet history | modules: balanceSheetHistoryQuarterly |
| Cash flow statement history | modules: cashflowStatementHistory |
| Quarterly cash flow statement history | modules: cashflowStatementHistoryQuarterly |
| Financial data | modules: financialData |
| Calendar events | modules: calendarEvents |
| Securities filings | modules: secFilings |
| Recommendation trend | modules: recommendationTrend |
| Upgrade & downgrade history | modules: upgradeDowngradeHistory |
| Institution ownership | modules: institutionOwnership |
| Fund ownership | modules: fundOwnership |
| Major direct holders | modules: majorDirectHolders |
| Major holders breakdown | modules: majorHoldersBreakdown |
| Insider transactions | modules: insiderTransactions |
| Insider holders | modules: insiderHolders |
| Net share purchase activity | modules: netSharePurchaseActivity |
| Earnings | modules: earnings |
| Earnings history | modules: earningsHistory |
| Earnings trend | modules: earningsTrend |
| Industry trend | modules: industryTrend |
| Index trend | modules: indexTrend |
| Sector trend | modules: sectorTrend |
Yahoo Finance API is not an undisputed alternative to Google Finance. You can also use Coupler.io to fetch data via other APIs, for example, Alpha Vantage or IEX. Check out how we managed to create a currency tracker in Google Sheets using it.
Monitor stock data and ask AI questions with Coupler.io
Get started for freeHow to get dividend data and options from stocks using GOOGLEFINANCE function
GOOGLEFINANCE only provides basic information such as price. Unfortunately, you can’t get dividend stock data with this function… but Google Sheets has another ace in the hole called IMPORTXML.
IMPORTXML function is a built-in function to import structured data from webpages. The supported data types include XML, HTML, CSV, TSV, as well as RSS and ATOM XML feeds. Read more in our blog post about XML to Google Sheets.
And where can we find the necessary structured data about dividends? The answer is Yahoo Finance – from here, you can pull the dividend and yield information using IMPORTXML.
The IMPORTXML function has two parameters: web-url and xpath-query. The web-url is the URL of the stock being searched for on Yahoo finance – for example, https://finance.yahoo.com/quote/AAPL is the web-url for Apple Inc.
How to get Xpath query
To get the xpath-query, complete the following steps:
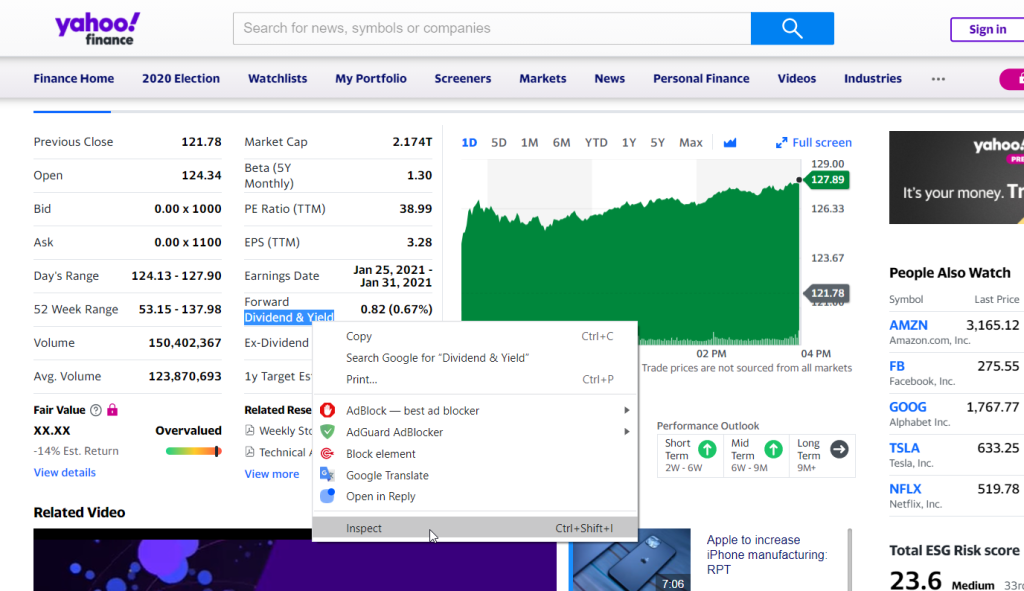
- On Google Chrome, select the dividend and yield => right-click and choose “Inspect” from the dropdown menu.
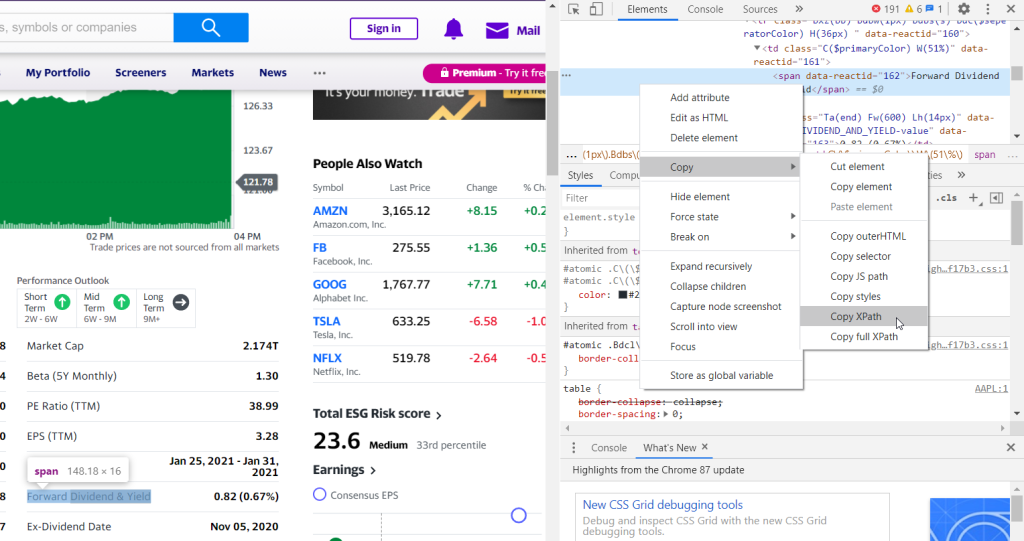
- Right-click on the highlighted code => select “Copy” => “Copy XPath”. XPath gives us this string:
//*[@id=”quote-summary”]/div[2]/table/tbody/tr[6]/td[2]
- Insert the XPath string into the IMPORTXML formula, so it will look like this:
=IMPORTXML("https://finance.yahoo.com/quote/AAPL","//*[@id='quote-summary']/div[2]/table/tbody/tr[6]/td[2]")

You can split the dividend and yield into different columns using the SPLIT function in Google Sheets.
In the example below, we nested a few functions into one advanced formula which imports the dividend and yield, and then split them into two different columns:
=split(IMPORTXML(concatenate("http://finance.yahoo.com/quote/",index(split(B3,":"),0,2)),$B$9),"()")
- B3 cell contains the ticker (
NASDAQ:AAPL) split(B3,":")splits the ticker intoNASDAQandAAPL- The INDEX function takes
AAPLonly. $B$9contains the XPath string- The CONCATENATE function adds the XPath string to the IMPORTXML formula
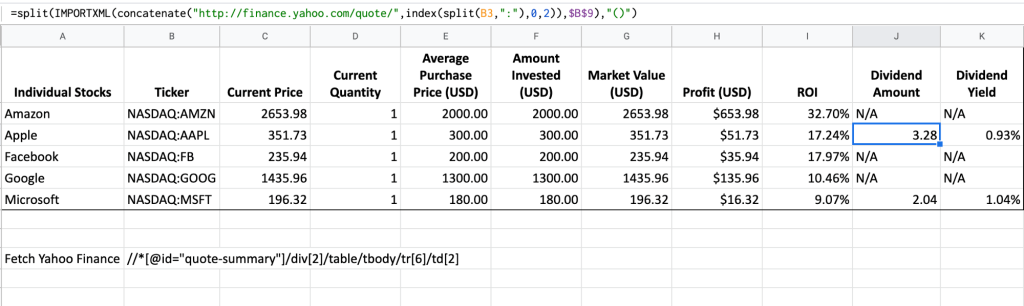
By doing this, we have pulled data from Yahoo Finance and split it into their columns successfully!
Is the GOOGLEFINANCE function worth it?
GOOGLEFINANCE is useful for quick lookups like current stock prices, exchange rates, basic historical data, etc. At the same time, it’s not reliable enough for anything you depend on. The 20-minute delay, the #N/A errors when you have too many formulas, and the deprecated Google Finance API all limit what you can build with it.
For anything recurring or analytical, the Yahoo Finance Price connector in Coupler.io is more stable. You get scheduled refreshes, structured data, and the option to send the same dataset to multiple destinations. And once the data is flowing, you can ask AI Agent questions about price patterns and ticker performance instead of building formulas to answer each question manually.
Automate financial data export and AI analysis with Coupler.io
Get started for free