A sales manager asks a simple question: “What’s our win rate by rep this quarter?” The answer should be easy to get. Often, it isn’t.
Your sales data is scattered. Pipeline stages may be in Salesforce, quota targets in a spreadsheet, and activity data in HubSpot. Before you can analyze any of it, you have to bring it all together. Then clean it up. And do it again when the numbers change.
That makes AI sales analytics an appealing shortcut. Export the CRM data, upload it to Claude, and ask the question in plain language. But a one-off file comes with its own problems. It starts going stale as soon as you export it. It also may be missing context from other sources, and leaves Claude to work with whatever structure and definitions happen to be in the file.
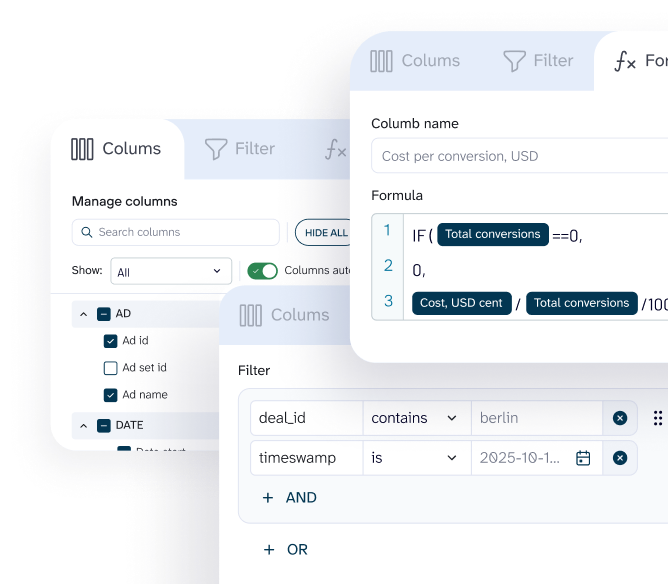
Connect sales data to Claude through Coupler.io instead, and you can remove that manual step from the workflow. Coupler.io brings data from multiple sources together, lets you prepare it and add business context, and refreshes it on a schedule. Its Analytical Engine runs the calculations against the connected dataset. Claude only interprets the results and helps you investigate them with follow-up questions.
Analyze sales data in Claude with Coupler AI
Connect over 400 data sources to Claude with Coupler.io for conversational data analysis, and manage your connections, data sets, refresh schedule, semantic layer, and more from Claude.
Try for free
What is Claude AI sales analytics?
Claude AI for sales analysis means giving Claude access to your pipeline data and asking questions in plain language instead of building a new report every time.
Sales analysis with Claude could start with a question like What's our win rate by rep this quarter? Claude returns an answer, and you continue the conversation from there. If win rate dropped, ask which reps, segments, or lead sources contributed most. Then narrow again based on what you find.
The difference is how the data gets there. Paste a raw CSV and Claude receives a static snapshot with no business context and no refresh. Coupler.io connects your sources, prepares the dataset, adds context, and lets its Analytical Engine run the calculations. Claude focuses on interpreting results and answering follow-ups.
For Claude AI sales analytics, the main options look like this:
| CSV upload | Claude Code / custom script | Coupler.io | |
|---|---|---|---|
| Setup time | Minutes | Hours to days | Minutes |
| Data freshness | Stale on export | Depends on your build | Scheduled auto-refresh |
| Business context for Claude | None | Manual (you build it) | Automatic via schema + option to add manually |
| Calculation accuracy | Low; LLM does the math | Depends on your build | High; Analytical Engine computes the result |
| Maintenance | Re-export every time | Developer upkeep | Set and forget |
| Coding required | No | Yes (Python, API) | No |
| Best for | One-off spot checks | Teams with dev resources | Teams with ongoing sales analysis |
For anything beyond a one-time glance at a small file, Coupler.io handles the refresh, context, and math. These are the parts that make sales data analytics using Claude reliable. For ongoing sales analytics with Claude.ai, you can then keep investigating new questions as the underlying data changes.
How to connect sales data to Claude
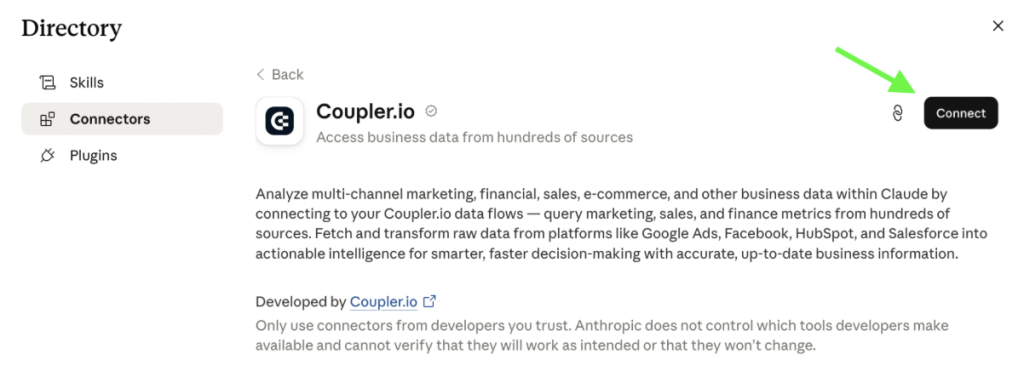
You can integrate data with Claude through Coupler.io’s connector in just a few steps. Install the Coupler.io connector (it’s one of the first connectors that appeared in Claude’s connection library).

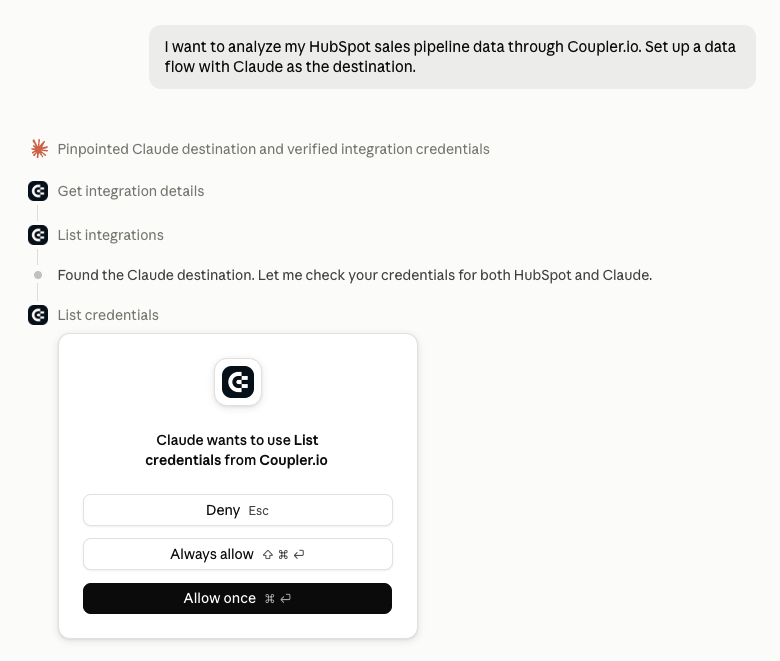
Then, simply go to Claude and type out what you need. Follow the setup it takes you through and allow permissions.

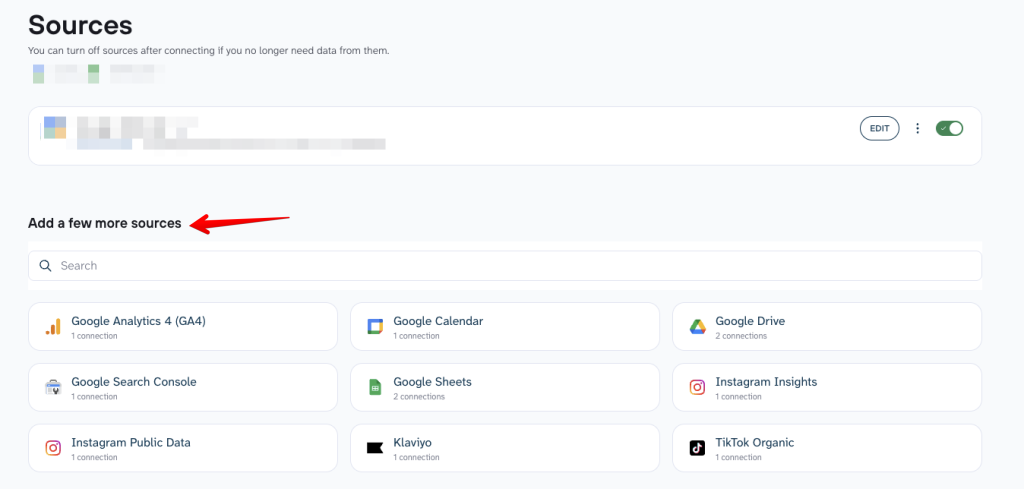
If the analysis requires data from several places, you can add them to the same flow. For example, you might combine pipeline data from HubSpot with quota targets from Google Sheets rather than analyzing the two separately. You can either ask Claude to set it up for you, or you can do it yourself in Coupler.io:

Before sending the data to Claude, it’s best to shape the dataset and add context. That can mean renaming Deal Value and Amount to use the same naming convention, removing irrelevant columns, or explaining that Stage 3 means Negotiation in your sales process.
The only thing that remains is telling Claude to set up the refresh schedule tailored to your needs.
Once the connection is running, you can start asking questions and investigating what the answers mean.


Investigate your pipeline in Claude with Coupler.io
Book a callExamples of how you can analyze sales data with Claude
Now that everything is connected, analyze sales data with Claude. Start with a question about your pipeline, then use each answer to decide what to investigate next. Below are three examples of how that can work.
Find deals that are putting your pipeline at risk
Start with a practical question you might otherwise need to filter your CRM manually to answer:

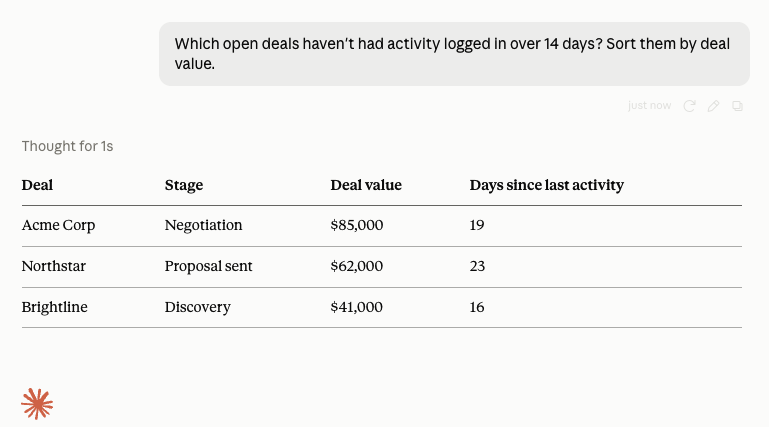
As you can see, Claude can return a list of inactive deals, ordered so the largest opportunities are visible first. Instead of reviewing every open opportunity, you immediately have a smaller group worth investigating.
The list alone isn’t the finding. The stage changes what that inactivity means.
A $41,000 deal sitting in Discovery for 16 days may still need qualification. An $85,000 opportunity already in Negotiation with no activity for 19 days deserves more immediate attention.
So instead of stopping at the first answer, continue the conversation:

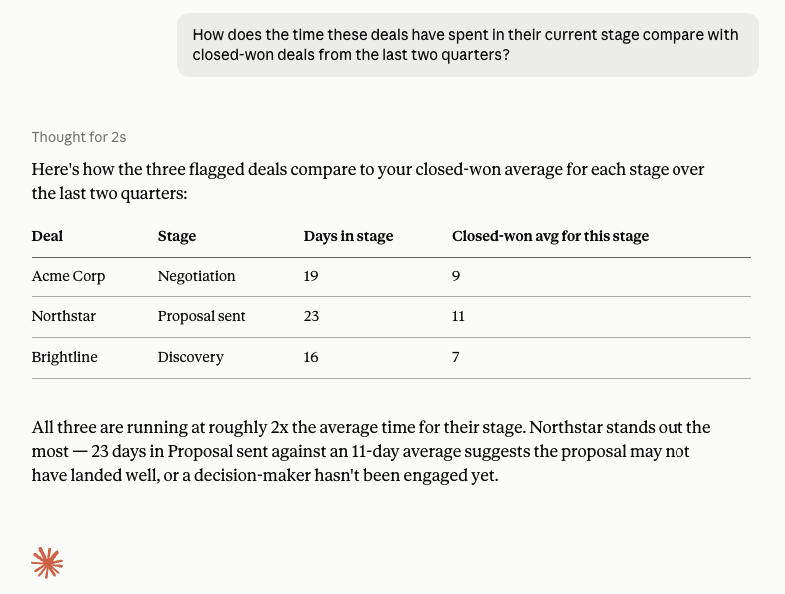
Now you are moving from a basic pipeline filter to deal velocity analysis. If successful deals historically spend five days in Negotiation and Acme has been there for 24, that gives the sales manager much more useful context than a generic “inactive deal” flag.
A natural next step:
“Which of these deals are furthest above the historical average for their current stage?“
Or
“Break the stalled pipeline value down by rep.“
This is where conversational sales analytics becomes more useful than a static report. The first question identifies the issue. The next questions help determine where it is concentrated and which opportunities need attention first.
Investigate why conversion changed
Another common sales question starts with a topline metric:

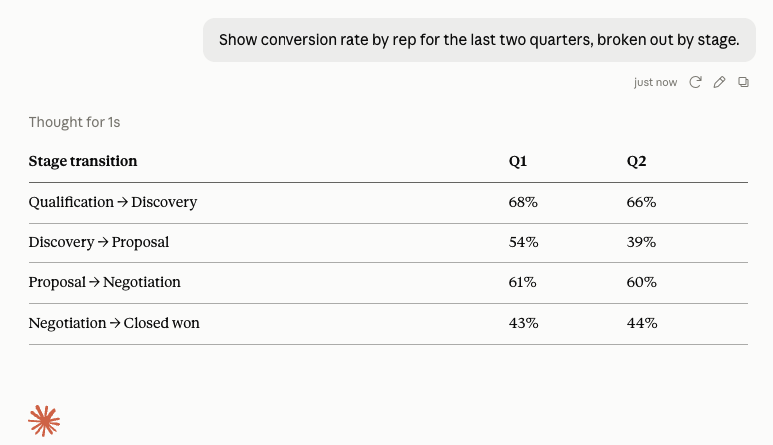
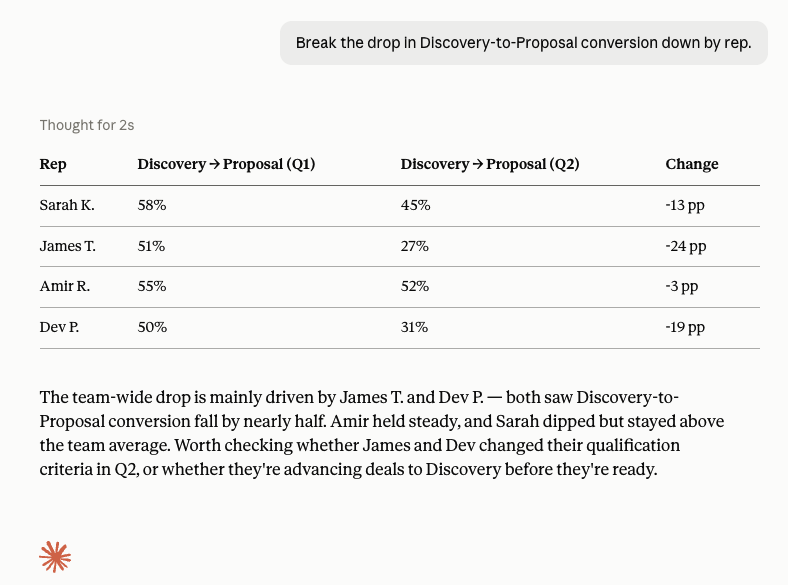
Looking only at overall win rate could hide the real problem. Here, the largest change happened between Discovery and Proposal.
That immediately gives you a better follow-up question:

Additional idea:

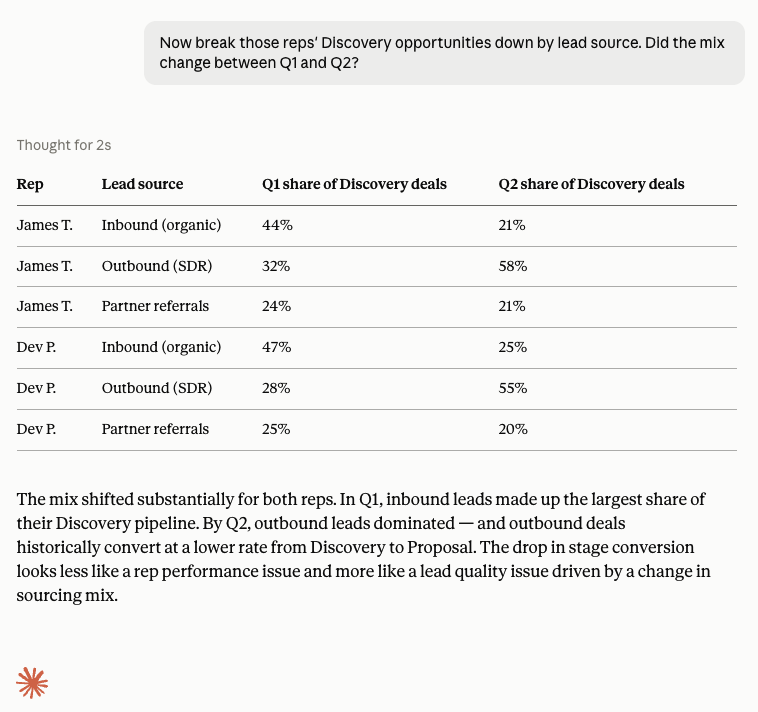
You can use the same workflow to investigate lead source performance directly, like asking:
“Which lead sources have the highest conversion rate this year? Include average sales cycle length for each.“
A channel with the highest conversion rate is not automatically the best source. If one converts at 35% but takes 90 days to close while another converts at 30% in 35 days, the second may be more useful depending on your sales model and capacity.
Keep narrowing until the metric explains something actionable rather than simply describing performance.
Check whether your sales forecast can be trusted
Start with:

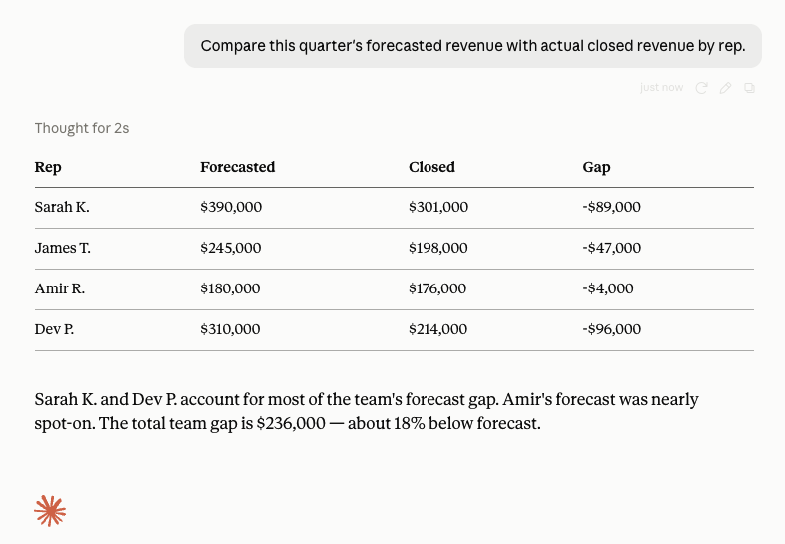
Claude can show where the biggest gaps are. If one rep forecasted $390,000 but closed $301,000, the difference tells you where to investigate, not why it happened.
Continue:

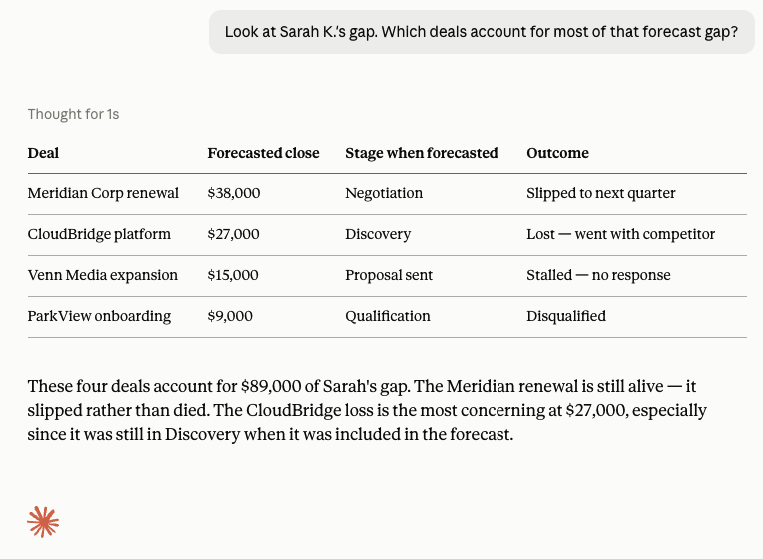
The next question might be “What stages were those deals in when they were included in the forecast?“
If most of the gap came from early-stage opportunities that failed to close, your forecasting criteria may be too optimistic. If several late-stage deals simply slipped into the next quarter, the same forecast gap tells a different story.
Another angle: ask Claude to compare forecast accuracy by month for the last four quarters.
This helps you see whether forecasting consistently improves as each quarter progresses or whether the same gaps keep appearing.
Get accurate sales numbers in Claude with Coupler.io
Get started for freeHow Coupler.io supports deeper sales analysis with Claude
The examples above show what happens once your sales data reaches Claude, but the same flow in Coupler.io can do way more than support individual questions.
First, Coupler.io keeps the calculations outside the language model. When you ask something like “What's our average deal size by rep this quarter?“, Claude translates the question into a query. Coupler.io’s Analytical Engine runs it against the full dataset, performs the calculation, and returns the result for Claude to interpret.

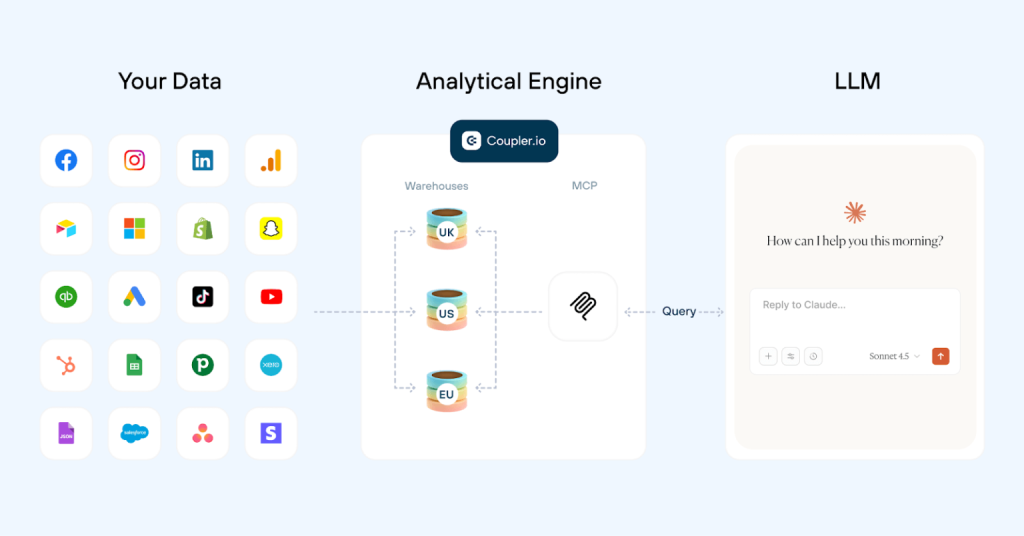
In simple terms:
| Your sales question → query against your Coupler.io dataset → calculated result → Claude explains the result. |
For Claude to interpret that result according to your unique business rules, you can add Context to the dataset. For example, if average deal size should include only new business and exclude renewals, define that once and forget about it. Do the same for sales stages, deal types, or other definitions specific to your sales process. Claude will have those definitions when it interprets the calculated result.
When the analysis requires more than definitions, you have the ability to build more complex preparation into the data flow with SQL-based transformations. Say you want to take the average deal size analysis further and compare reps across territories. You could join CRM data with territory assignments and calculate average deal size by both rep and region. That transformation runs again when the data refreshes, so the logic does not have to be recreated in every Claude conversation.
Once that prepared dataset is ready, it does not have to serve only Claude. You can send the same data to multiple destinations. Your Data Studio dashboard could track average deal size by rep over time, while Claude gives you a way to investigate an unexpected change: “Why did Anna's average deal size drop this quarter?“ The dashboard handles ongoing monitoring; Claude gives you room to explore what is behind the numbers.
And if this is an analysis your team performs regularly, you can make the workflow repeatable with AI Agent Skills. The Sales Analytics Skill specifically provides a consistent workflow for analyzing CRM and pipeline data, including:
- win rates
- deal velocity
- stage conversion
- rep performance.
Instead of looking at average deal size in isolation, you can put it in context with other pipeline metrics and identify what deserves a closer look.
For recurring analysis, your team can create a custom Skill. For example, a regular sales review could check average deal size alongside win rate and sales cycle length by rep. It will follow the same instructions each time the underlying data changes.
So the question that started with “What's our average deal size by rep?“ can grow into a broader sales analytics workflow:
- Define what the metric means for your business
- Build more complex logic into the dataset when needed
- Monitor it in a dashboard
- Investigate changes with Claude
- Make recurring analysis consistent with Skills.
Connect your sales data to Claude with Coupler.io
Get started for freeClaude prompts for sales analysis
Here are six Claude prompts for sales analysis you can use right away, each tied to a real use case. These assume your sales data is connected through Coupler.io, so it handles the calculations and Claude handles the interpretation.
Pipeline health check
“Which deals in the pipeline haven't had activity logged in over 14 days? Sort by deal value.“ |
“Which deals in the pipeline haven't had activity logged in over 14 days? Sort by deal value.“
This is the fastest way to find deals that are going cold. If you track activity in your CRM data, Claude will cross-reference last-activity dates against open deals and surface the ones that need attention. Run this weekly to track sales pipeline performance with Claude and spot deals that need attention before they become a quarterly surprise.
Deal-risk flagging
“Which open deals show weakening buying signals compared to deals we closed last quarter?“
“Which open deals show weakening buying signals compared to deals we closed last quarter?“ |
This prompt works well if your CRM tracks engagement metrics like email opens, meeting frequency, or stakeholder involvement. Claude can identify patterns in closed-won deals and flag current deals that are trending away from those patterns. One thing to note: do not ask Claude to predict outcomes. Ask it to compare current deals against historical patterns and let you draw the conclusion. AI is good at surfacing patterns; the judgment call about what to do with them is yours.
Forecast accuracy
“Compare this quarter's forecast to actual closed revenue by rep.“
“Compare this quarter's forecast to actual closed revenue by rep.“ |
A straightforward but high-value prompt. Coupler.io runs the comparison (forecasted amounts versus closed-won amounts, grouped by rep), and Claude presents the result. If you asked Claude to calculate this from raw deal rows in a pasted CSV, the totals would likely drift. With Coupler.io, the math is done before Claude sees it.
Rep performance comparison
“Show conversion rate by rep for the last two quarters, broken out by stage.“
“Show conversion rate by rep for the last two quarters, broken out by stage.“ |
Useful for coaching conversations and quarterly reviews. You can follow up with “Which rep improved the most between Q1 and Q2?” to spot positive trends. The ability to ask follow-up questions against the same dataset, without rebuilding a report or re-pulling data, is where conversational analytics earns its keep.
Quarter-over-quarter trend analysis
“What changed in our average deal size from Q1 to Q2? Break it down by segment.“ |
“What changed in our average deal size from Q1 to Q2? Break it down by segment.“
This surfaces whether your deal sizes are growing, shrinking, or shifting between segments. If average deal size dropped in mid-market but grew in enterprise, that is a different story than an overall decline, and it calls for a different response. Pair this with a follow-up like “What is the average sales cycle length by segment for the same period?” to see whether the shift in deal size also changed how long deals take to close.
Lead source performance
“Which lead sources have the highest conversion rate this year? Include average sales cycle length for each.“
“Which lead sources have the highest conversion rate this year? Include average sales cycle length for each.“ |
This prompt combines two metrics (conversion rate and sales cycle length) to give a fuller picture of lead source quality. A source with high conversion but a 90-day sales cycle might be less valuable than one with slightly lower conversion but a 30-day cycle, depending on your team’s capacity. If you run this quarterly, you start to see which channels are actually worth the prospecting effort over time, not just in a single snapshot.
What is the best way to automate sales reporting with Claude?
If your sales data lives in a single CSV or a small spreadsheet, you can export it, upload it to Claude, and ask your questions. That works for one-off analysis, but you need another export when you want updated numbers.
If you are comfortable with code, you can instead build a custom pipeline that pulls from your CRM API, prepares the data, and makes it available to Claude. That gives you more control, but also means maintaining authentication, API changes, and the pipeline itself.
Coupler.io is designed for recurring analysis without building that infrastructure yourself. It can connect Salesforce, HubSpot, Pipedrive, and other sales sources, refresh the data on a schedule, and make the prepared dataset available to Claude through MCP.
You can also combine CRM data with other sources before the analysis. For example, join pipeline data with quota targets or territory assignments, rename inconsistent fields, remove columns you do not need, and add context explaining your team’s definitions.
Once the flow is running, the workflow becomes much simpler:
| Connect and prepare the data once → ask Claude a question → investigate the answer with follow-ups → repeat with refreshed data. |
With connected, refreshed data, the sales performance report Claude gives you becomes a starting point for analysis rather than a static output. You can follow up on individual metrics to investigate what changed and why.
Connect Salesforce, HubSpot, or any of 400+ sources to Claude with Coupler.io
Get started for freeFAQ
Can Claude analyze sales data from Salesforce or HubSpot?
Yes. You can sync Salesforce data with Claude, as well as HubSpot, Pipedrive, and other sales sources to Coupler.io, prepare the data, and make it available to Claude. This avoids repeatedly exporting and uploading new CRM files when the data changes.
What is Claude MCP sales analytics?
Claude MCP sales analytics lets you ask questions about connected business data in Claude instead of working from a static upload. With Coupler.io, Claude translates your question into a query, while Coupler.io’s Analytical Engine runs the calculation against the dataset and returns the result for Claude to interpret.
What sales questions can I ask Claude?
You can investigate pipeline health, win rates, stage conversion, deal velocity, forecast accuracy, rep performance, lead sources, and other sales metrics. Follow-up questions let you move from spotting a change to investigating where it happened and what may be driving it. For more on what’s possible, see how teams use Claude for AI-driven sales insights.
Can I combine multiple sales data sources before analyzing them with Claude?
Yes. For example, you can combine CRM pipeline data with quota targets, territory assignments, or other sales data in Coupler.io. You can also transform the dataset and add business context before Claude analyzes it.
Can I use the same sales data for Claude and a dashboard?
Yes. Coupler.io supports multiple destinations, so the same prepared data can be used for structured reporting in a dashboard and conversational analysis with Claude. This lets you monitor recurring KPIs in a dashboard and use Claude to investigate specific changes.
Can I use Claude AI for sales call analysis?
Claude AI sales call analysis is possible when you provide Claude with sales call transcripts or other conversation data. Claude AI for sales conversation analysis can also be useful when you want to compare those patterns with CRM outcomes, such as whether certain objections appear more often in lost deals.