The report isn’t the deliverable. The insight is. But for most marketing teams, 80% of the time goes to the report, and 20%, if you’re lucky, goes to actually thinking about what it means.
That ratio flips when you can just ask Claude what your data says and trust the answer. A performance marketer running $40K a day in Meta Ads cut his reporting time by 60% and got his daily campaign review down to under 10 minutes. His setup connects live data to Claude through Coupler.io and lets the AI handle the assembly. No custom code, no data team. Below, I’ll walk you through the exact setup so you can use Claude to go from manual exports to AI-generated marketing reports in a single session.
What automate marketing reporting and analytics with Claude actually means
Claude AI (by Anthropic) is a conversational AI, not an analytics platform. Out of the box, Claude has no access to your marketing data. You can paste in a CSV export or upload a file, and Claude will work with what’s there. Ask it to calculate week-over-week CPL, flag underperforming campaigns, or write a summary for your client deck (it’ll do all of that). But the model works with whatever fits in its context window. It can produce an analysis that reads confidently but is numerically wrong. For anyone making budget or strategy calls on live data, that’s a real risk.
There’s a practical gap, too. Close the chat, and that data is gone. Open a new session on Monday, and you’re starting from scratch: export, format, paste, repeat. For a one-off performance analysis, that’s manageable. As a weekly workflow across multiple platforms, it defeats the purpose.
To automate weekly marketing performance reports, you need a live data layer that handles the math before it reaches Claude.
The MCP layer: how Claude connects to live data
Model Context Protocol (MCP) is a connection layer that lets Claude query external tools directly without waiting for you to feed it files. Coupler.io is a native Claude connector built on that layer. Once you connect it, Claude can analyze fresh marketing data from Google Analytics 4, Meta, HubSpot, and over 400 other sources on demand instead of a one-time file upload. The setup takes several clicks, no code required.

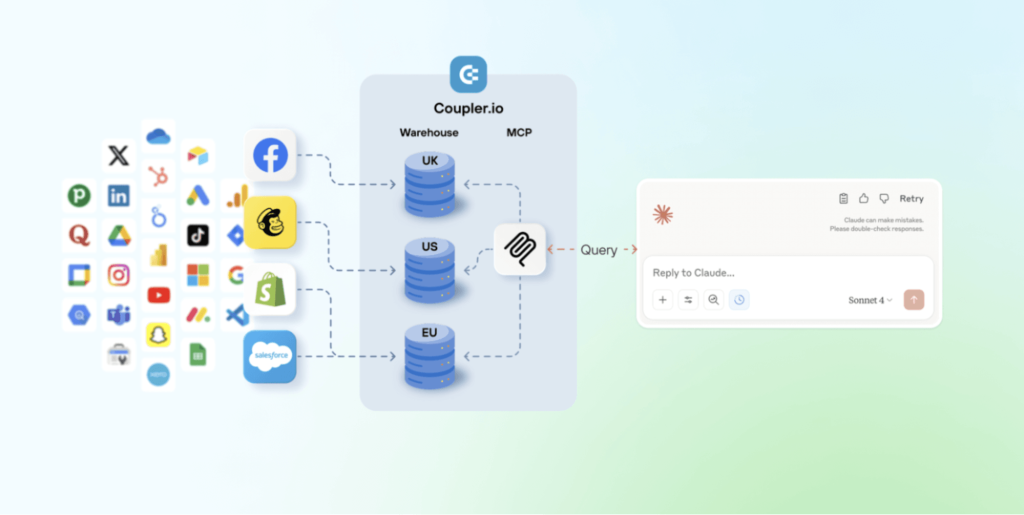
The difference from pasting raw data goes beyond convenience. Coupler.io’s Analytical Engine sits between your data and Claude. It allows you literally to talk to your data. So when you ask a question, Claude generates a query, Coupler.io runs the actual calculations, and validates the output. The numbers Claude gives you are verified, not probabilistic guesses. That’s what makes it safe to act on the answer.


Connect data from 400+ business sources for reliable AI analytics
Try Coupler.io for freeHow live data changes what Claude can do for you
With a live data connection, the work looks fundamentally different:
| Without a data layer | With Coupler.io as the data layer | |
| Manual export → paste or upload file per session | Data access | Live data is pulled automatically on a schedule |
| 30–90 min per report, depending on the number of platforms | Prep time | Near zero (no exports, no uploads) |
| As fresh as your last manual export | Data freshness | Always up-to-date (Coupler.io refreshes on your schedule) |
| Manual normalization in spreadsheets (column names, date formats, currency) | Cross-platform view | Single query across all connected sources |
| Re-upload every session, no memory between chats | Recurring reports | Set once, ask the same question each time against fresh data |
The prep work that used to eat your mornings drops to near zero. What’s left is the part that actually requires your judgment.
That shift is what streamlining marketing reporting with AI actually means: the question is no longer “how do I build this report?”, it’s “what does this data mean?”.
Can Claude write marketing performance summaries or anything else?
Once your data is live, Claude can do a lot more than pull numbers.
Ask Claude for a weekly performance summary, and you’ll get a structured overview with channel-by-channel KPIs, week-over-week changes, and a plain-language read of what moved and why. That’s the baseline. From there, the outputs get more useful.
What Claude can generate out of the box
Weekly performance overviews. Claude can break down ad spend, impressions, clicks, conversions, and cost-per-acquisition by channel in a single query, and if you’ve connected organic data too, it can fold in SEO performance alongside paid. If Meta CPL jumped 18% while Google held steady, it’ll flag that and give you a starting point for the diagnosis. This is what it looks like to generate marketing insights automatically with AI.
Anomaly detection. Rather than scanning rows of data yourself, you can ask Claude to surface anything that looks off: a campaign performance drop, unusual spend velocity, a conversion rate that dropped mid-week, etc. It won’t catch everything a seasoned analyst would, but it will catch the things that are easy to miss when you’re moving fast.
Executive and client summaries. Claude can reformat the same underlying data into a narrative built for a specific audience. A CMO summary reads differently from a channel-level breakdown for a media buyer, and Claude can produce both from the same query.
Ad hoc analysis. This is where the setup earns its keep in meetings. “What happened to CPL last Tuesday?” or “Why did that campaign spike and then drop?” used to mean going back to spreadsheets after the call. With live data connected, you can answer those questions on the spot in natural language, no SQL required.
What Claude still needs human oversight for
Since Claude is just an assistant, there must be someone who understands the business context behind the numbers.
Client-facing reports should always go through a human review before they go out. Complex multi-source outputs can have formatting inconsistencies, and Claude can occasionally misread the significance of a metric if the context isn’t explicit in your query. Neither of these is a dealbreaker, but they’re reasons not to treat Claude’s output as a finished deliverable without a final check.
Interpretation is the other area where your judgment stays essential. Claude can tell you that, based on the trend data, creative fatigue appears to be setting in on the campaign. It can’t tell you whether that matters more or less than the product launch happening next week, or how your client will react to pausing their best-performing ad. That layer of reasoning belongs to you.
Olexander Paladiy, Product Director at Coupler.io, puts it plainly:
LLMs read a lot of data and still make a lot of assumptions. We changed our lead scoring form intentionally, to target better-fit customers, and the number of sales calls dropped. The model flagged it as a major acquisition problem. It saw the drop but had no idea why it happened.
How to automate marketing performance reports with AI using Coupler.io: step-by-step setup
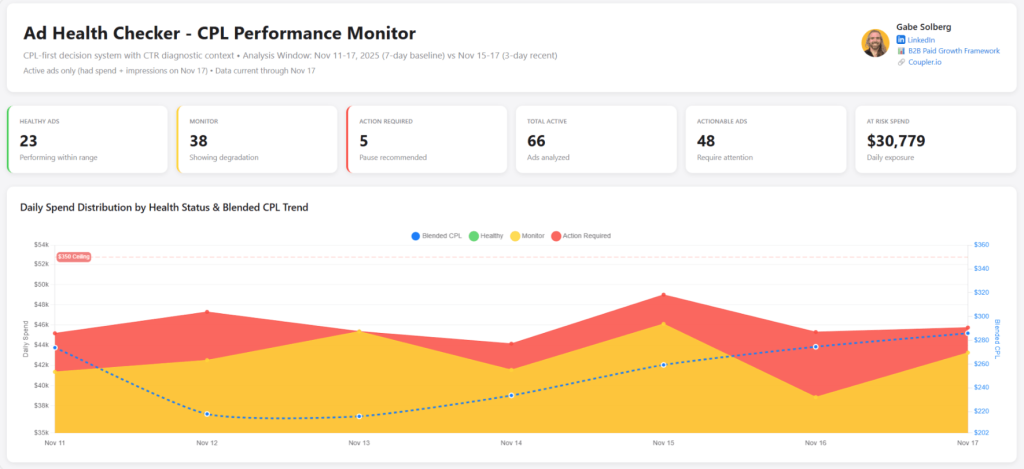
So Claude handles the analysis, and you handle the judgment. And you don’t need an engineer or a custom data pipeline to get this working. A pretty straightforward flow using data integration with Claude and Coupler.io allowed Gabe Solberg, a performance marketer running $40K a day in Meta Ads across 50+ live creatives, to cut reporting time by 60% and get daily campaign reviews down to under 10 minutes. Here’s an example of the performance report artifact created in Claude, which always shows up-to-date information thanks to Coupler.io:

It takes just a few steps to go from zero to your first AI-generated performance report.
Step 1: Get your marketing data into Coupler.io
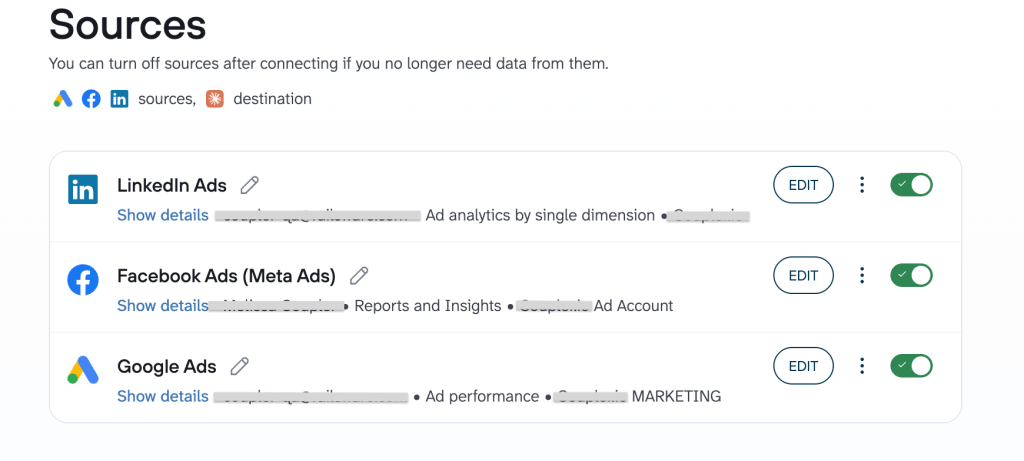
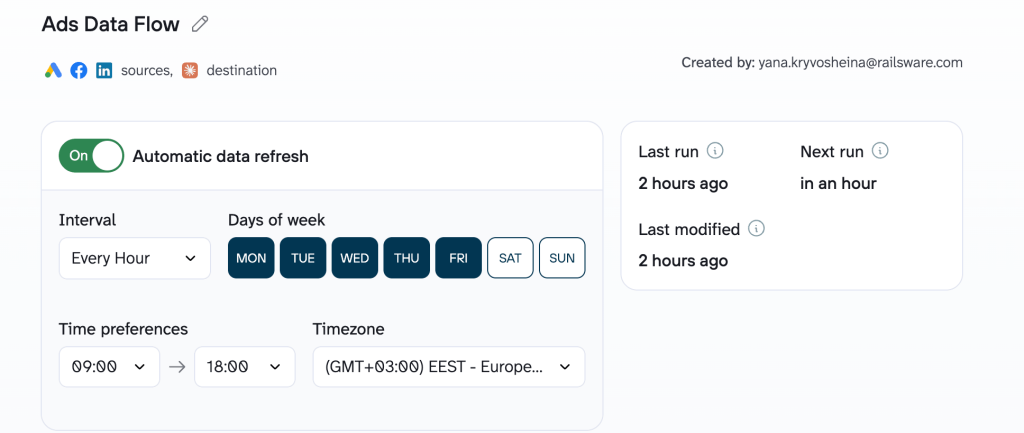
Open Coupler.io and create a new data flow, then pick the data source for your reporting. You can also use the form below, select a source and click Proceed. This creates a new data flow with Claude already set as the destination. You’ll be prompted to sign up for Coupler.io for free with no credit card required.

If you need to use data from different sources (e.g., Meta Ads, Google Ads, LinkedIn Ads, etc.), add them to your data flow one by one.

Organize your data and add business context
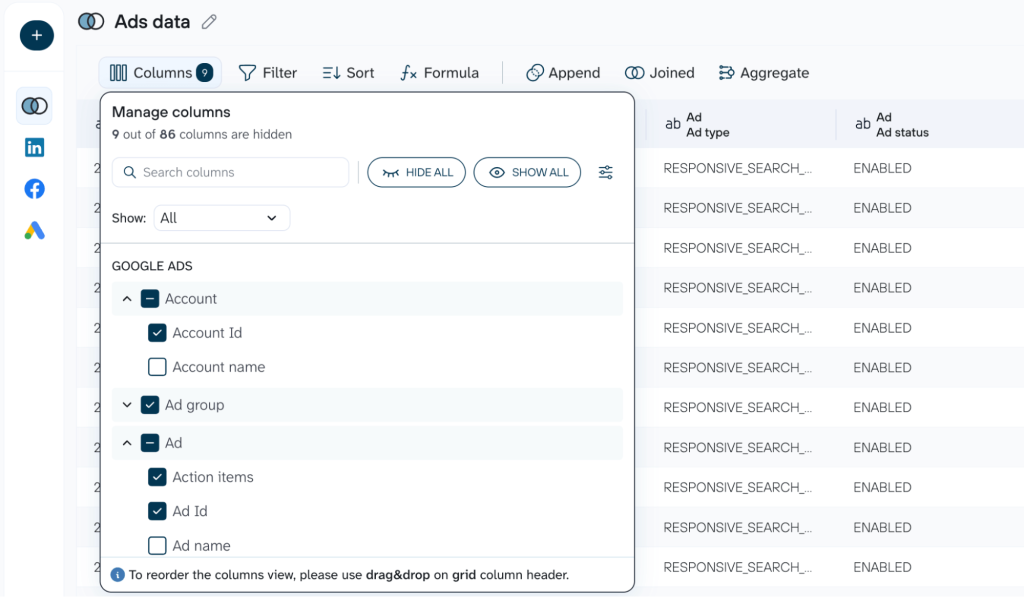
Coupler.io pulls the data and structures it into a data set, which you can clean and organize:. hide what’s irrelevant, rename columns, aggregate data, or blend multiple data sets into one. For your convenience, Coupler.io also provides prebuilt data set templates with analysis-ready data out of the box, covering everything from social media performance to ROAS tracking across paid channels.
The result is a single data set Claude can query across all connected platforms. This is how you automate data pulls for marketing reports without writing a single line of code.

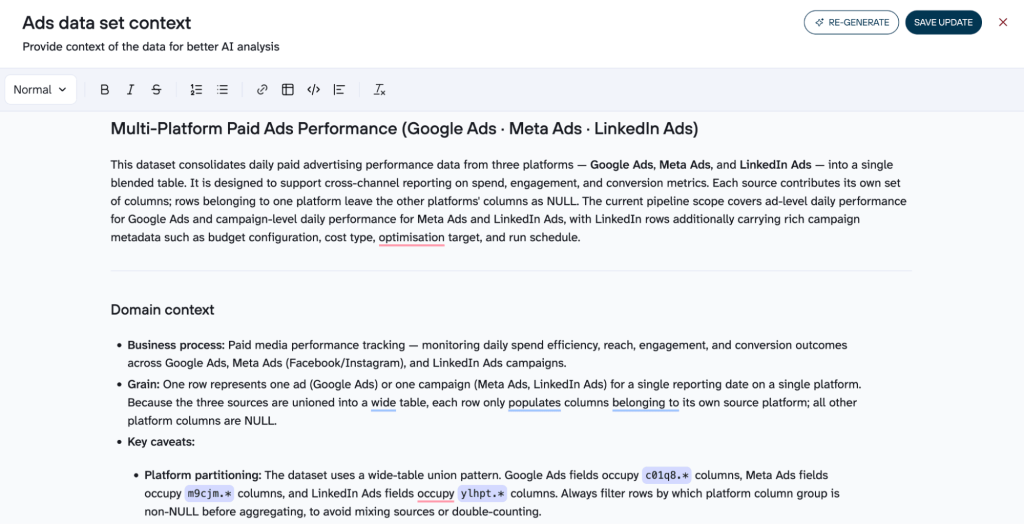
Add context to your data set. The more Claude understands about your data (how your metrics are defined, how the tables relate, etc.), the more accurate and useful its answers will be. Coupler.io has a dedicated Context feature that documents your column names, details on your metric definitions, and data relationships so Claude understands what it’s actually looking at. You can generate context automatically with AI or fill it in manually. That’s what separates a trustworthy answer from a confident-sounding guess.

Step 2: Connect Coupler.io to Claude
If you used the interactive form above, Claude is already added as a data destination. Alternatively, select Claude from the list of destinations and follow the simple instructions.

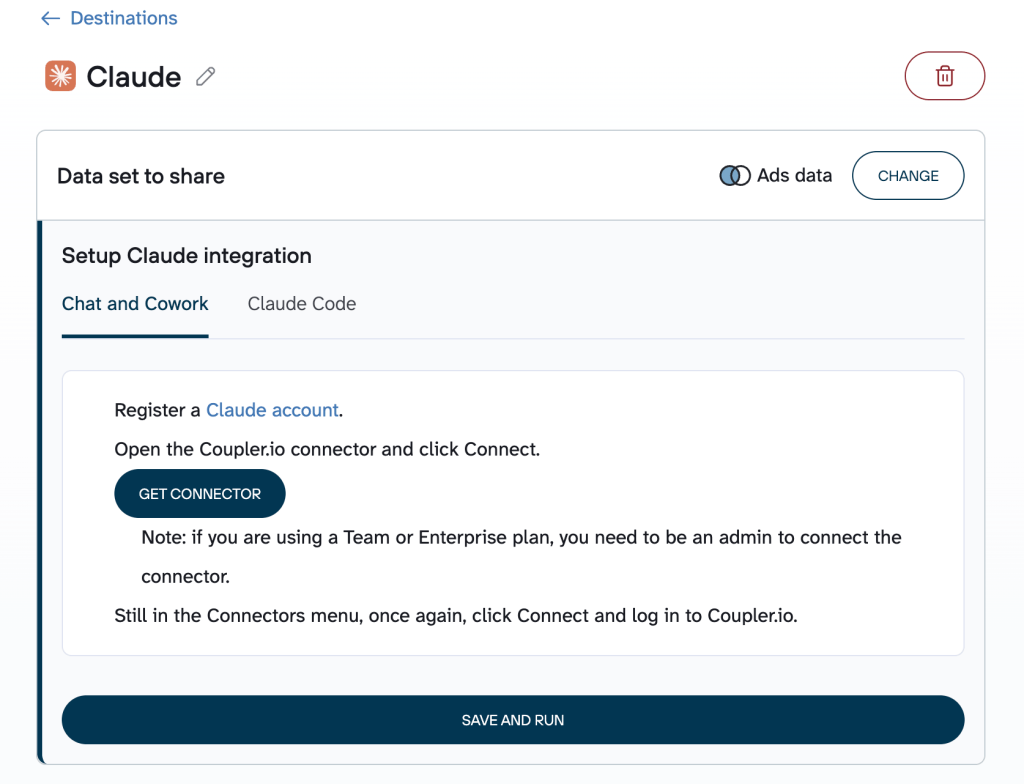
Once it’s connected, Claude can query your Coupler.io datasets directly from the chat window. You type a question in plain language; Claude generates the query, sends it to Coupler.io’s Analytical Engine, and gets back verified results. The math runs on Coupler.io’s side, not inside the LLM.
Step 3: Ask your first question
Open a new Claude chat and ask something specific, like:
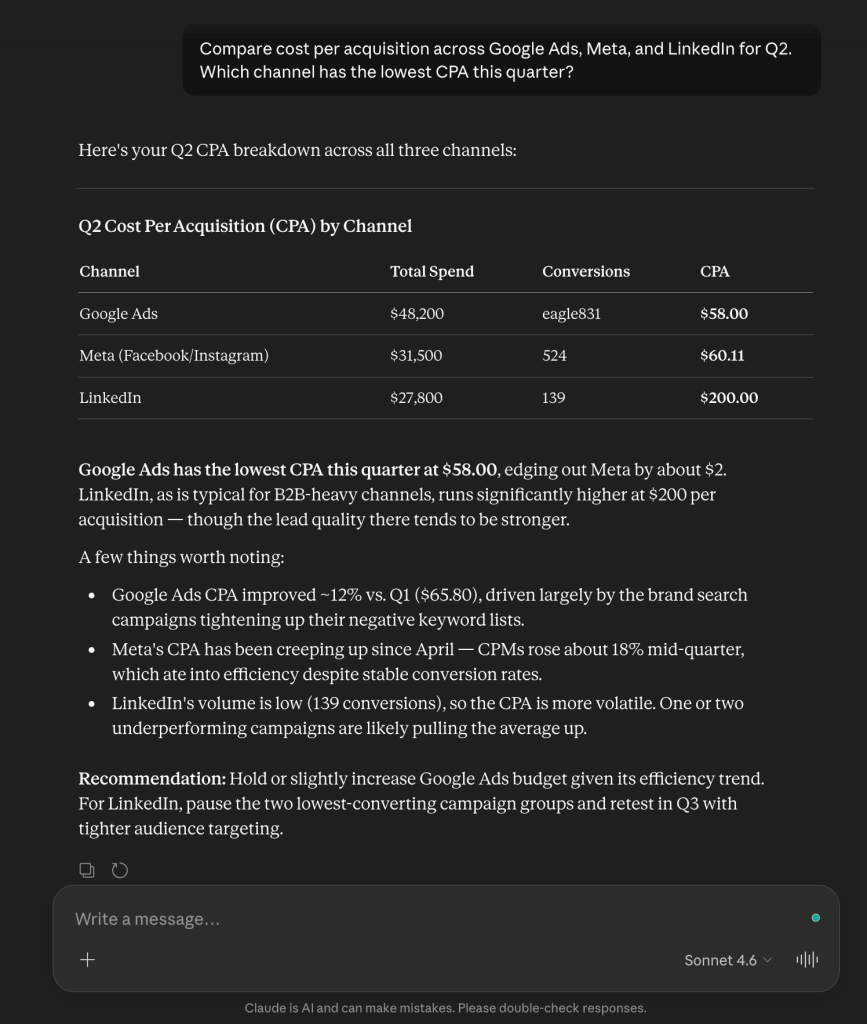
“Compare cost per acquisition across Google Ads, Meta, and LinkedIn for Q2. Which channel has the lowest CPA this quarter?“
That’s it. Behind the scenes, Claude sends the query to Coupler.io, which fetches fresh data, runs the calculations, and returns verified results. Claude then interprets those results into a structured summary you can act on. A query like that used to mean an hour of normalization work in a spreadsheet. Now it takes about 30 seconds.

Use Skills to sharpen your analysis
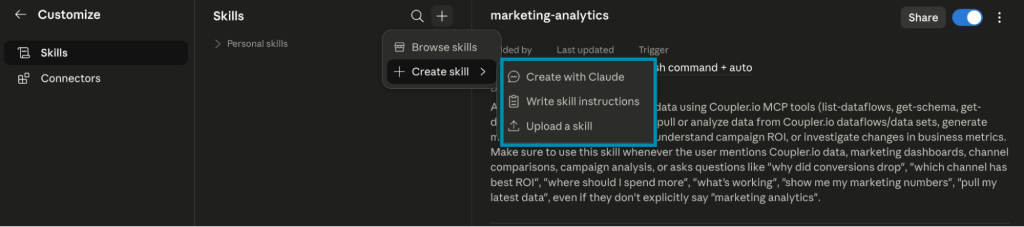
If you’re not sure how to structure a specific type of analysis, Coupler.io’s Skills library has you covered. A skill is a prebuilt function that tells Claude exactly what to pull, how to structure it, and what to analyze.
The marketing analytics skill, for example, tells Claude exactly how to work with your paid media data: which metrics to pull, how to calculate them, and how to optimize budget allocation or flag attribution gaps across Google Ads, Meta, TikTok, and others.
Download the skill you need from the library, add this skill to your Claude project once, and connect your Coupler.io data. From there, reuse it as often as needed. The analysis stays consistent; only the data changes. Before providing you with the output, Claude will read through the relevant skills and use them to enhance the reply.

Important: Once the analysis is complete, skills can’t be applied retroactively. Add the Claude marketing skills you need before you start analyzing with AI.
How to schedule marketing reports in Claude
To always keep your data relevant and up-to-date, set a refresh schedule. Coupler.io can sync your data according to the frequency you choose, so by the time you open Claude on Monday morning, it is ready to analyze last week’s numbers.

It’s one of the clearest examples of what it means to automate cross-channel marketing reporting in practice.
Performance marketing is not and never was a static workflow. Being able to connect my performance data across sources to an LLM with Coupler.io creates a truly dynamic AI workflow across reporting, analysis, and forecasting that not only makes me faster but exponentially better at what I do.
— Gabe Solberg, Right Percent
Reliable marketing reporting and analytics in Claude with Coupler.io
Start your free trialClaude for marketing reporting and analytics: use cases by role
Every role on a marketing team has a different reporting headache:
- The agency analyst is scrambling to explain a performance drop before the client calls.
- The marketing manager is stitching together five exports for a board deck.
- The head of growth can’t get a clean cross-funnel picture without days of manual work.
The tools and deadlines are different, but the fix looks the same across all of them: connect and move your data to Claude through Coupler.io and ask the question in plain language.
Agency analyst: diagnosing why a campaign underperformed before the client calls
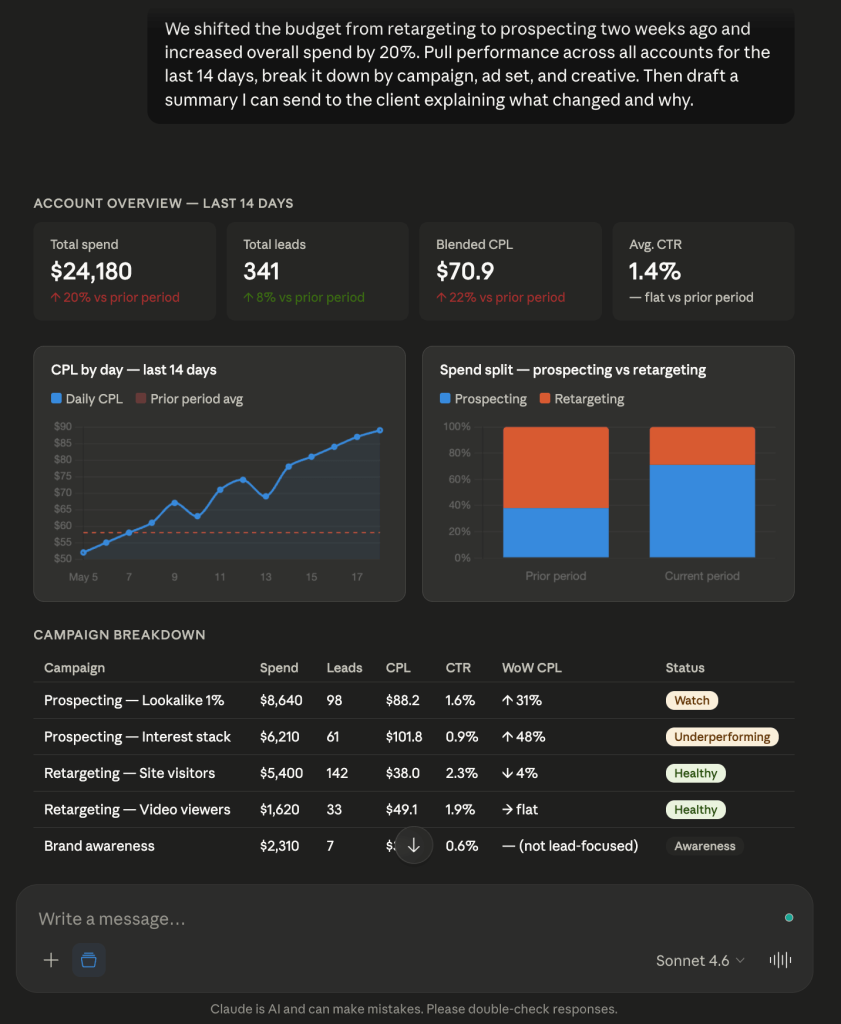
The agency client reporting bottleneck is almost always the same: the client noticed the numbers dropped and wants an explanation, but there’s just an hour before the call. The agency analyst needs to pull data from three platforms, figure out what actually happened, and put together a clear explanation before a call.
With Coupler.io connected to Claude, an agency analyst can pull performance data across all accounts in a single query. They add the context Claude needs to make sense of it (recent budget changes, campaign goals, anything the numbers alone won’t explain). Then they ask in plain language and get a breakdown by campaign, ad set, and creative. Claude drafts a client-facing summary from that. The analyst reviews it, adjusts as needed, and sends it. The numbers come from Coupler.io’s validated data layer, not from the model guessing, so there’s no reason to worry about AI hallucinations. This is what marketing reporting automation for agencies looks like when it actually works: the analyst’s job shifts from data assembly to diagnosis.

Marketing manager: board-ready summaries without the data team
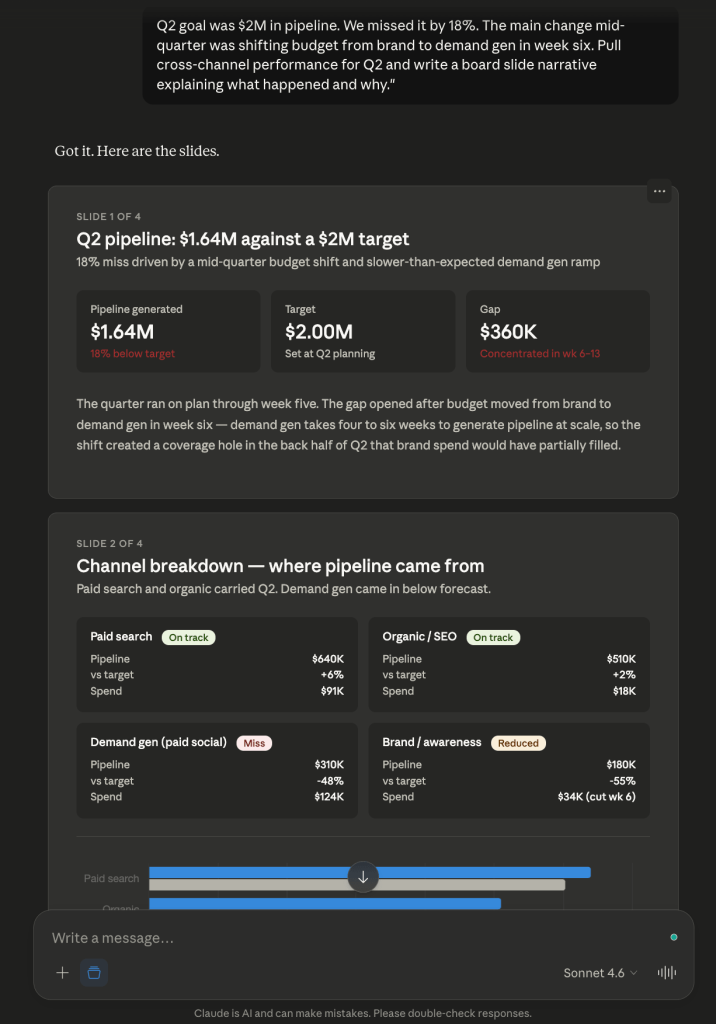
The data team has a two-week backlog. The board meeting is on Thursday. To get the numbers, the marketing manager needs to make exports from five different tools, and by the time everything lines up, half the day is gone. The deck either goes out late, or it goes out with a number the marketing manager is not sure about.
Coupler.io keeps data refreshed across all connected channels on a set schedule, with column names and date formats already normalized. This is how to replace manual marketing reports with Claude without needing an analyst on call. A marketing manager adds the context Claude needs (what the quarter’s goals were, what shifted, etc.), and asks for a board-ready slide narrative. This way, they can build marketing dashboards with Claude. The deck is ready before the analyst ticket would have been acknowledged.

Head of growth: the funnel leak found before the budget meeting, not after
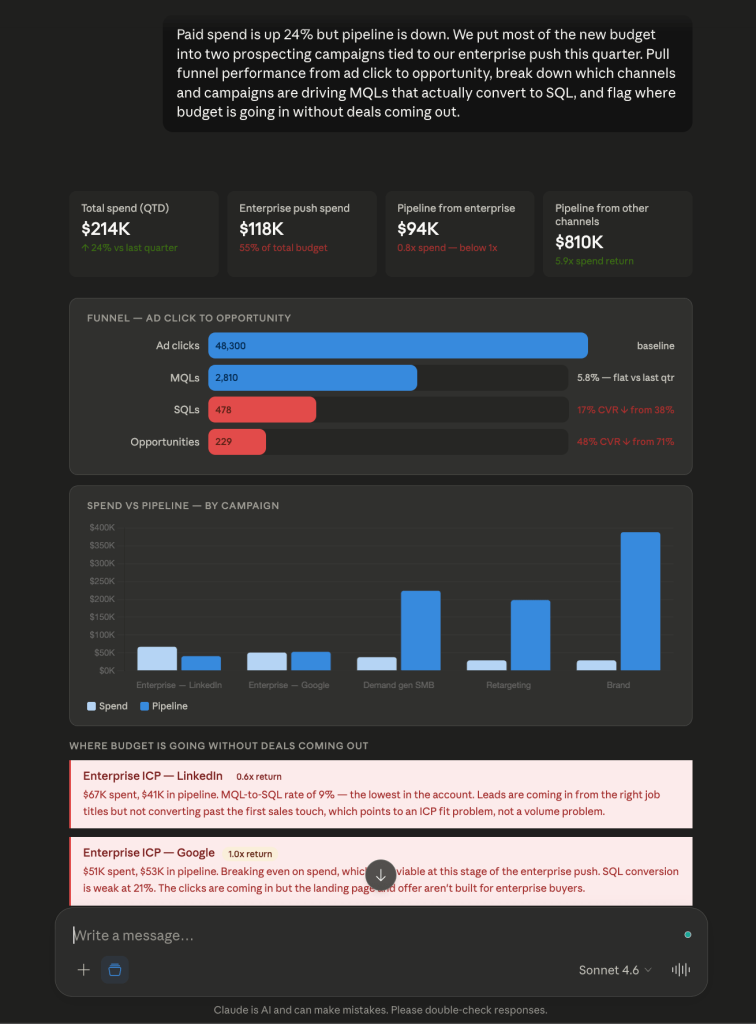
A head of growth is accountable for the whole funnel, but the data rarely tells a clean story across it. Paid performance lives in one tool, CRM conversion rates in another, product activation data somewhere else. If the head of growth chooses to pull it all together manually, it will take days. And the budget call waits for no one.
With Coupler.io connected to Claude, a head of growth can automate conversion funnel reporting across paid, CRM, and product data before the meeting starts. They ask where conversion drops between stages, which channels are underperforming relative to spend, and which campaigns are eating budget without closing deals. They also add the business context in plain language (what initiatives are tied to which campaigns or where growth was expected) and Claude surfaces the pattern. The budget conversation shifts from explaining what happened to making the case for what’s next.

Automate marketing reporting in Claude with Coupler.io
Get started for freeAI-powered marketing performance tracking: how Coupler.io keeps your data secure
The first question most teams ask when they need to connect their business data to an AI tool is a reasonable one: Who else can see this?
With Coupler.io, the MCP channel is read-only. Claude can query your data and analyze it, but it can’t write to, modify, or move it anywhere. The connection runs over HTTPS with token-based authentication, so there’s no open pipeline sitting around waiting to be exploited.
On the compliance side, Coupler.io is SOC 2 Type II certified and compliant with GDPR, HIPAA, and DORA. That matters if you’re in a regulated industry, and it matters even if you’re not, because it means the security controls have been independently tested, not only written into the terms of service.
One more important thing worth emphasizing: you decide what data the AI can see. You control which sources you connect and which datasets get passed through. Claude only sees what you’ve explicitly made available.