How I Cut PPC Reporting Time by 60% with a Verified AI Analysis Workflow

A million dollars a month in Meta Ads. That’s what I manage for a single B2B SaaS client at Right Percent. At that spend level, a slow CPL report wastes both time and budget. But with Coupler.io and Claude, I cut reporting time by 60% and brought daily campaign reviews under 10 minutes. No custom code or enterprise data team. I’m pleased to share how my workflow works and how you can set up something similar for your own campaigns.
The problem: Lots of manual work in the old workflow
Before my current setup, reporting ran through Supermetrics and manual spreadsheet work. Getting a clear read on campaign performance meant pulling data from multiple sources and stitching numbers together by hand. That process was fine when ad spend was lower, and the pace of change was manageable.
But at $40,000+ in daily spend across 50+ live ads, the old Supermetrics-based workflow couldn’t keep up. Daily CPL monitoring, creative fatigue checks, weekly stakeholder reports, forecasting, and test analysis all required manual data work. Each task ate up time I didn’t have, and delays meant missed signals. A declining ad could waste $5,000+ before anyone noticed.
The problem was not the lack of analytical skill. The mechanics of getting answers were just too slow for the speed at which campaigns actually moved.
The solution: Reporting based on Coupler.io and Claude
I connected my Meta Ads data (Facebook Ads and Instagram Ads) using Coupler.io’s data integration with Claude.
This is not a case of dumping raw CSV exports into an AI chat window. That approach can produce confident-sounding answers that are numerically wrong, which is a serious problem when you’re making budget decisions.
The key difference from a typical AI analytics setup: Coupler.io’s Analytical Engine sits between the data and Claude.
It provides Claude with the data structure (column names, data types, sample rows) so the model understands what’s available without loading the full dataset into its context window. When I ask a question in plain language, Claude generates a query and sends it to Coupler.io. The Analytical Engine executes that query, runs the actual calculations, validates the output, and sends back only verified results.
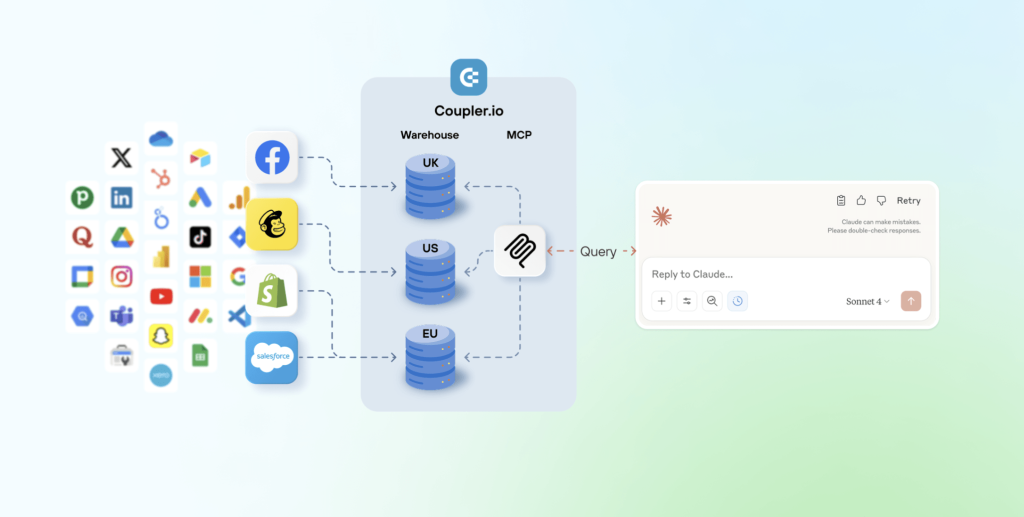
I’m not getting AI’s best guess. Coupler.io does the actual math. Claude just helps me ask the right questions and understand the results conversationally.
Claude handles the conversation and the interpretation. Coupler.io handles the computation and validation. The numbers come from executed queries, not from the LLM guessing at patterns.
This same architecture isn’t locked to my specific stack. Coupler.io connects to over 400 data sources, so whether your data lives in Facebook Ads, Google Analytics, Google Ads, or a CRM, the same analytical layer applies.

Integrate data from 400+ sources with AI using Coupler.io
Get started for freeFour ways to use AI analytics in daily PPC work
I use this Facebook Ads to Claude setup across my entire reporting and analysis workflow for different tasks.
Preparing stakeholder updates faster
Weekly check-ins with clients and executives require clear narratives backed by reliable numbers. Previously, this meant hours of building slides and formatting numbers before I could even start thinking about what the data meant.
Now I use templated reports saved as Claude artifacts. I update them with fresh data from Coupler.io, then add my own strategic context and interpretation on top.
This works regardless of who you’re reporting to, whether that’s a client, a CMO, or a cross-functional team. The time savings come from automating the data assembly so you can focus on the analysis.
Rather than madly hacking data together, I can actually spend time strategically thinking about what’s going on.
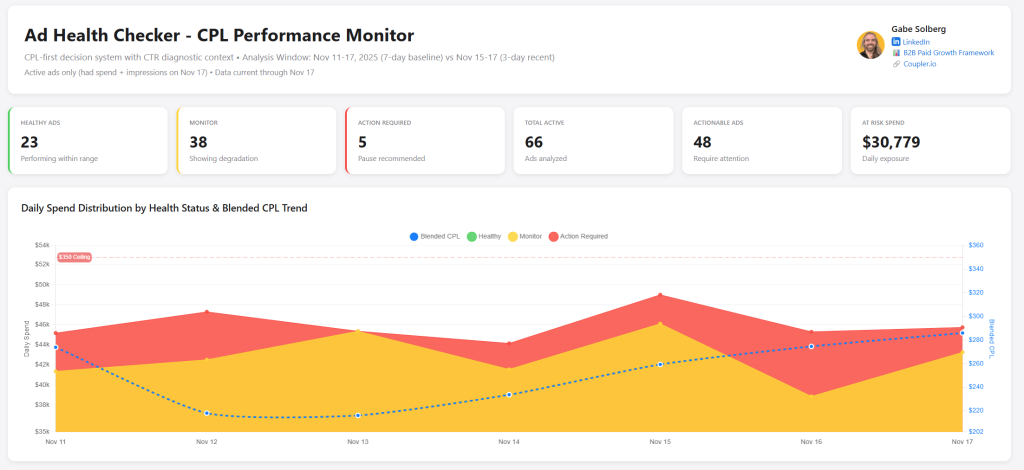
Spotting creative fatigue earlier
Meta’s algorithm will keep spending on yesterday’s best-performing ads even as they decline. At high daily spend, a single fatiguing ad can burn through thousands of dollars before the standard 7-day reporting window catches it.
I run a rolling 7-day and 3-day fatigue analysis that detects early downward trends faster than static lookback periods. I pause declining ads sooner, preventing wasted spend on creatives that the platform wouldn’t flag quickly enough on its own.
The same detection approach works for any channel where creative rotation matters, including Facebook and Instagram Ads, Google Ads, TikTok Ads, and LinkedIn Ads. If your ads have a shelf life, this kind of rolling analysis will catch the decline earlier.
Building an analysis library that compounds over time
Most reporting workflows have a rebuild problem. You do the same analysis every week, but you start from scratch each time because the query or the format lives in your head.
I solved this by maintaining a library of saved artifacts inside my Claude project. Each artifact includes the output and the logic behind it, saved with a naming convention so I can find it later. When I need to rerun an analysis with fresh data, I ask Claude to list my project artifacts, pick the right one, and rerun it on the spot.
This is where the setup stops being a single time-saver and becomes a compounding one. Every analysis I build once is available for reuse later. Over weeks and months, the library grows and the time spent rebuilding queries drops to near zero. Any team using Coupler.io Claude integrations can build the same kind of library from their own recurring analyses.
Answering “what happened?” questions on the spot
Meetings generate questions like “What happened to CPL last Tuesday?” or “Why did that campaign spike and then drop?” Before this setup, answering those questions meant going back to spreadsheets, pulling the right date range, and manually working through the data.
Now I write the business context and my hypotheses in plain language, then use Claude to generate the analysis grounded in Coupler.io-queried data. Structured performance data combined with unstructured business context produces analysis that’s both fast and decision-ready.
This is the use case that’s hardest to replicate with dashboards alone. Dashboards show you pre-built views. Ad hoc lookback analysis answers the question you didn’t know you’d need to ask until someone asked it in a meeting. With Coupler.io, you can ask Claude to check the fresh data and get answers in seconds.
These four areas cover the biggest time savings, but my full workflow also includes daily CPL health checks, controlled test analysis, and financial forecasting for stakeholders. Read the complete case study breakdown with all seven use cases.
What makes the AI output trustworthy
Faster reporting only matters if the numbers can be trusted.
When you upload a CSV to an AI chat and ask for insights, the model works with whatever data it can hold in its context window. It can produce an analysis that reads well but is numerically wrong. For a marketer making budget decisions on $1M+ in monthly spend, that’s a real business risk.
My workflow avoids this by design. Coupler.io’s Analytical Engine executes queries, runs the actual calculations, and validates the results before sending them back. Claude’s role is to help Gabe ask the right questions and interpret the verified answers in plain language.
I didn’t have to configure custom guardrails or build validation scripts. This verification layer is built into how Coupler.io works with Claude. That mattered to me because I needed something I could trust from day one, not a system I had to debug for weeks before relying on it.
I also spot-check totals against source data and use Claude Opus with extended thinking for more rigorous analysis. The system is designed so the math is always auditable, and I add my own domain expertise on top.
Where to start if reporting is your bottleneck
With over 14 years of experience across Meta, LinkedIn, and Google Ads, I’m confident about this:
Performance marketing is not and never was a static workflow. Being able to connect my performance data across sources to an LLM with Coupler.io creates a truly dynamic AI workflow across reporting, analysis, and forecasting that not only makes me faster but exponentially better at what I do…I like to call this vibe reporting.
If your team spends more time collecting and formatting numbers than acting on them, the first step is not another dashboard. It’s a reporting process that gives you trusted answers faster.
My recommendation: pick the one recurring report that takes you the longest and connect that data source through Coupler.io. Whether your data lives in Facebook Ads, Google Analytics, Google Ads, or a CRM, Coupler.io connects to 400+ sources with the same analytical layer and validation process.
Not a fan of Claude? You’re not locked into a single model. Coupler.io also provides data integration with LLMs, including ChatGPT, Gemini, and Cursor. If you’d rather skip external tools entirely, then talk to your data via LLMs using Coupler.io’s AI Agent. It runs inside the platform itself and queries your data directly.
See how fast you get an answer you trust. Then build from there. If you want a more detailed walkthrough of the full setup, I put together a step-by-step course covering everything from connecting your data to building your first reusable analysis templates.