Every agency has a version of the same Monday. A dozen clients, each with data scattered across Google Ads, Facebook Ads, Google Analytics, and a CRM, and every one of them expecting a report that makes the numbers mean something. So you export, clean, combine, format, and update. Then you do it again for the next account. Two weeks later, you repeat the routine because the figures have already moved. That cycle is where an agency’s margin quietly leaks. Hours go into assembling reports that could be spent improving the campaigns the reports are supposed to cover. And the more clients you win, the worse it gets.
Automated reporting for clients breaks the loop. Instead of rebuilding every report by hand, you set up a workflow once that pulls the data, prepares it, delivers it, and refreshes it on a schedule. With Coupler.io, you go a step further: describe the report you need in plain language, let AI build the data flow behind it, and reuse that setup across your whole roster. And your team gets its week back for the work clients pay for.
What is automated client reporting?
The clearest way to picture automated client reporting is to look at an agency already running it. ClaritySeed set up flows from Google Ads, Facebook Ads, and GA4 into Google Sheets on Coupler.io once, and its client reports now refresh on their own every day, saving more than 40 hours a month and getting reports to clients five hours earlier than before. Underneath a result like that, it comes down to four moving parts.
- Your client data sources are where the numbers live, spread across marketing platforms and business apps.
- Preparation is the step that blends and standardizes these data.
- A reporting destination puts the result in front of the client.
- And an automatic refresh keeps it up to date without anyone touching it.
Put those four together, and automated client reporting simply means the report assembles and updates itself on schedule, without the manual grind.

What the client actually receives depends on how they like to work. It might be a live dashboard link, a scheduled email, a shared Google Sheet, or a white-labeled portal carrying your branding.
On the agency side, the setup produces one reusable template per report type, so nothing gets rebuilt each cycle and the account team gets its time back for the campaigns behind the numbers. The report then goes out on schedule whether or not anyone remembers to send it. What’s changed recently is the way you put those four parts together in the first place.
Manual setup vs. AI-assisted setup
The key part is how you get from source to finished report, because there are two routes: build it by hand, or describe it and let AI set it up. Here’s how they compare.
| Step | Manual reporting | AI-assisted with Coupler.io |
| Define the report | Decide the metrics and layout yourself | Describe what you want in plain language |
| Connect the data | Open the tool and connect each source by hand | AI creates and configures the data integration (you authorize each source only the first time it is connected) |
| Set fields and settings | Pick fields, set the date range, match how each metric is named in the API | AI applies them straight from your request |
| Build the layout | Assemble the structure from scratch | AI generates it from your request |
| Keep it fresh | Set and babysit the refresh | Schedule once, and it refreshes itself |
The manual route gets the job done, but every step is a place where time disappears, or human error sneaks in. The AI-assisted route strips most of that out, which is why reporting automation has become realistic for agencies without a data engineer on staff.
Why a standalone AI tool isn’t the answer either
If right now you’re thinking “I could just drop a spreadsheet into ChatGPT/Claude/etc.,” here’s what an AI tool can’t do for you:
- It guesses at the math instead of calculating it, so the numbers you’d put in front of a client are its best estimate, not a fact.
- It works from a one-time copy of your data, so nothing stays up to date.
- It forgets the setup the moment the chat closes, so every report starts from zero.
Coupler.io does the actual calculations, refreshes the data on schedule, and keeps the workflow reusable across clients. You get AI that stands up a real, running data integration, not a one-off answer you have to check by hand before it reaches a client.


Describe your client report and let Coupler AI build it
Book a demoHow to automate reporting for clients with Coupler.io
You describe the client report you want in one plain-language request, let AI set up the data flow behind it, and use the resulting data in reporting tools (e.g., Google Sheets or BI dashboards). You skip the settings screens and the field names. Behind that request, Coupler AI connects to the marketing platforms you already run and builds the data integration that keeps the report fed with fresh data.
Let Coupler AI do the data work for you
Tell Coupler AI what you need to know, from which source, and how often. It connects your account, sets up the data flow, keeps it refreshed, and lets you analyze the results inside Coupler.io or another AI tool.
Try for free

To handle specific tasks and ensure your data is analysis-ready, Coupler.io uses its AI skills for reporting. Context adds the business rules and metric definitions the AI needs to interpret your data correctly, so a “conversion” or ROAS is read with your definition, not a generic one. The report holds up when a client sees it, and your time goes to what it says without the need to check the basics. At its core, the setup is one step: describe the report you need and get it back. From there, you refine or edit it whenever the client’s needs change. That’s what it takes to automate reporting for clients end to end. Here’s how it works in practice.
Tell Coupler AI what report you need and let AI set it up
Start by describing the report the way you’d explain it to a teammate:
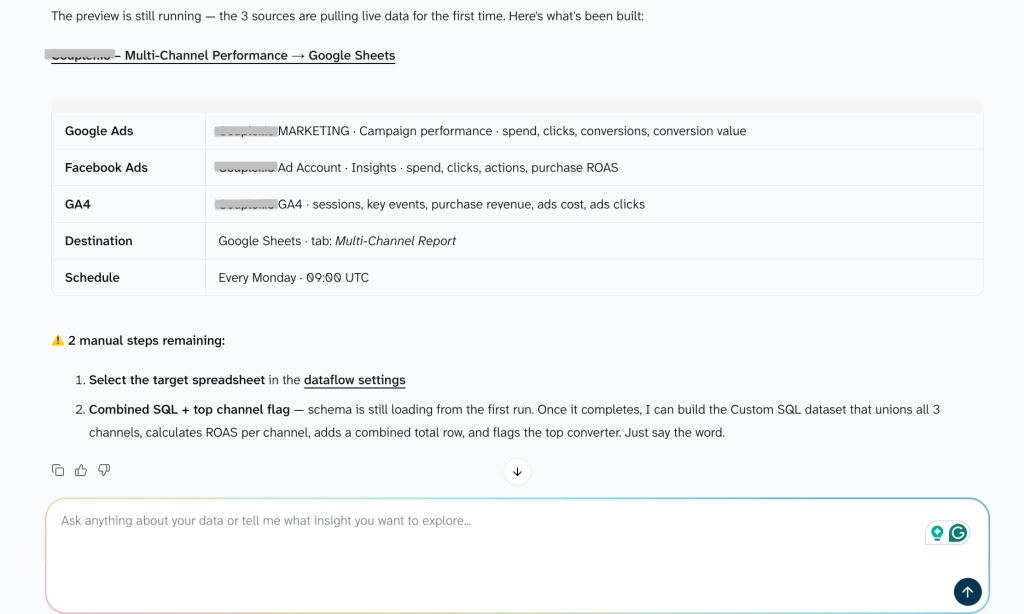
“Create a weekly performance report for Client X that combines Google Ads, Facebook Ads, and GA4. Show spend, clicks, conversions, and ROAS for each channel, plus a combined total, and flag which channel drove the most conversions. Send it to Google Sheets and refresh it every Monday.“
Depending on your business routine, ask the AI Agent to combine other platforms and blend their data the way you need, on the refresh schedule you choose.
The AI reads that and gets to work on the data flow behind it. You didn’t open a configuration screen, and you don’t need to know how each platform labels its metrics. For an account manager, that’s the difference between a task you dread and a sentence you type between calls.

Blend every channel into one report
A client’s spend is scattered across Google Ads, Facebook Ads, LinkedIn, and Google Analytics, and each one counts things differently. Tell Coupler AI to blend them into a single report and define how you want the metrics aligned, so the resulting view uses consistent business definitions. This way, you hand the client one comparable view of the whole account. For an agency juggling ten platforms per client, this is where most of the manual work disappears.

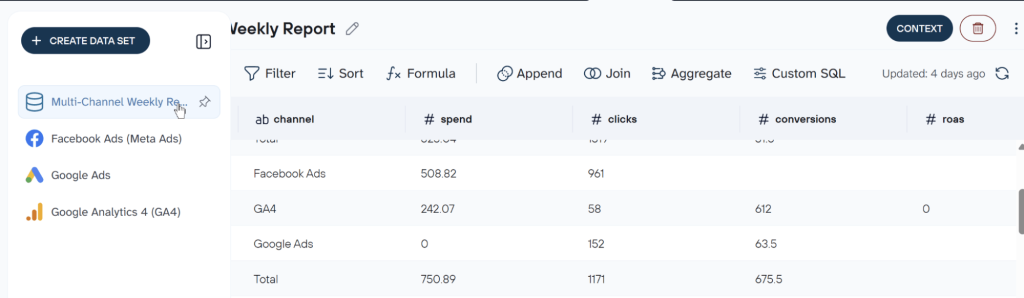
Before anything runs, look over what Coupler AI put together (it provides a link to your data flow in the chat): the source accounts, the fields, the blended metrics, the data destination. If something’s missing or a metric is off, you fix it by saying so. This is what keeps automated reporting trustworthy. You stay the editor, not the data-entry clerk, and the most common source of manual setup errors in a client report is greatly reduced.
Teach AI your definitions once
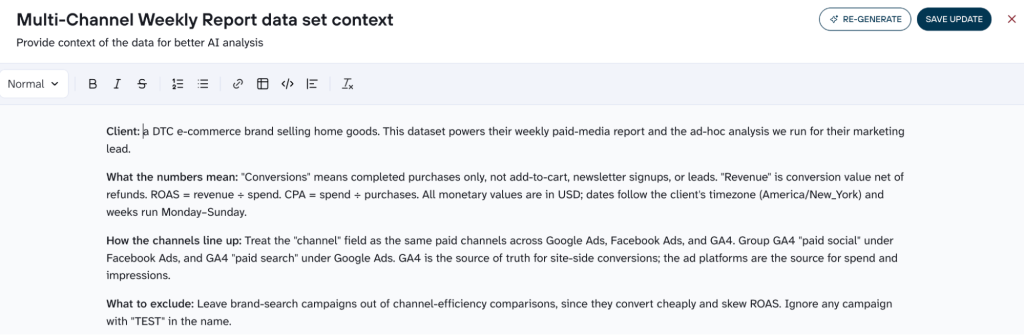
The AI reads the data set on its own: Coupler.io drafts the data context, labeling what each field holds and how the data is structured. You can edit it manually, if needed.
What it can’t guess is your business context, the meaning behind the numbers. So you add that once: which conversion action counts, how channels are grouped, what a custom metric or a “qualified lead” means for this client. From then on, every report and every answer uses your definitions instead of a generic guess, which is also what makes the AI analysis later in the workflow trustworthy.

Deliver it where the client already works
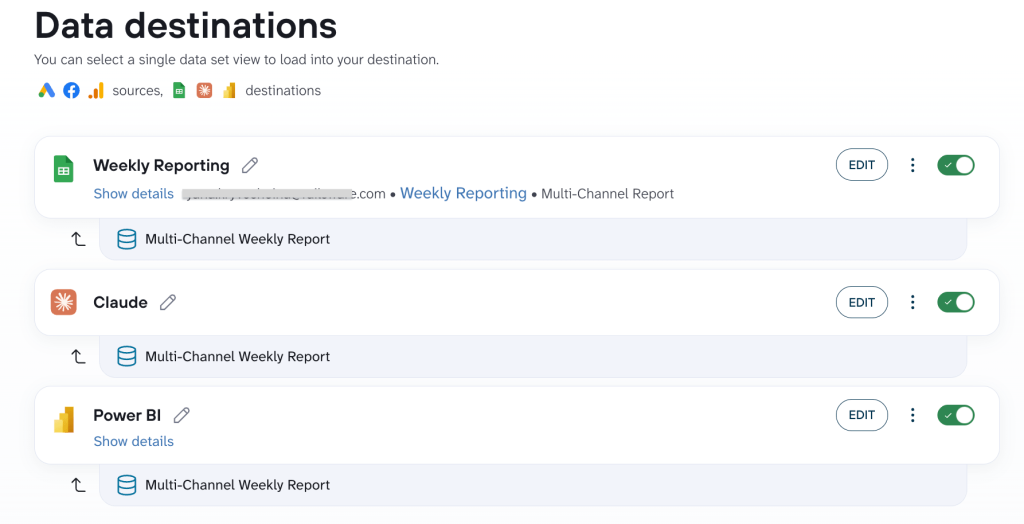
A report earns its keep only when the client actually opens it, so it lands wherever they work. Google Sheets for a quick shared view, Data Studio (formerly Looker Studio), Power BI, or Tableau for interactive dashboards they can filter themselves. A hands-on client who lives in the numbers gets a live dashboard; a busy founder gets a clean weekly sheet with the five KPIs they care about. In this setup, I told Coupler AI to send the report to Google Sheets.

Update it whenever the client’s needs change
Client needs never hold still. This month they want LinkedIn Ads added, or cost per conversion instead of clicks. You describe the change and the AI updates the setup, so the report keeps pace without you rebuilding it. The maintenance that usually piles up between reporting cycles mostly goes away.
Reuse the setup across every client
Two agencies show what that looks like at scale. SellThru runs it on Coupler.io across more than 35 client dashboards, consolidating advertising and analytics data, cutting new-account setup from at least two weeks to two or three days, holding performance tracking above 95% reliability, and saving more than 20 hours a month on reporting and data mapping. Social Unit shows the client-side payoff. After moving its client reporting to Coupler.io with auto-updating cross-channel dashboards, its client questions about results dropped by 60% and data prep fell from two or three days to under 30 minutes, which the agency tied to stronger relationships and lower churn.
When you automate reporting for clients, the real payoff isn’t one report; it’s a reporting system you run across the whole roster. Build a report with AI and reuse it or select one from pre-built dashboard examples, connect the next client’s accounts, and you have a standardized report in minutes.
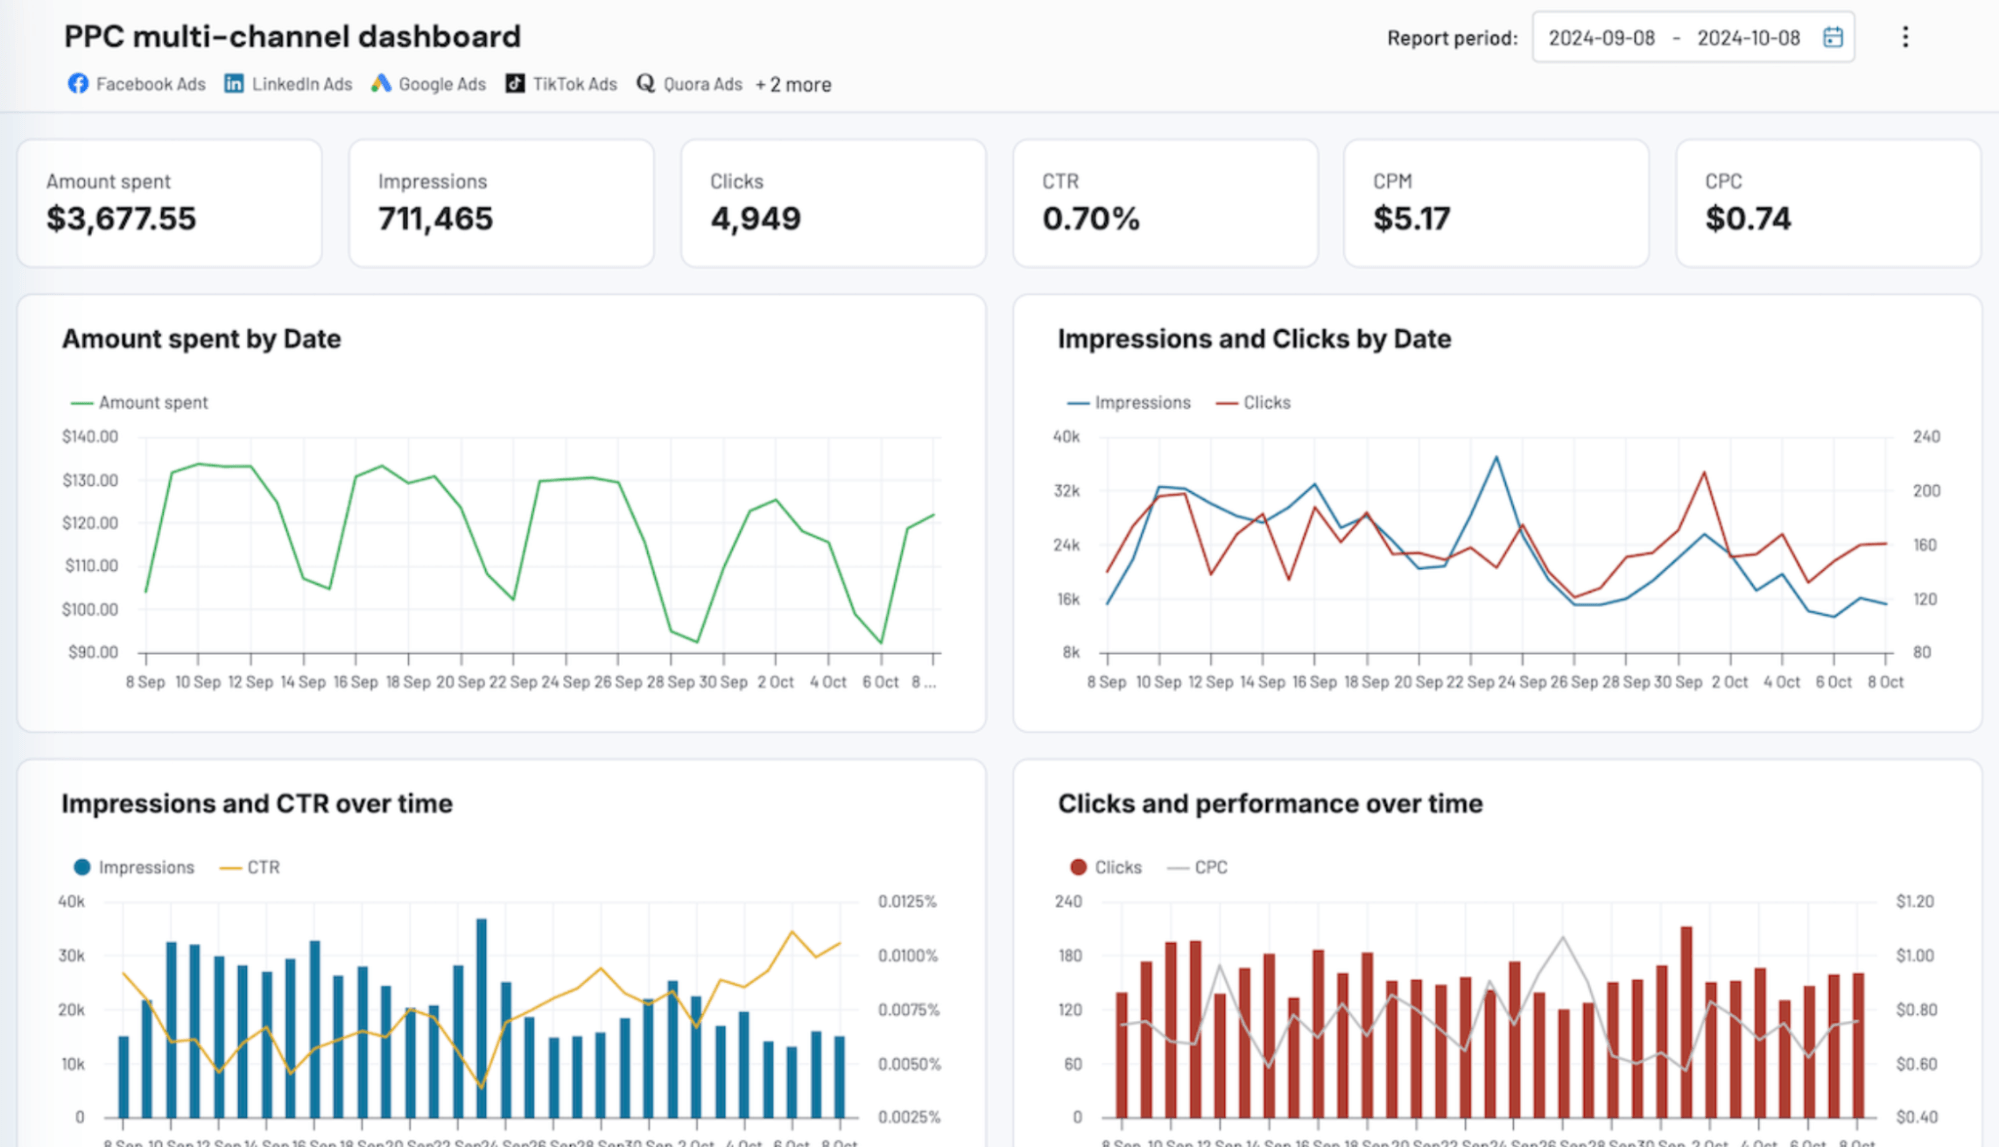
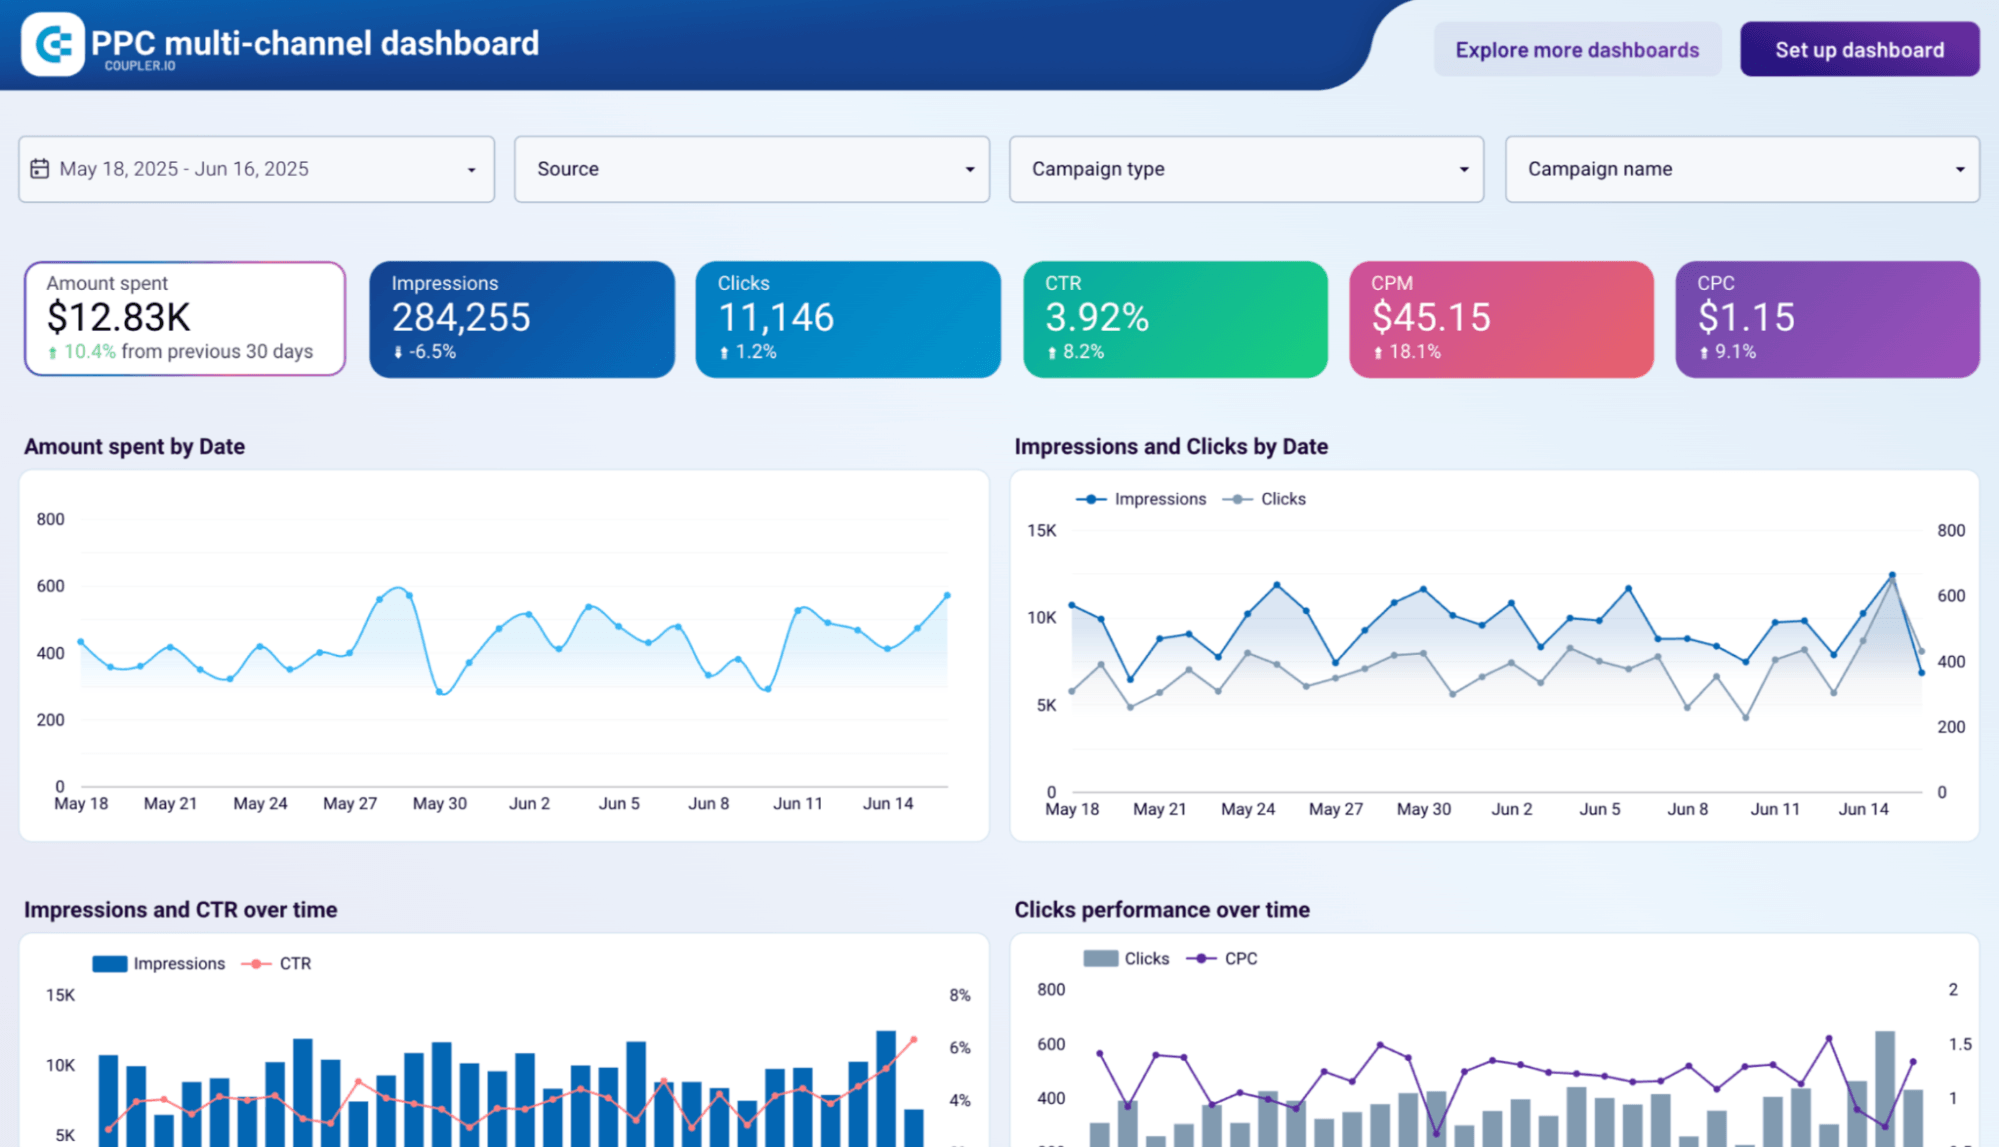
The PPC multi-channel dashboard, for example, pulls Google Ads, Facebook Ads, LinkedIn, and TikTok into one view and comes in Data Studio, Power BI, Tableau, and Google Sheets versions, so the same proven structure fits whatever each client prefers. Consistent client reports across every account make your marketing agency reporting look considered, which quietly supports client retention.





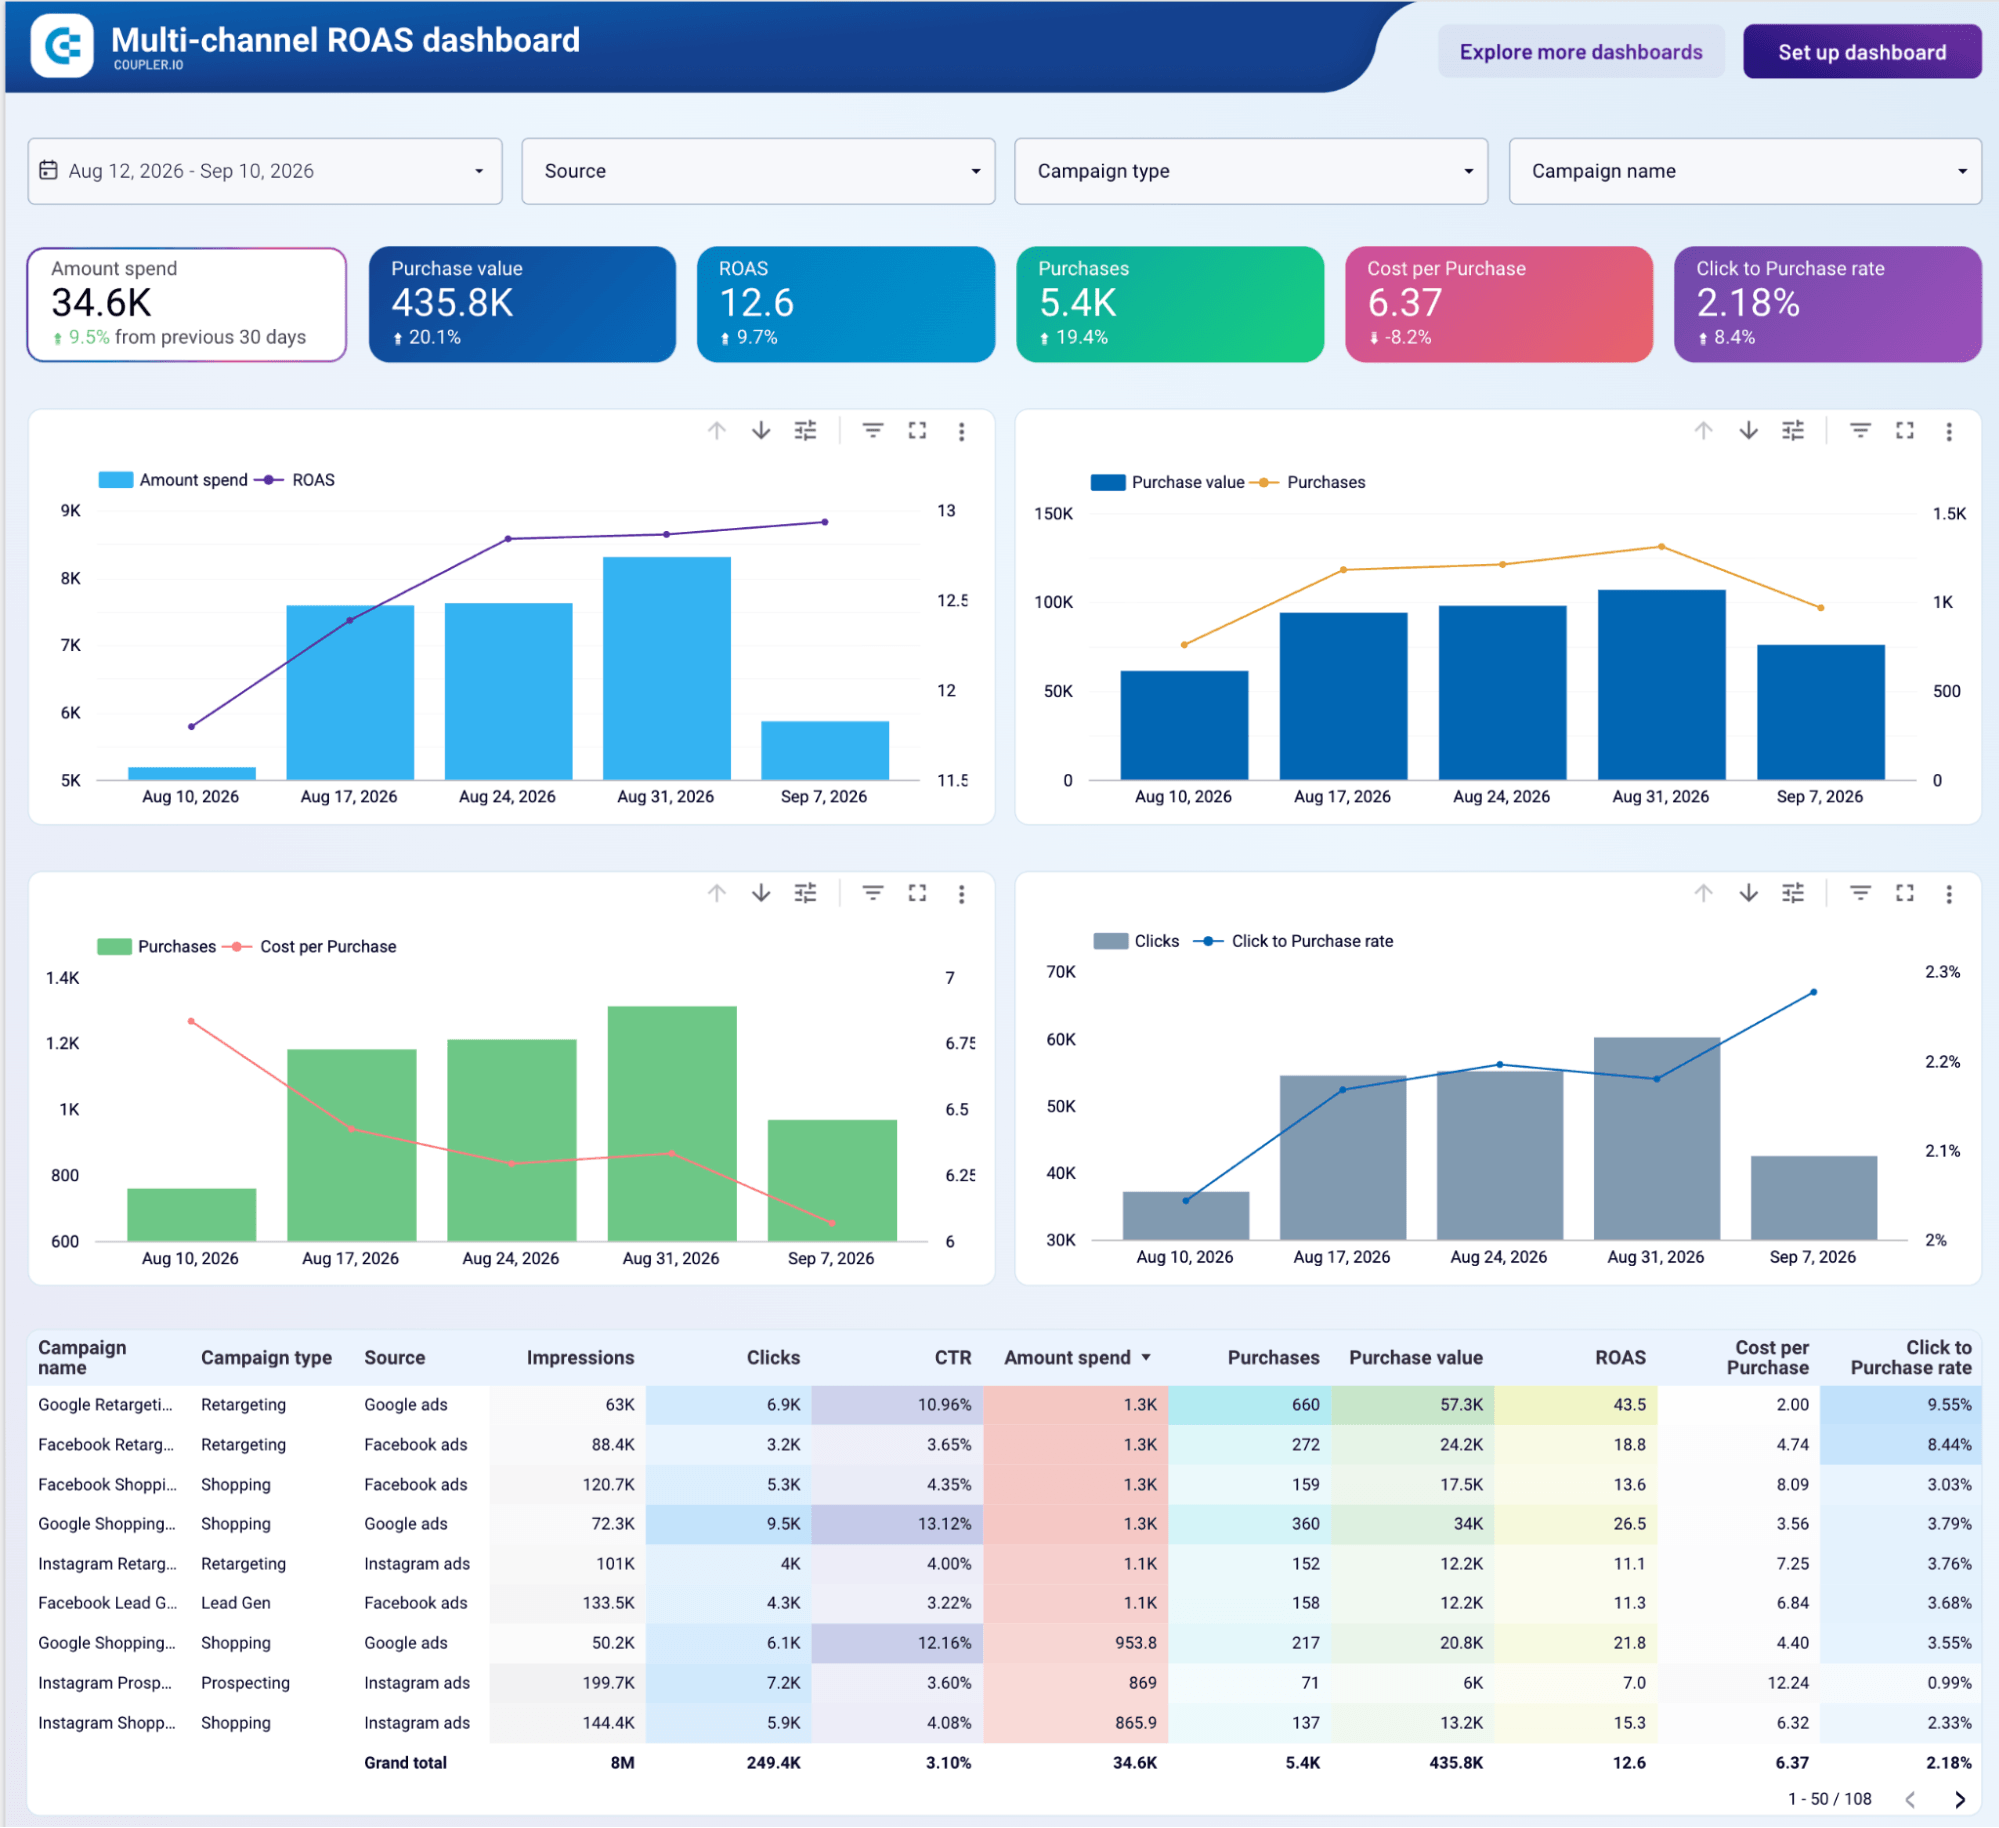
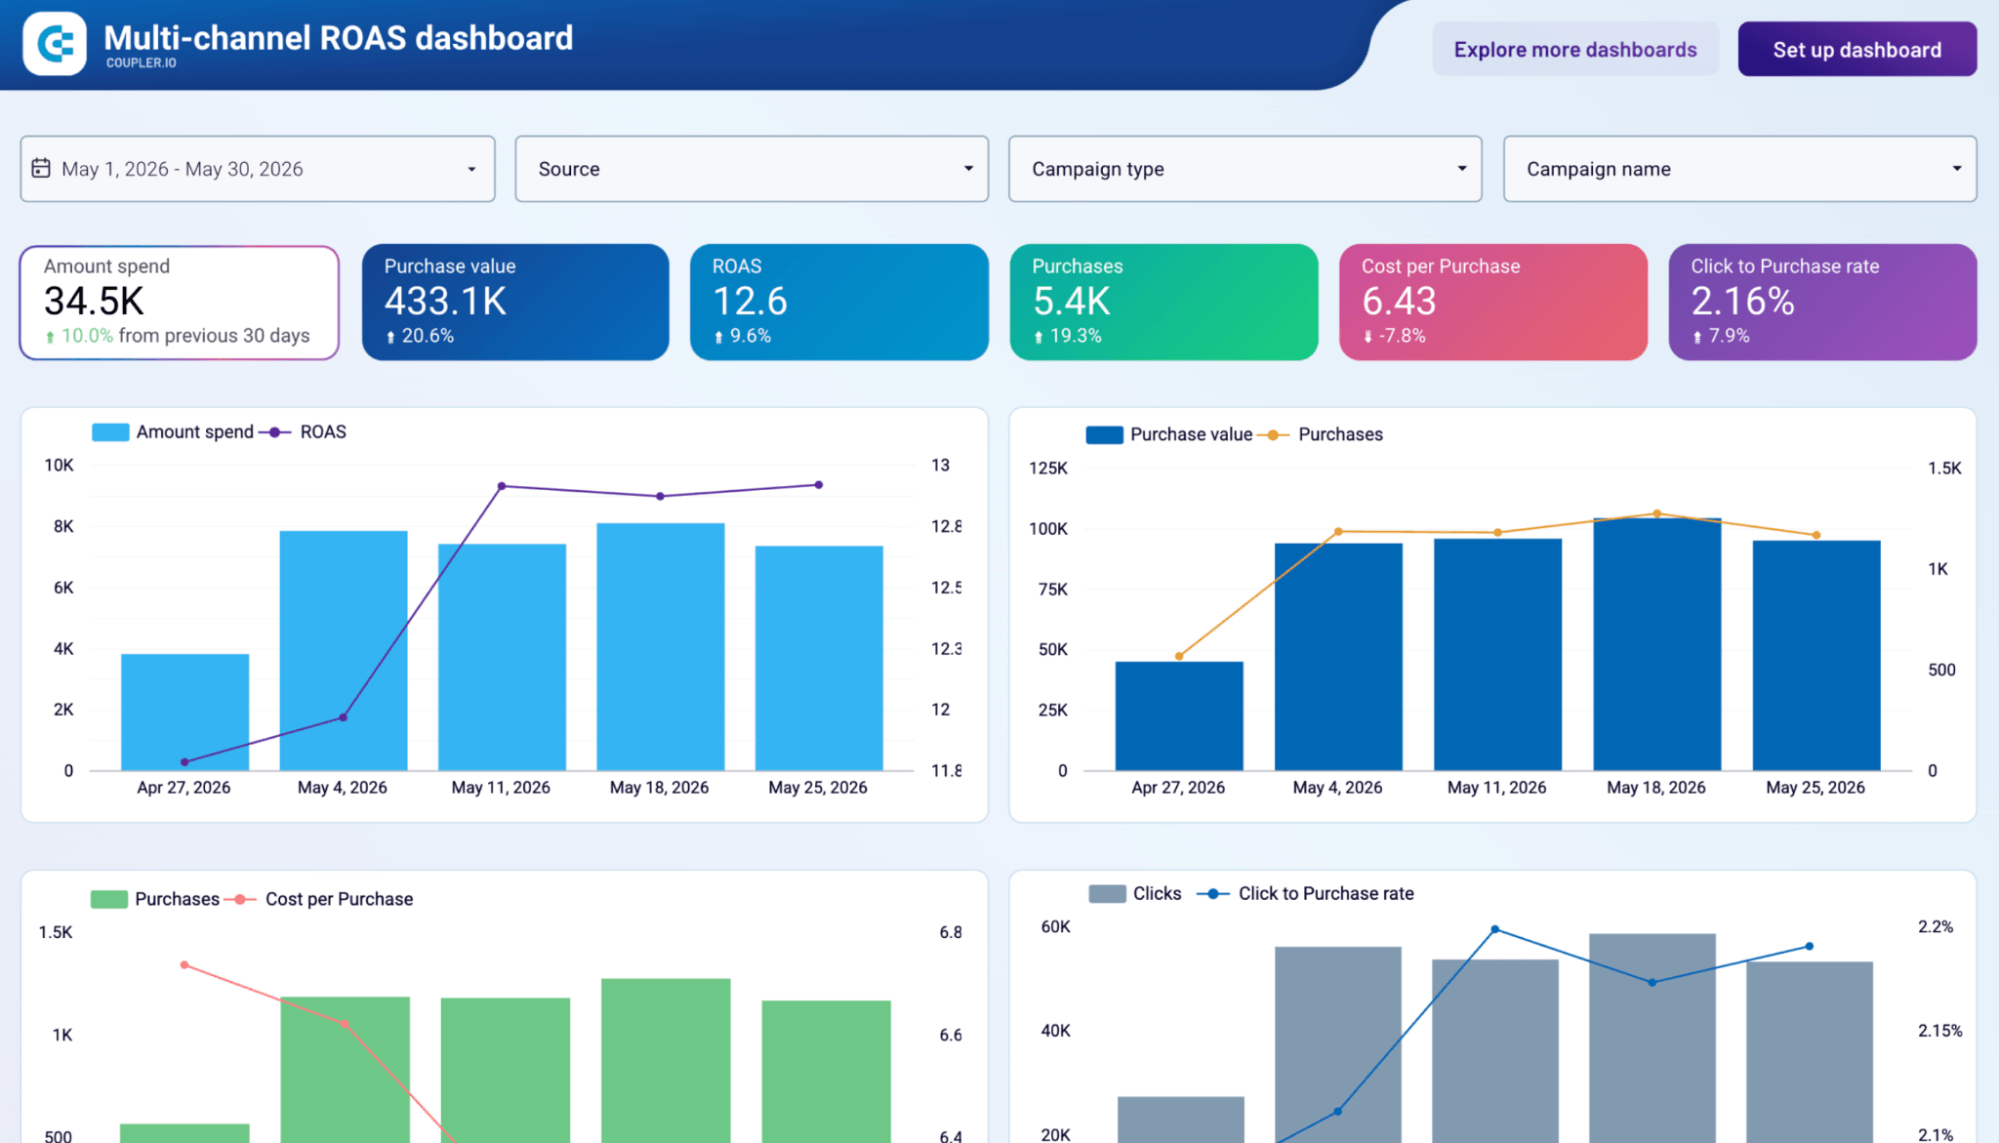
The multi-channel ROAS dashboard centers on the number most clients ask about first: the return they get for what they spend. It pulls revenue and ad spend from every platform a client advertises on and sets return on ad spend side by side across channels. That makes it easy to see which channels carry the account and which quietly drain budget. When a client asks why results moved, the answer sits on the page. It’s a strong fit for performance accounts where the monthly review is really a budget conversation.

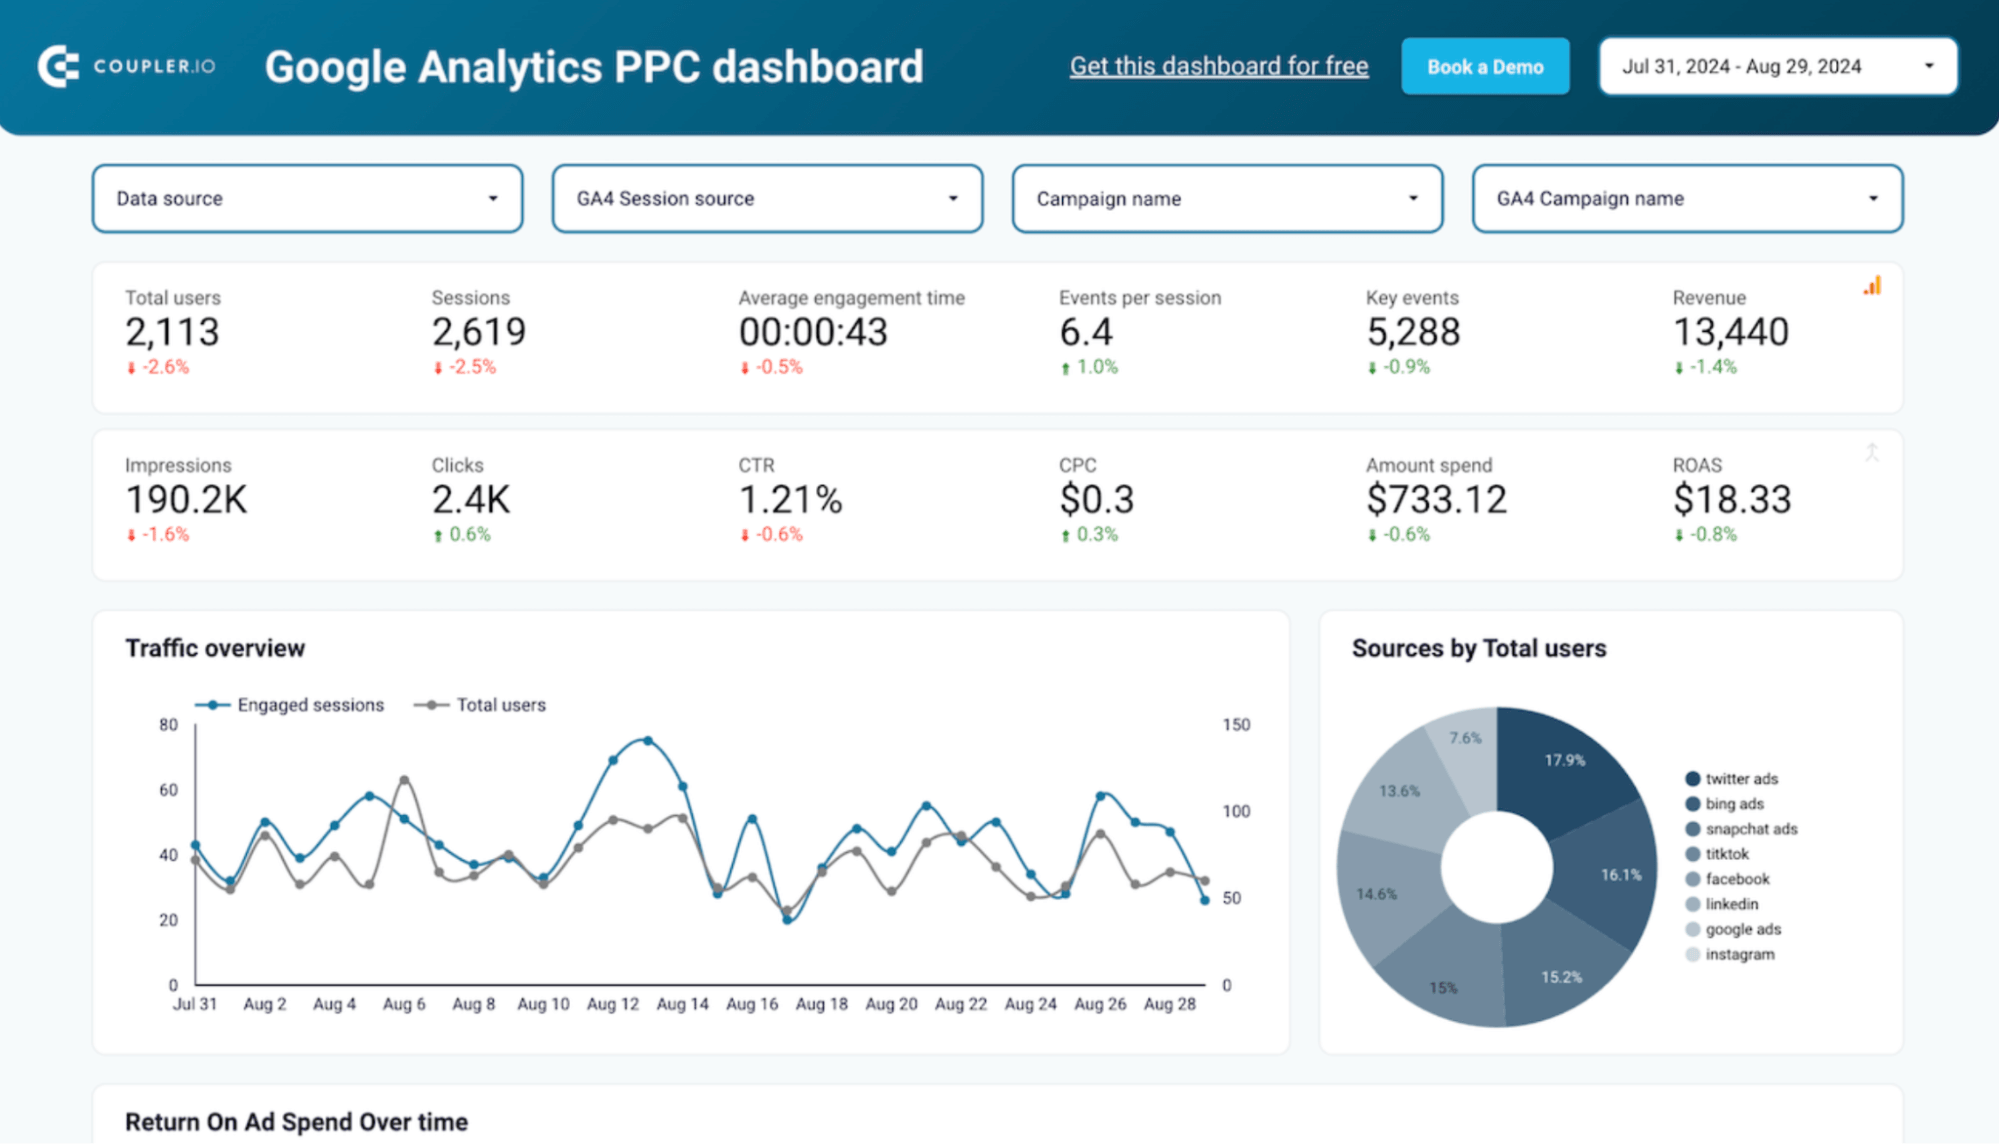
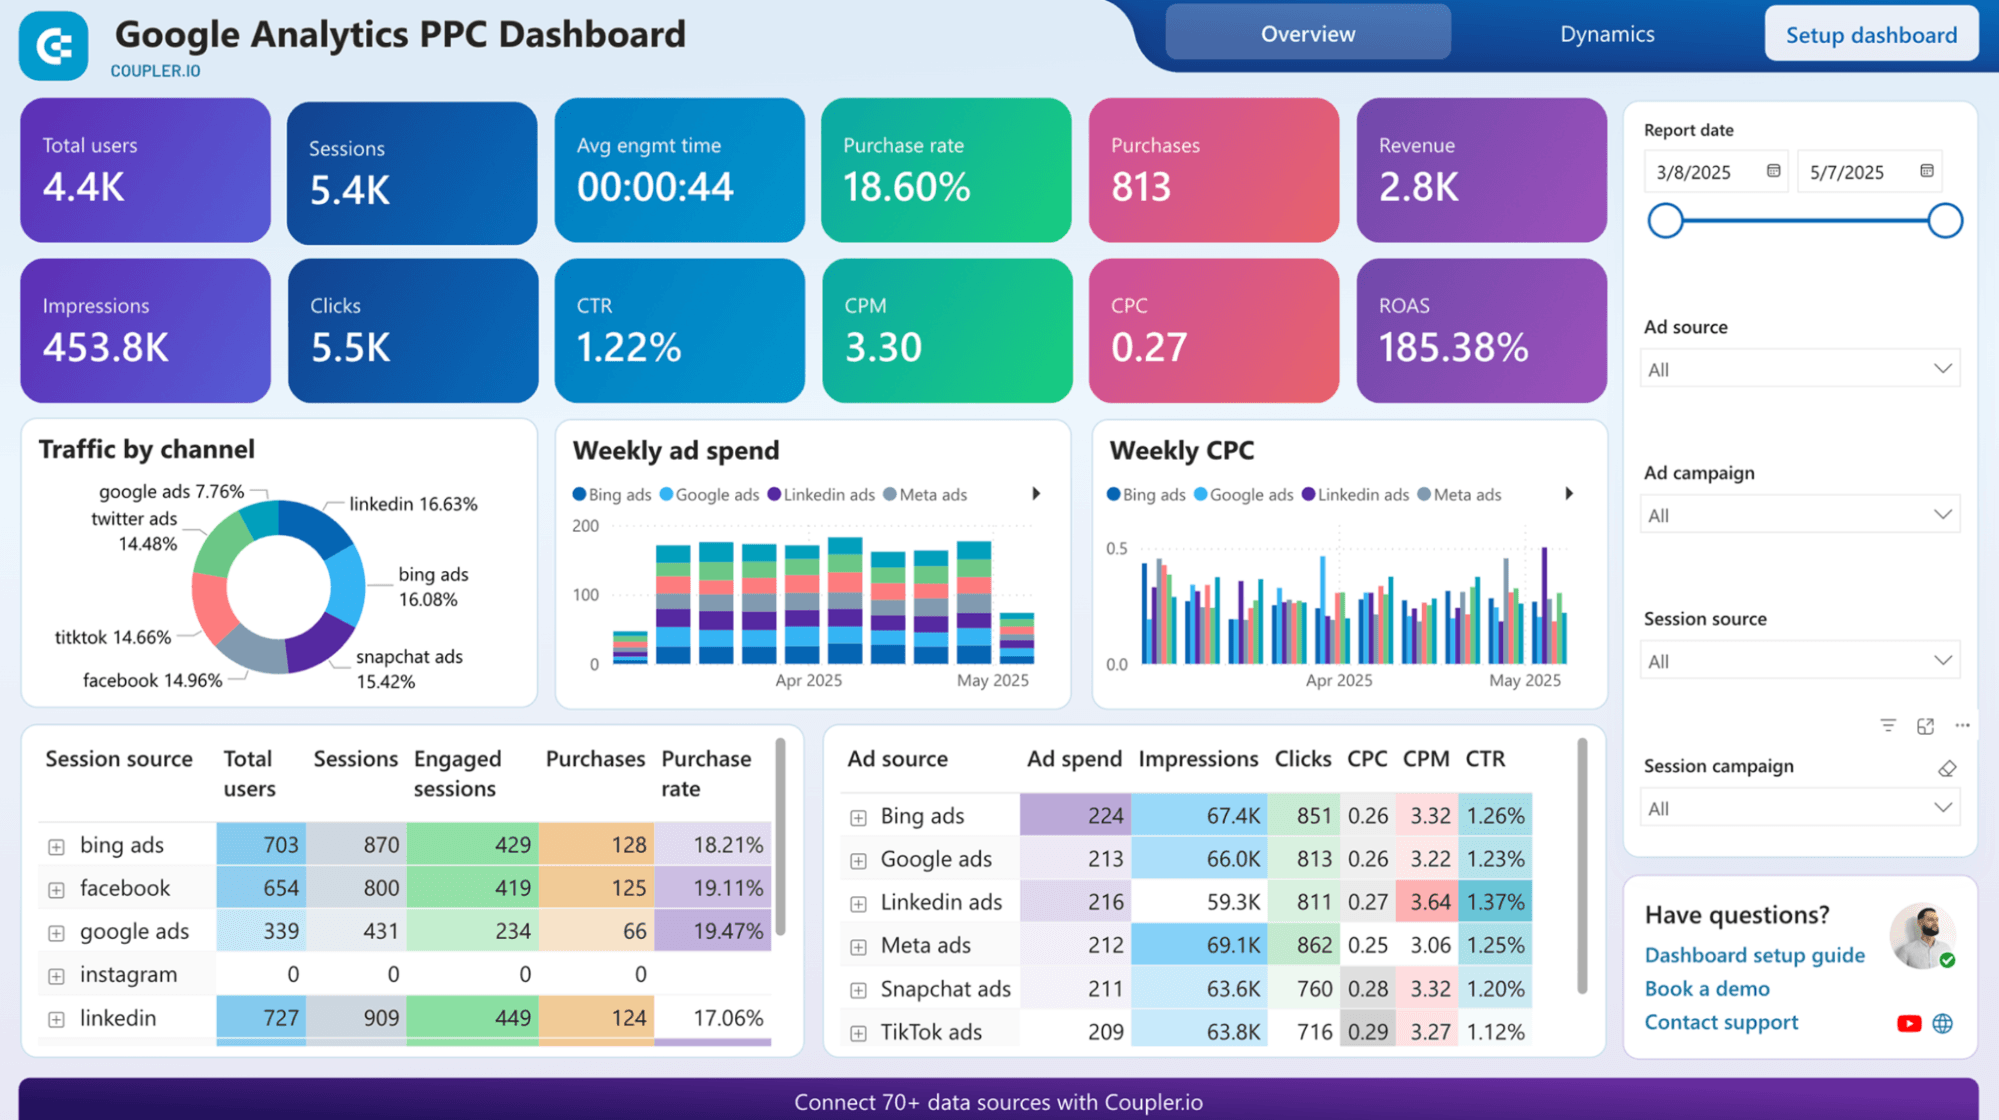
The Google Analytics PPC dashboard connects two halves of the story that usually live apart, what the ads cost and what visitors did once they landed. It brings ad-platform spend together with Google Analytics sessions and conversions, so a click ties to an outcome, not standing as a number on its own. That helps you show a client whether the traffic they paid for actually turned into results. It earns its place when a client questions a channel that looks expensive but drives the conversions that matter. The two sources refresh together, so the ad side and the site side never fall out of sync.




The PPC multi-channel dashboard with budget takes that same cross-channel view and adds the thing clients on a fixed budget watch most closely, pacing. Alongside spend and performance for each platform, it tracks how much of the planned budget has been used and how much is left. A client can see at a glance whether a channel is on track, overspending, or leaving money unspent with days to go. That turns the monthly report into something they can act on mid-cycle. It suits retainers where staying inside an agreed budget is part of the deliverable.
PPC multi-channel dashboard with budget
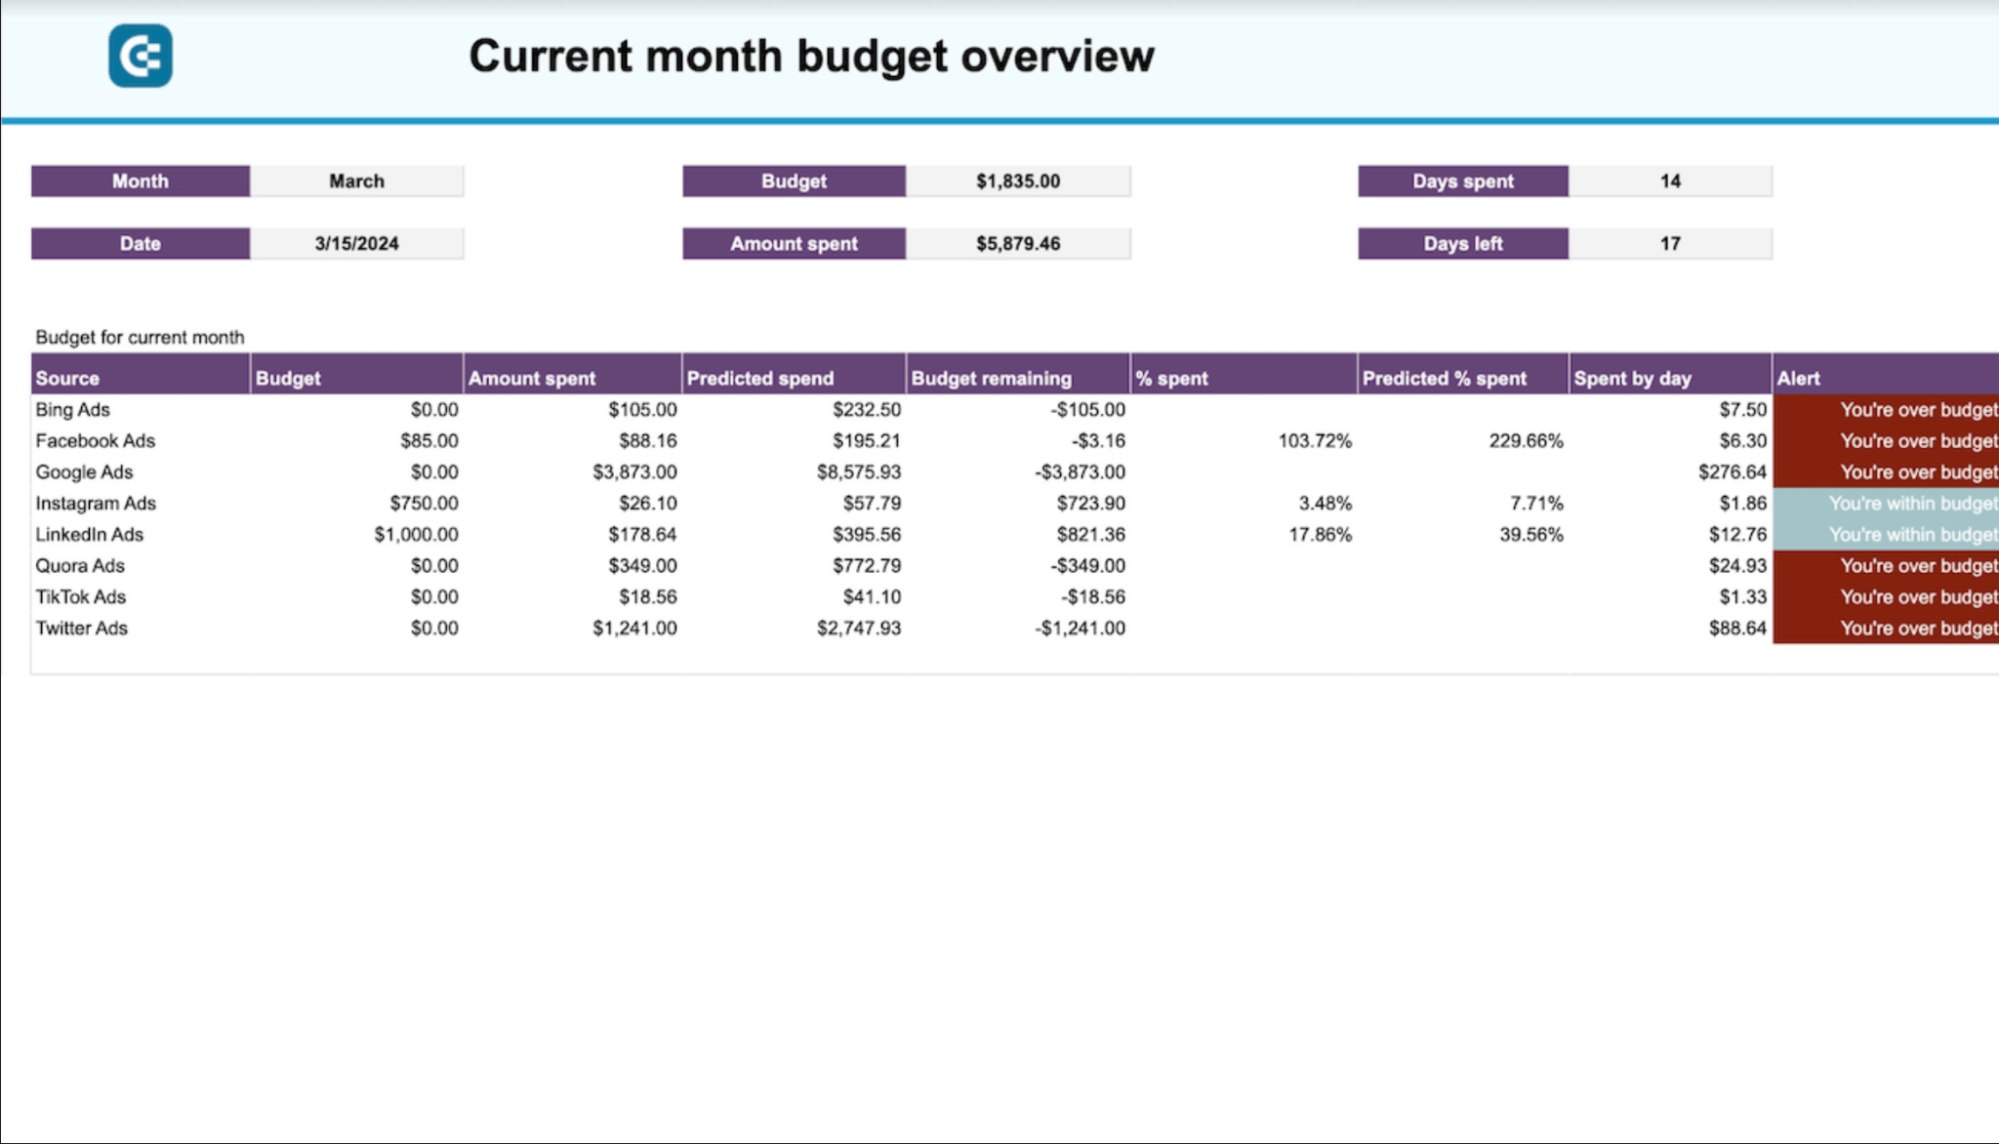
PPC multi-channel dashboard with budget
Preview dashboardThe HubSpot marketing performance dashboard steps outside the ad platforms for clients whose results live in the CRM. It pulls campaign performance, contacts, and deal progress from HubSpot into one marketing view, so you can report on the whole funnel. For a client who cares about pipeline and revenue as much as clicks, it links the marketing effort to what it produced downstream. It works well for B2B accounts where a lead takes weeks to become a deal and the ad numbers alone don’t tell the story. Like the others, it refreshes on schedule once it’s connected.
HubSpot marketing performance dashboard

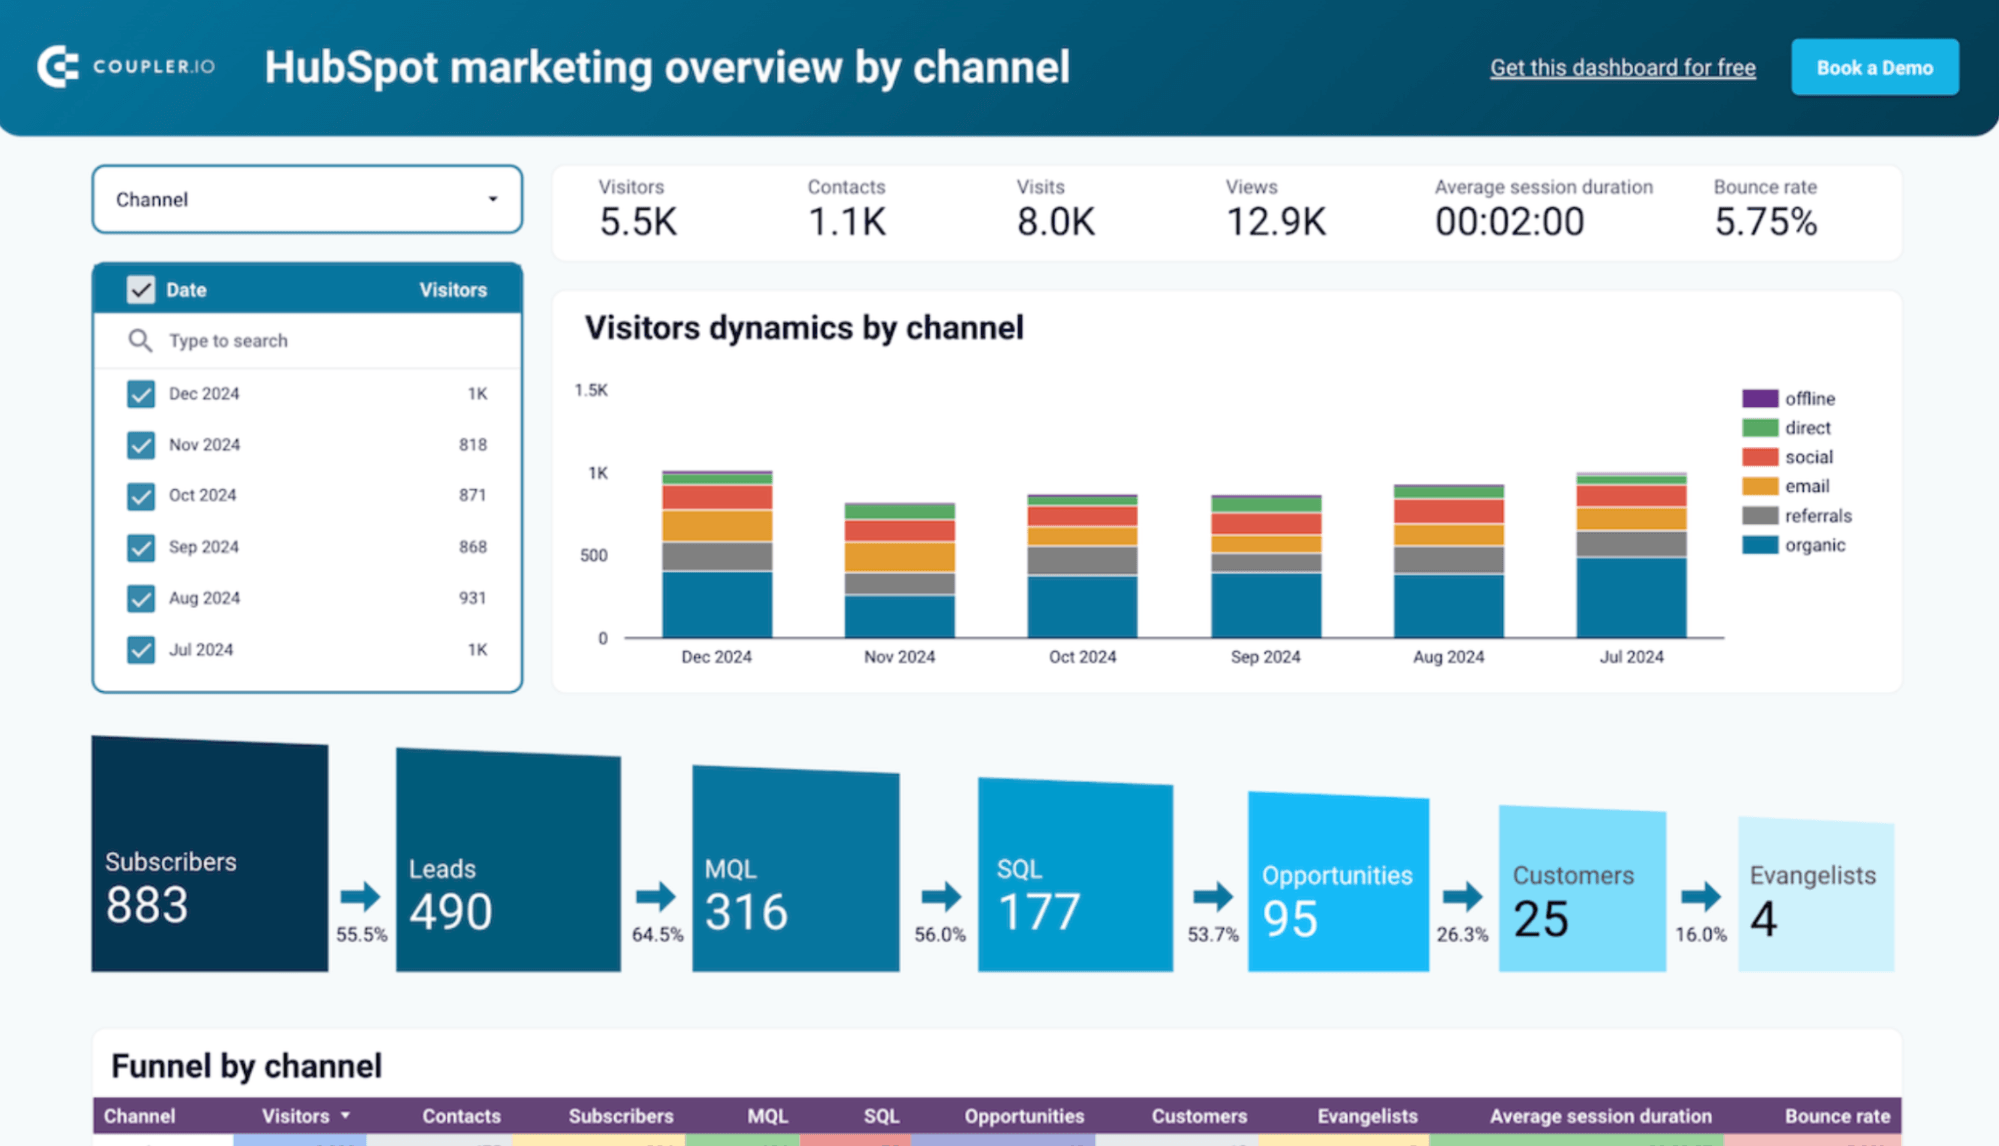
HubSpot marketing performance dashboard
Preview dashboardWhichever one fits a given client, you set the structure up once and reuse it across the roster, so every new account starts from a proven report.
Get answers from your client data in plain language
Try Coupler.io for freeAnalyze your client data and turn it into reports
Getting the data flowing is the first half of the job. Understanding what it means is the second, and this is where AI does more than move numbers around.
Once your marketing data is connected, you can ask questions of it in plain language, either inside Coupler.io or by connecting the same data to Claude or ChatGPT:
- “
Which campaigns drove the biggest increase in conversions this month?“ - “
Why did CPA go up in the last two weeks?“ - “
Compare Meta and Google Ads on conversion rates.“ - “
Which campaigns are spending without generating conversions?“
The reason you can trust the answers comes down to how the math is handled. Coupler.io’s Analytical Engine runs the actual query and calculations against your connected data, then hands the AI clean results to interpret. The model does what it’s good at, spotting patterns and explaining them, while the arithmetic stays out of its hands. That’s a real difference from pasting a spreadsheet into a chatbot and hoping the totals are right. And because the industry skills understand what your metrics mean, the interpretation lands in the language of marketing reporting, not generic data-speak.

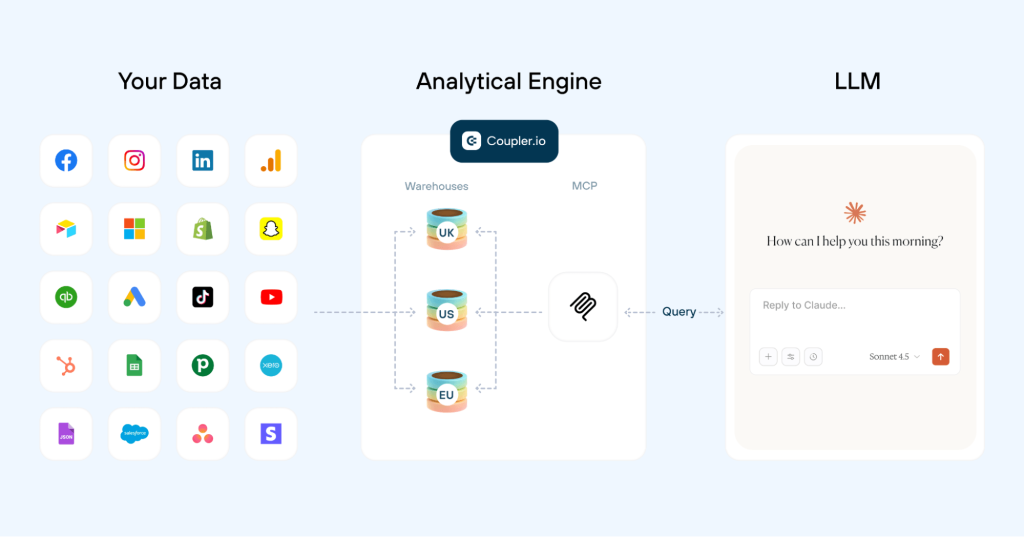
An agency has already put this to work. Gabriel Solberg, a B2B performance marketer at the agency Right Percent, manages more than $1M a month in ad spend across Meta, LinkedIn, and Google Ads. He connected his Ads sources to Claude through Coupler.io and cut his reporting and analysis time by 60%, with daily campaign reviews now taking under 10 minutes instead of hours. His read on why it works:
“I’m not getting AI’s best guess. Coupler.io does the actual math. Claude just helps me ask the right questions and understand the results conversationally.”
Build AI reporting with data you can trust
Book a demoWhat to look for in an automated client reporting tool
When you’re choosing a tool to automate reporting for clients, most work the same way underneath: you connect each source, map the metrics, and assemble the report by hand. Whether these are client reporting tools, a data connector, or a BI platform, that configure-and-connect mechanism is the same one. AI-assisted setup replaces it. You describe the report you need and the AI builds the data flow, so setup becomes a request you make, not a task you work through. Decide which of those two mechanisms you’re buying first, because it shapes everything else on this list.
It helps to see where the familiar names fall. Top client reporting tools like AgencyAnalytics, Whatagraph, and Databox give agencies polished, branded dashboards. Data connectors like Supermetrics pipe marketing data into a destination. Business intelligence platforms like Power BI, Tableau, Data Studio, and Domo deliver deep data visualization once the data lands in a data warehouse. Each does its job well, and each still runs on configure-and-connect.
Coupler.io is built for the other mechanism, describe-and-build, which is why it reads as a different kind of tool rather than a faster version of these. With the mechanism settled, here’s what any serious automated reporting tool should still deliver:
- Source coverage across your clients’ marketing platforms and business apps
- Data transformation and blending, to combine data sources into one coherent report
- Reporting destinations, from spreadsheets to BI tools and client portals
- Refresh frequency and scheduled reports
- Scalability across clients and reusable, customized reporting templates
- White-labeling for a branded client experience
- Access and data controls, so AI and clients see only what they should
- Built-in AI analysis of your marketing data
- Pricing that stays sane as your client roster grows
With Coupler.io, the rest of the checklist comes for free. You get data integration with AI across 400+ sources, blended into one report and delivered wherever the client works. You describe the report once and get it back fresh on schedule, with the data pipeline refreshing itself and the whole setup reused across accounts from a template. That’s what moved Gabriel Solberg off Supermetrics for his analysis work.
Two things matter especially for agencies. White-labeling puts your branding on the report, not a vendor’s, so the insight reads as coming from you. The pricing scales with you, not against you. With Coupler.io, you pay per connected account and add team members, destinations, and AI capabilities without a bigger bill, so your cost holds steady as you spin up more dashboards and seats. As you grow, you move to a custom plan with a dedicated agency partner who handles the migration and the heavier setups for you. SOC 2 Type II, GDPR, and HIPAA compliance are covered on every plan, and per-user access controls keep AI and clients scoped to what they should see.
Best practices for automated reporting for clients
Once you automate reporting for clients, a few habits keep the system trustworthy.
✅ Define the client’s reporting goals before you ask AI to build anything. Automation applied to a vague brief just produces a tidy version of the wrong report.
✅ Be specific in your request. Name the data sources, the KPIs, the dimensions, the destination, and the reporting cadence. The clearer the prompt, the closer the first draft.
✅ Review the AI-generated configuration before you run it. This is the single most important habit. It catches misread fields and wrong accounts while they’re still cheap to fix.
✅ Standardize your reporting structure across clients, and document the client-specific differences that remain. Consistency is what makes reports scannable, and your agency look organized.
✅ Test the first few refreshes to confirm the numbers hold, and check reports periodically after that. Automation reduces monitoring; it doesn’t remove it.
Common pitfalls to avoid
There are a few traps that show up again and again. First is automating before you’ve defined your KPIs, which locks a fuzzy report in place. Second, treating every client as a fully bespoke project, when a core template plus a few tweaks would serve them better. Third, letting metric definitions drift between clients for no reason, so a “conversion” means different things across reports. Fourth, choosing a tool that gets expensive or unwieldy as clients pile up. Fifth, assuming automation means you never look again, when a broken connector or a shifted attribution window can quietly skew a report. And, finally, giving AI or clients access to more data than the job needs, when tighter controls cost you nothing.
Automate reporting for every client with Coupler.io
Get started for freeBuild client reporting once and let AI and automation handle the repetition
Manual reporting for clients is a solvable problem. Automated reporting for clients takes that weekly loop of pull, clean, combine, format, update, and explain off your team’s Mondays.
With Coupler.io, that loop becomes: describe the report, let AI build and blend it, review it, run it, and reuse it across clients. You keep the judgment, the client relationships, and the strategy.
Start with the client report that costs you the most time right now. Set it up, get it refreshing on its own, and reuse the structure on the next account. Once automated client reporting is running, the numbers stay up to date while you get back to the strategy that keeps clients paying.