Building a social media performance report across platforms is rarely straightforward. You export Facebook data, pull Instagram metrics from another dashboard, and grab TikTok Analytics separately, only to spend time renaming columns so reach and other metrics mean the same thing everywhere. Before your social media report for clients or leadership is ready, hours have disappeared.
Most social media reporting tools handle individual platforms well, but cross-platform social media reporting often requires higher-tier plans and still leaves you combining data manually.
Coupler.io automatically pulls Facebook, Instagram, and TikTok data into a single source, standardizes social media KPIs, and keeps reports up to date.
This walkthrough uses Coupler.io’s “multiple sources” option, which lets you combine Facebook, Instagram, and TikTok into one dataflow instead of building and maintaining three separate ones.
Option 1: Ask AI to build your report
Instead of doing it manually, you can have your report created by AI. You can do this with Coupler.io AI or any other AI tool you use.
Create a free Coupler.io account, no credit card required.
On the homepage, in the “Analyze with AI” section menu on the left side, you’ll see “AI Agent”. Click on it and Coupler.io’s AI Agent will appear.
You can then type in what kind of data flow you need and it will create one for you.

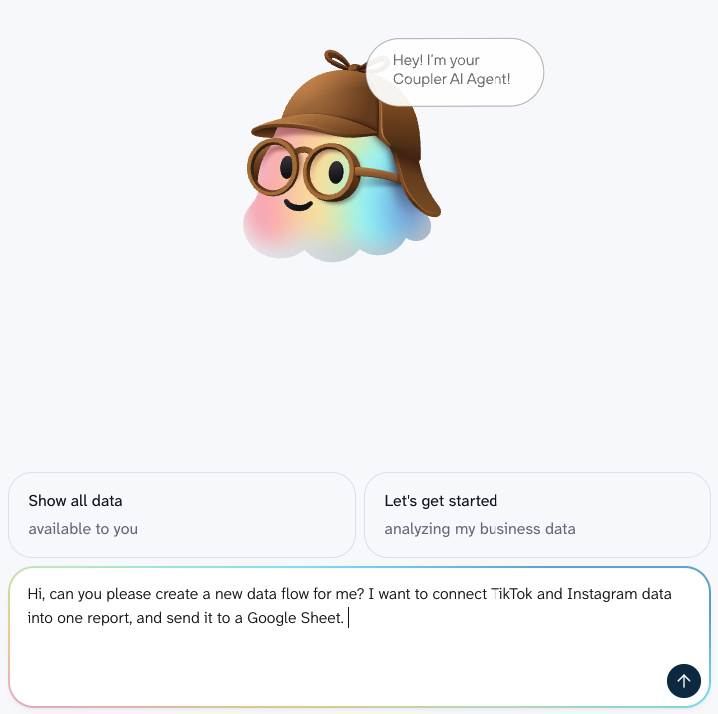
If you’d like to use Claude or another AI tool, the steps are outlined below.
- Sign up for Coupler.io and install the connector
Create a free Coupler.io account.
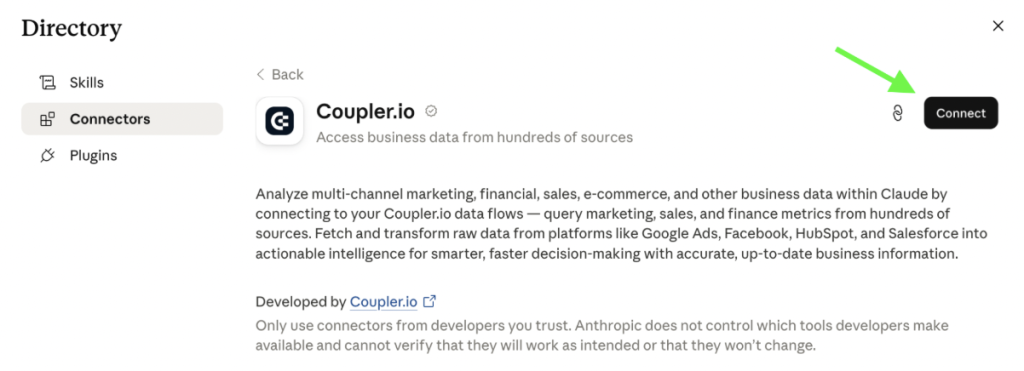
If you’re using Claude, open the Coupler.io connector page in Claude.ai and click Connect to authorize your account:

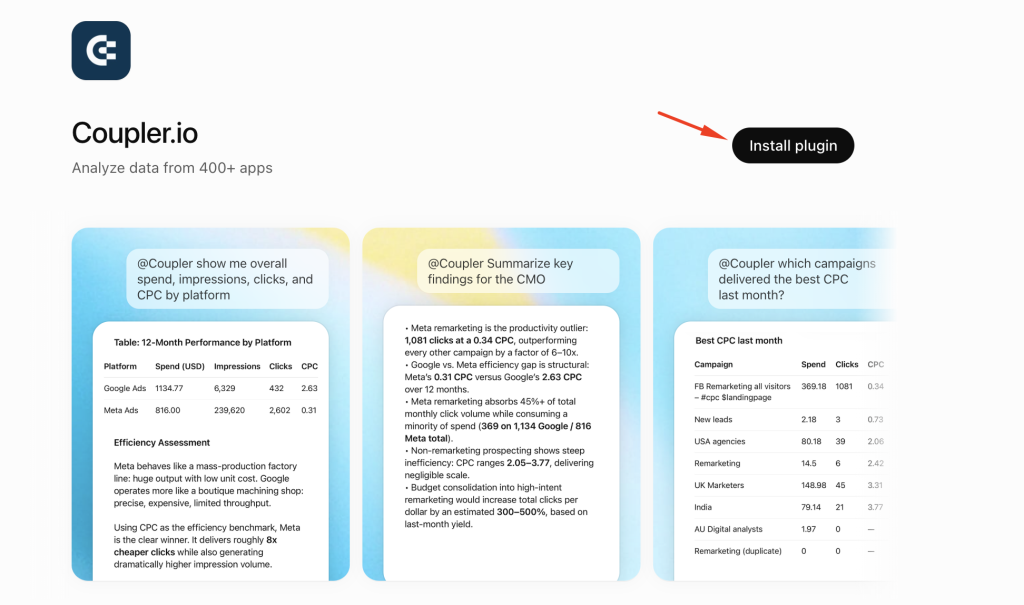
If you’re using ChatGPT, go to Plugins, search for Coupler.io, and install the plugin:

The procedure of connecting Coupler.io with AI will be similar for any other AI tool you use. Coupler.io provides connectors/plugins for:
- Claude
- ChatGPT
- Cursor
- Perplexity
- Gemini
- OpenClaw
- Copilot
Just go to their connector/plugin library, search for Coupler.io and connect them following the instructions.
It’s a one-time setup that will let AI tools work with Coupler.io for all future requests.
- Authorize social media accounts
Let’s take Claude as an example.
Open a new chat in Claude and describe the report you want to create. For example:
“I want to combine my social media performance data from TikTok, Instagram, and Facebook into one report. Connect these three sources to Claude through Coupler.io. Destinations are Google Data Studio and Claude.”
Claude doesn’t have access to your social media accounts through Coupler.io yet, so it will prompt you to authorize the connection for all three.
Follow the link Claude provides and complete the authorization process in a separate browser tab.

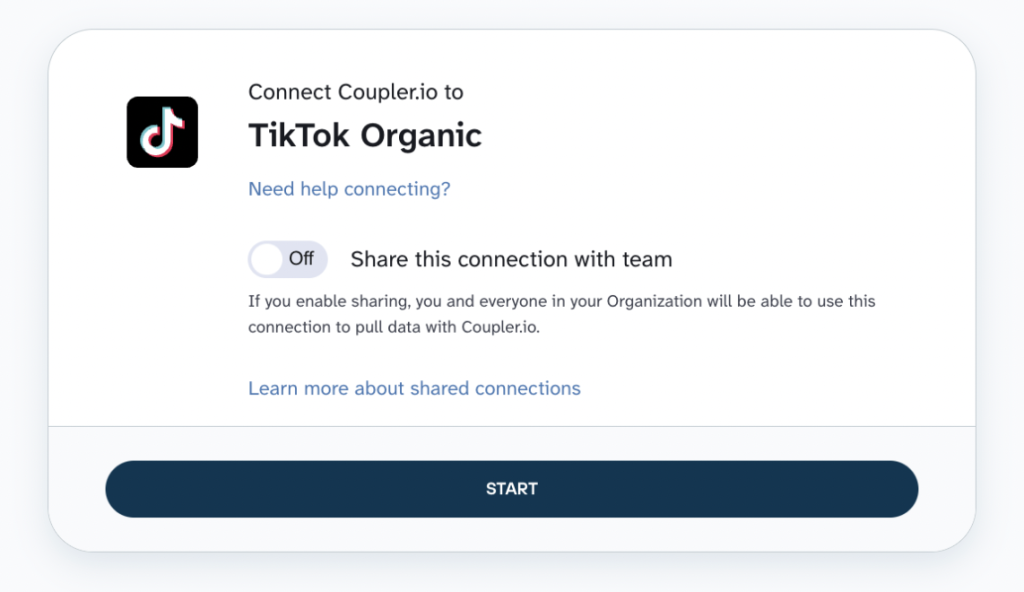
Follow the steps for authorizing all three accounts. Once the accounts are connected, Claude can use the data from all three channels to help you analyze their combined performance.
- Chat with your data
Now that your accounts are connected, you can start chatting with the data. For example, you can ask it to review the data and recommend next steps regarding social media strategy:

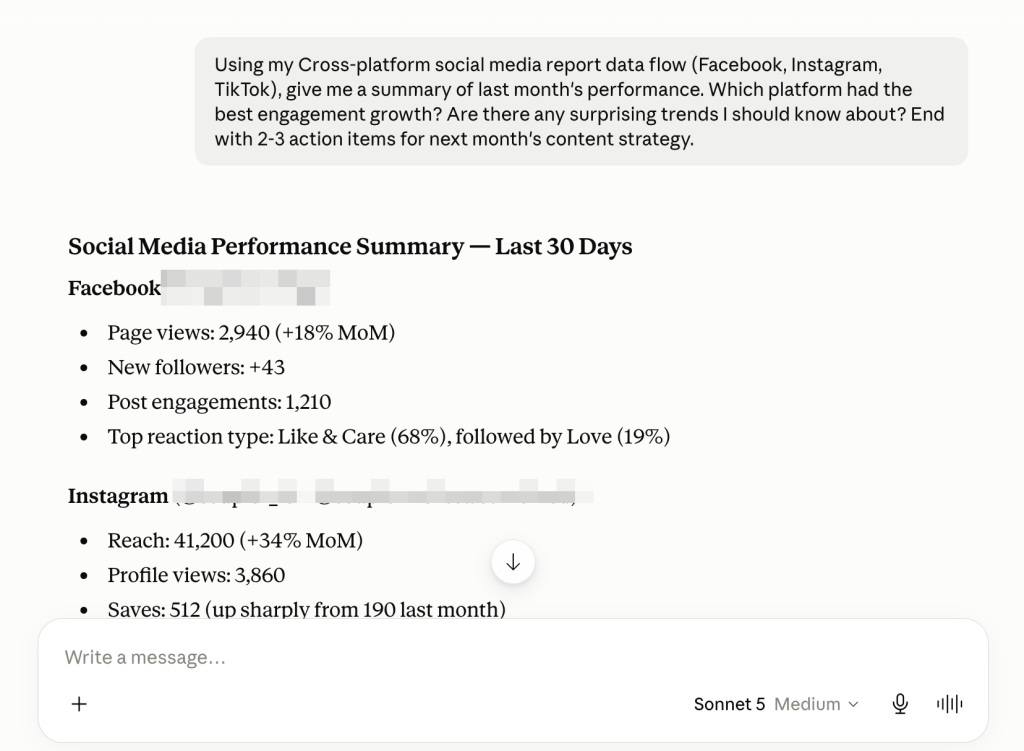
💡Every number in these answers comes from Coupler.io’s Analytical Engine, not from the AI itself. The AI translates your question into a query, the Analytical Engine runs that query against your full dataset and does the actual math, and only the verified result gets sent back for the AI to interpret and explain in plain language. Think of it as a mathematician and a storyteller working side by side: one handles the numbers, the other handles the explanation, and neither one guesses at the other’s job.
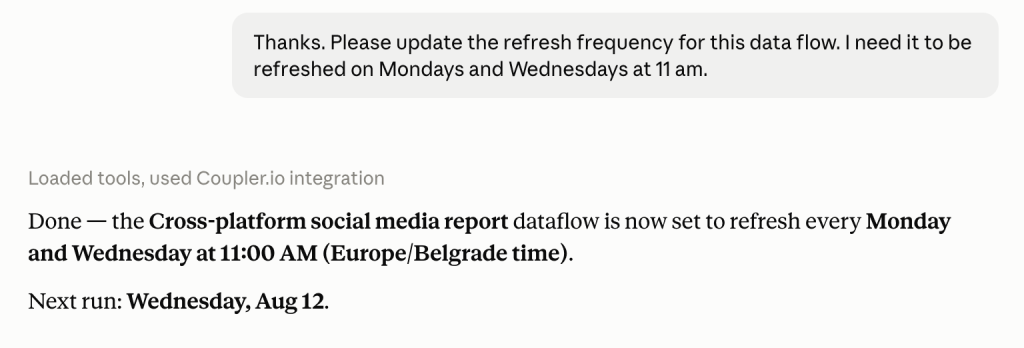
Pro tip: You can also edit refresh frequency straight from the chat:



Automate social media reporting with Coupler.io
Get started for freeOption 2: Build the report manually
Using AI chat is the quickest way to get a data flow up and running. But building it manually gives you more control over the data.
You can decide exactly what data to include, how it should be structured, and what context the dataset should contain.
For example, you can:
- Filter out unnecessary rows
- Rename or hide columns
- Add business context
- Combine data from multiple sources into a single dataset.
Later on, this will give your AI tool a cleaner, more structured data set to work with. It also reduces the chance of AI misinterpreting your metrics or definitions.
Step 1: Connect Facebook, Instagram, and TikTok as data sources
Create a new dataflow in Coupler.io and you’ll be taken to the Sources page.
Set up your first source following the instructions (it can be Facebook, Instagram, or TikTok). Once it’s done, you’ll see the “Add a few more sources” field on the same Sources page.
Use it to add the remaining two sources. (You can add all three sources before moving on to the next step, or add one, finish its setup, and come back to add the rest. Either order gets you to the same place.)

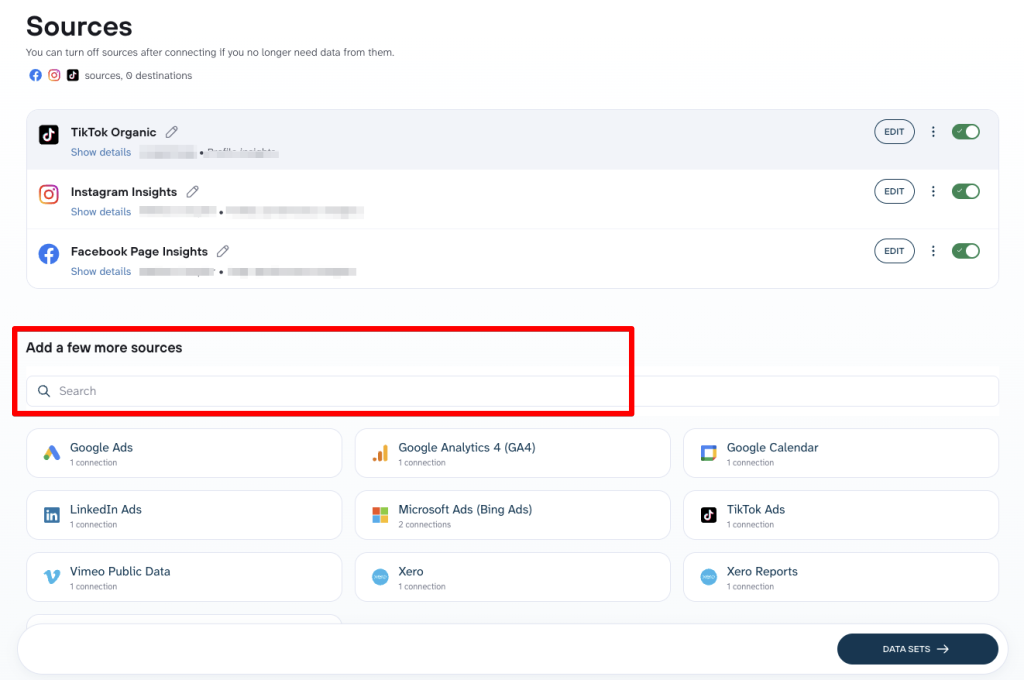
It’s a great option because you can blend the data from multiple sources within a single data flow. This way, you’ll have everything in one report and you won’t need to sift through 3 different reports from 3 sources.
💡 Coupler.io isn’t limited to these platforms. The same multi-source flow works with any combination of its 400+ supported data sources. So, besides Facebook, Instagram, and TikTok, you can also combine data from Google Analytics, Google Sheets, LinkedIn Analytics, TikTok Ads, and many other sources in a single report instead of building separate reporting workflows for each one. The same setup also works for broader multichannel marketing reporting when you need to bring social data together with other marketing channels.
Step 2: Organize your data in data sets
Once your sources are connected, the data set editor is where the data reconciliation happens.
First off, you will see all your sources on the left; clicking on each will open up a data set for each source:


In each data set, you can:
- Rename columns so the same metric reads the same way everywhere.
- Catch small mismatches that might break a comparison later, like one platform reporting a rate as a decimal and another as a percentage.
- Reorder or hide columns that don’t matter for this particular report so the final output stays readable.
From there, decide how to blend the data:
- Append: stacks rows from each source into one long table, matching columns by name. Gives you a “platform” column so you can filter or compare metrics side by side.
- Join: merges datasets by a shared column, usually date, so each platform’s metrics sit in separate columns on the same row instead of stacking as separate rows.
- Aggregate: doesn’t need multiple sources. Rolls up detailed rows, like daily post-level data, into totals or averages, such as weekly or monthly numbers.
For this kind of report, start with Append:


It’s the simplest option, and it matches the goal here: comparing Facebook, Instagram, and TikTok side by side. It only needs one thing to work cleanly, matching column names across sources, which you already handled in the renaming step above.
You can use Join later, once you want one row per date with all three platforms’ numbers side by side. Use Aggregate on top of either one once you want weekly or monthly rollups instead of daily rows. These transformations become useful for cross-channel marketing analytics when you start comparing social performance with data from other marketing channels.
💡 Pro tip: Add context to each data set while you’re still on this screen. It takes two minutes and it changes what the AI is capable of noticing.


The more context you give your data, the less time you’ll spend second-guessing AI’s answers (in case you’re using an AI as a destination; more on that in the step below).
Think of it like onboarding a new teammate: if you only hand them a spreadsheet, they’ll make reasonable assumptions that may still be wrong. But if you explain that a deal_value of 150 is just a placeholder, that your biggest campaign was paused for two weeks, or that January always brings a seasonal spike in acquisition costs, their analysis immediately becomes more reliable.
A few short notes about your business rules, metric definitions, or unusual events will give AI the full picture it needs to produce insights that reflect how your business actually works.
Step 3: Load your data to a destination
With the data blended, send it wherever it’s used.
Coupler.io supports three broad categories of destination:
- Dashboards (Google Data Studio (formerly Looker Studio), Google Sheets…)
- Data warehouses
- AI platforms like ChatGPT, Claude, and others connected through MCP.
Google Data Studio and Google Sheets handle the data visualization side, turning the blended dataset into charts your team can skim in seconds, so the result is one marketing dashboard instead of three separate platform-specific ones.
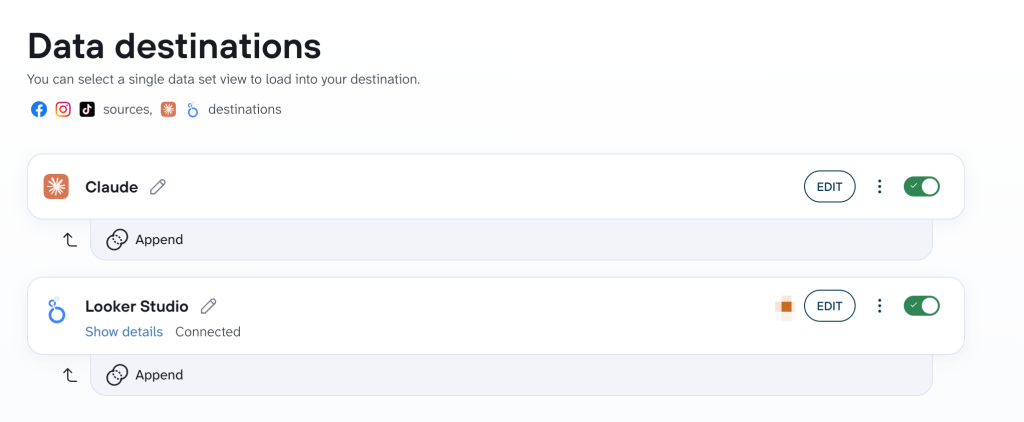
You’re not limited to one destination, either. The “multiple destinations” option mirrors the multiple-sources idea from Step 1: the same blended dataset can go to a Looker Studio dashboard for stakeholders and to an AI tool for chat-based digging, from the same flow, on the same schedule.
In this case, I set up Google Data Studio and Claude as destinations, exactly for those reasons:

You can also set up a scheduled refresh so the report updates on its own:

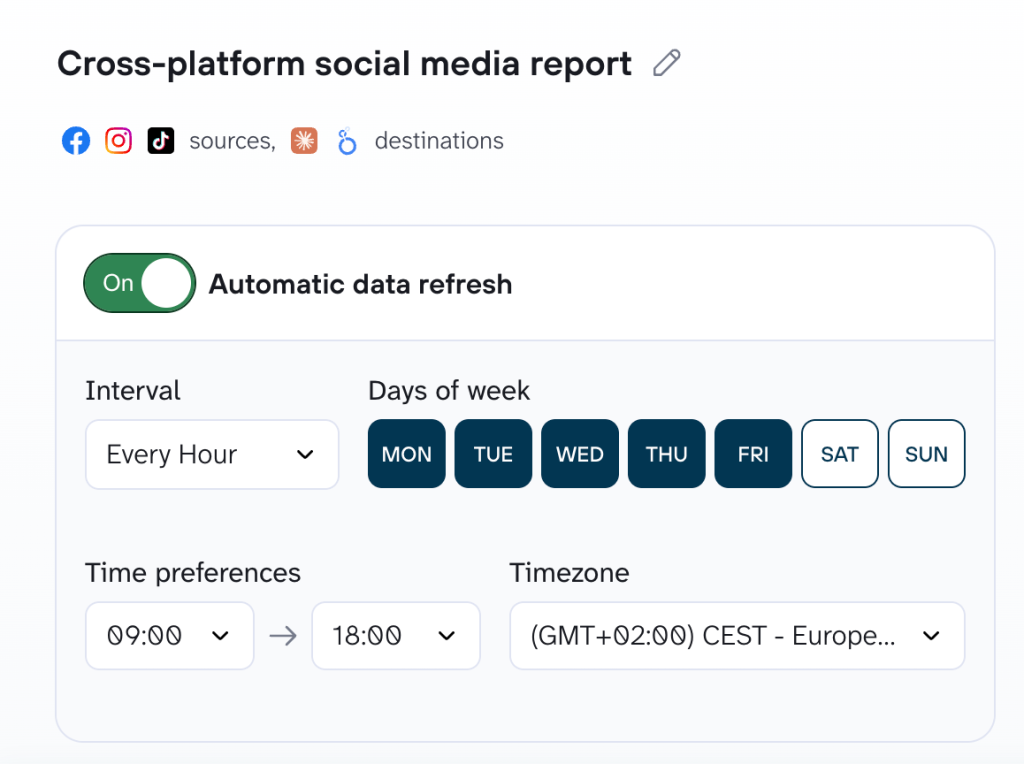
Pick whatever reporting frequency actually matches how fast these platforms move in your case.
Once the schedule is set, “automate reporting” really does mean automated: you won’t have to do manual pulling the night before a meeting. This takes the repetitive work out of social media reporting, especially when you’re tracking several platforms on the same schedule.
Whether you need a reusable social media report template, a Facebook Instagram TikTok report, or custom dashboards for different stakeholders, the steps above show the most practical way to build recurring cross-platform custom reports.
Step 4: Chat with your data
If you sent your data to an AI tool, like I did in this case with Claude, open it and ask questions directly.
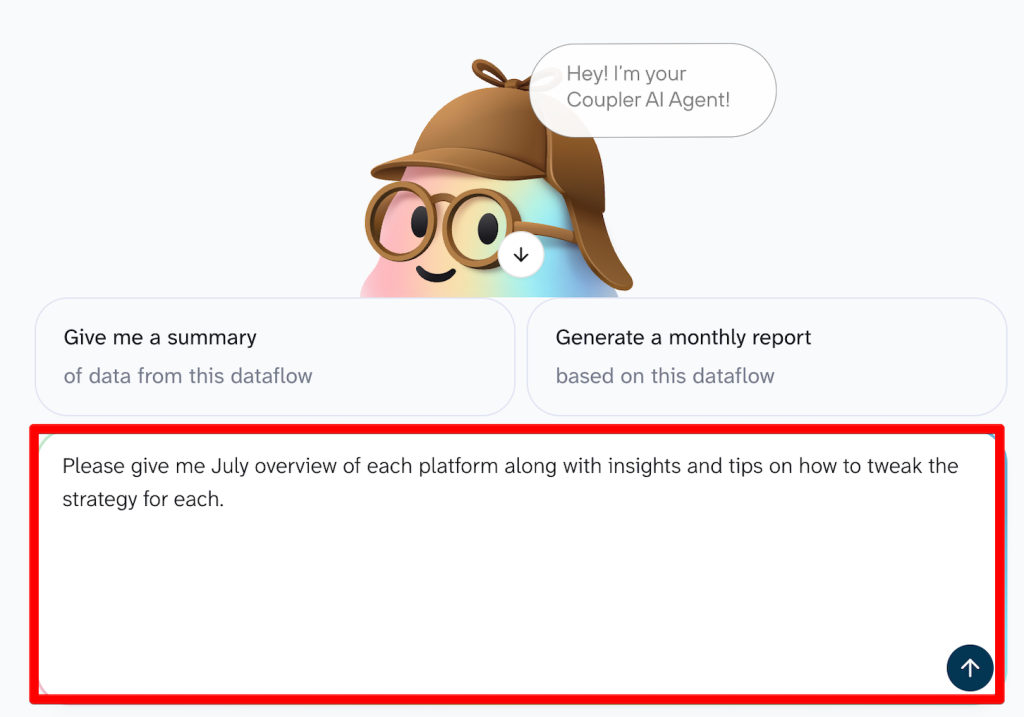
If your destination is a dashboard or a warehouse, you can still chat with Coupler.io’s own AI Agent from inside the flow, no separate AI subscription required.
For examples and details, refer to the “Ask AI to build your report” section.
Reminder: Even if AI isn’t your final destination and you’re using a BI tool like Looker Studio instead, you can still chat with your data and manage your data flows. The only difference is that you’ll do it through Coupler.io’s AI agent rather than directly in Claude or ChatGPT:

Turn social media data into actionable insights
Get started for freeFacebook, Instagram, and TikTok structure their social media data differently, which is exactly why the renaming step above matters. Once you’ve standardized those metrics, your multi-platform social media dashboard can bring them together in a consistent view. Here’s what each platform actually gives you, and one thing you can do with it.
Facebook Insights data
Facebook Insights covers:
- Reach
- Impressions
- Engagement rate
- Page likes and follows
- Video views
- Audience demographics
- The organic vs paid split for your posts.
For paid activity specifically, you can pull in:
- Conversions
- Conversion rates
- CPC
- Cost per acquisition (CPA) alongside the organic key performance indicators, which matters if you’re auditing a specific launch or a set of social media campaigns rather than just checking general page health.
The organic vs paid split is worth building a habit around on its own.
Pull it into your recurring report and you can see, at a glance, whether your reach is being driven by content people are actually sharing or by ad spend. If paid is carrying most of your impressions and organic reach is flat, that’s a signal to test content changes before increasing budget. More spend on the same underperforming creative won’t move the needle on brand awareness, and it definitely won’t fix a stalled lead generation goal.
Instagram Insights data
Instagram Insights tracks:
- Profile visits
- Follower growth
- Follower count
- Saves
- Shares
- Comments
- Likes
- Top-performing posts
Saves are the metric worth watching more closely than likes.
A post with modest likes but a high save rate usually means people found it useful enough to come back to. This is a better predictor of long-term audience growth than a like is.
If you’re deciding which content formats to produce more of, sort by saves before you sort by likes. It’s a small change that can reshape your content calendar over a quarter.
TikTok Analytics data
TikTok Analytics reports:
- Video views
- Watch time
- Click-through rate (CTR)
- Audience demographics
- Best time to post
- Follower growth rate.
TikTok’s audience breakdown, by age, location, and active hours, tends to go deeper than what Facebook or Instagram surface. If you repurpose the same content across all three platforms, that extra detail is useful for spotting which audience is actually engaging with it.
Watch time and video completion rates matter more on TikTok than on the other two platforms, because TikTok’s algorithm weighs how long people stick around, not just whether they tapped.
For example, if a video has strong views but a steep drop-off in the first three seconds, that’s an editing problem. Track watch time alongside CTR long enough and you’ll start to notice patterns tied to algorithm changes that a single-platform view would miss.
Which is the best way to combine Facebook Instagram TikTok data into one report?
The right option depends on how often you’re reporting and who’s reading it.
Pulling data manually from each platform’s native analytics costs nothing and works for occasional, low-stakes checks. It falls apart the moment you need a recurring report, because every refresh means repeating the same manual export and reconciliation work, and consistency across metric names tends to drift over time.
A social media management tool with built-in reporting, like Hootsuite, Sprout Social, or Metricool, bundles scheduling with reporting in one place. This is genuinely convenient if scheduling is your main use case. The trade-off is that cross-platform reports are often gated behind a higher-tier plan, and even then, they rarely blend social data with your CRM, ad spend, or finance numbers, and they don’t connect to AI tools for follow-up questions.
Think about who’s actually reading the report before picking a lane. A solo marketer checking numbers once in a while can live with manual exports. A team that already schedules posts through Hootsuite or Sprout Social and just needs a once-a-month screenshot can lean on that tool’s built-in view.
But a marketing team reporting to multiple stakeholders, or an agency reporting to multiple clients, needs the numbers to hold up under a follow-up question without another round of manual work, and that’s the gap Coupler.io is built to close.
Coupler.io combines multiple data sources, sends the result to multiple destinations, and layers AI chat on top. All from one flow that updates on its own schedule!
If you’re reporting on more than one social platform more than once and need the numbers to hold up when someone asks a follow-up question, building one blended flow beats juggling three separate reports every time.
Start a Coupler.io dataflow and connect your first source to see how quickly a working report comes together.
Automate your cross-platform social reporting with Coupler.io
Get started for free