LinkedIn Ads generates detailed data on ad spend, impressions, clicks, CTR, conversions, leads, and audience demographics broken down by seniority, job function, industry, and company size. Exporting this data on a schedule opens up cross-channel PPC reporting, lead generation analysis, stakeholder dashboards, and AI-powered campaign reviews.
With Coupler.io, you can set up a LinkedIn Ads export once and have fresh data flowing to Google Sheets, Excel, Data Studio, Power BI, BigQuery, or AI tools like Claude and ChatGPT on a schedule you choose. It lets you connect your data to ready-made dashboard templates and analyze campaign performance with AI. You won’t need manual CSV exports or custom LinkedIn API-based integrations to automate your PPC reporting.
How to set up an automated export of LinkedIn Ads data on a schedule?
Coupler.io is a data integration platform and AI analytics that connects to LinkedIn Ads and 400+ other sources. You pick the metrics and dimensions you need, filter or reorganize them before they leave, set a refresh schedule, and send the results to spreadsheets, BI tools, data warehouses, or AI tools. One data flow handles all of that.
To get started, open the Coupler.io AI Agent chat and describe what you need. Something like “weekly LinkedIn Ads report with spend, clicks, and CPL by campaign in Google Sheets” or “Data Studio dashboard for LinkedIn Ads lead gen performance.” The AI Agent builds the data flow for you based on that description.
Let Coupler AI do the data work for you
Tell Coupler AI what you need to know, from which source, and how often. It connects your account, sets up the data flow, keeps it refreshed, and lets you analyze the results inside Coupler.io or another AI tool.
Try for free

The manual walkthrough below is an alternative for those who want to control each step or see how the setup works before handing it to AI.
Step 1: Collect your LinkedIn Ads data
To create a new LinkedIn Ads importer, select the destination from the dropdown menu below and click Proceed.

Sign up for a Coupler.io account for free and connect your LinkedIn Ads account.
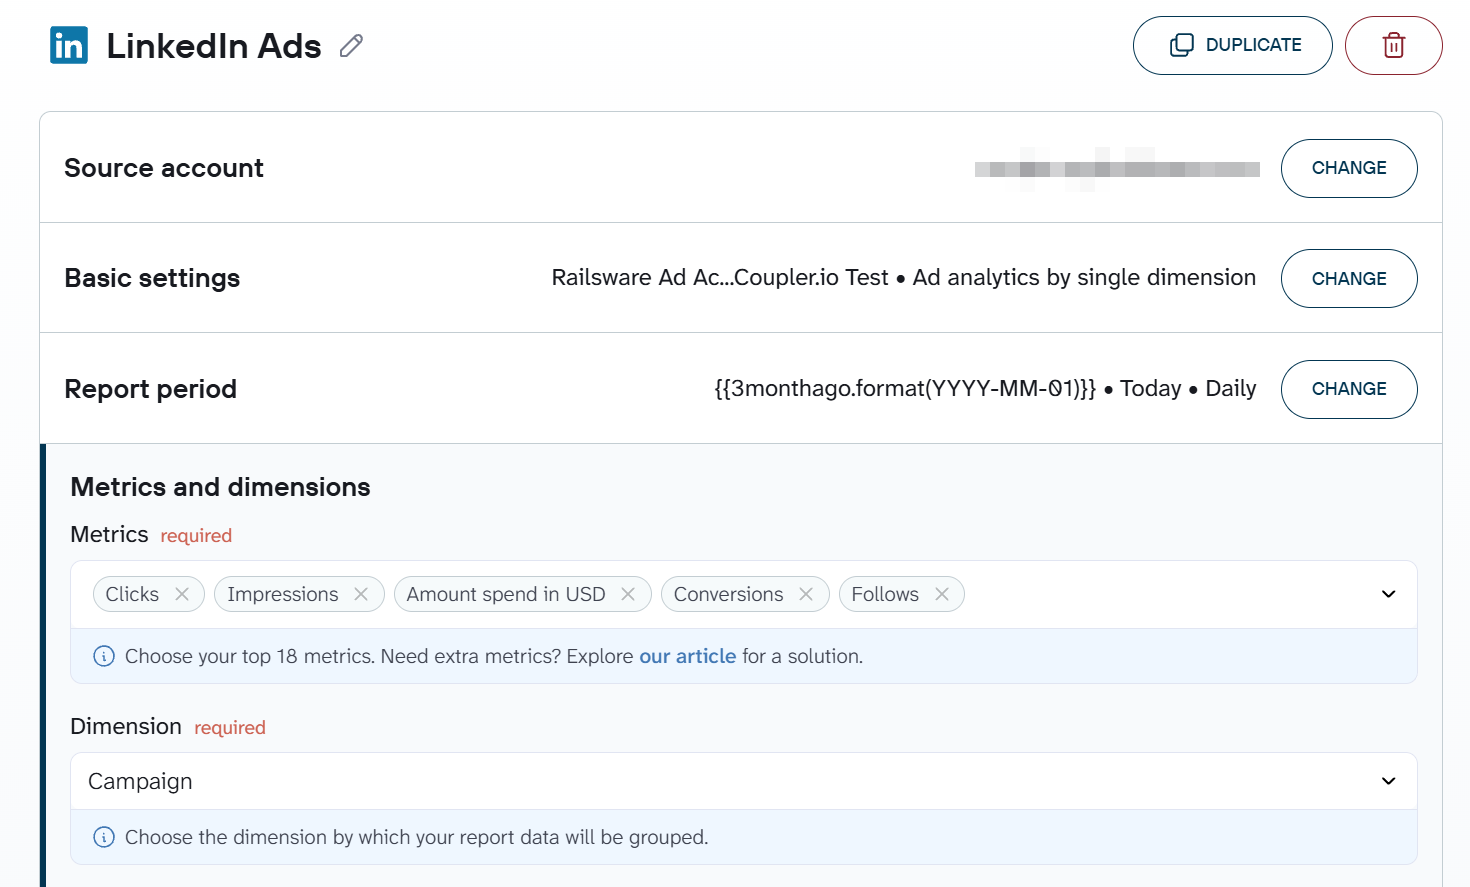
Now, select the Ad accounts from which you want to extract data and choose the report type, such as Ad analytics. Choose the report period (i.e., date range) for the data. You can use macros like {{today}} and {{30daysago}} here.
Choose the metrics and dimensions you want to extract from LinkedIn Ads.

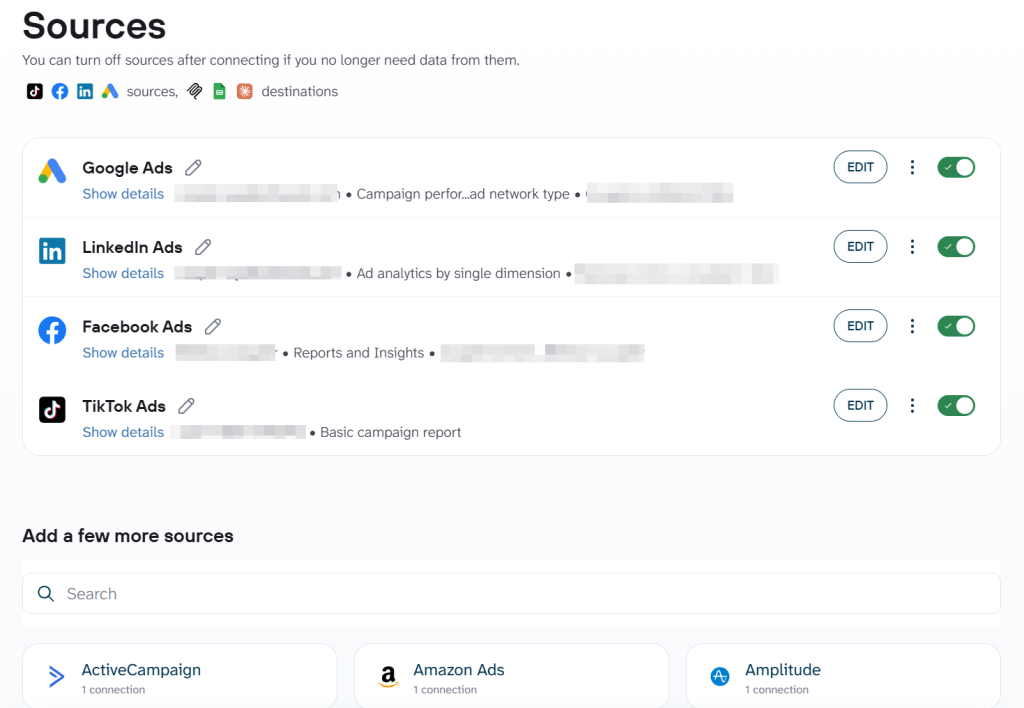
If you run ads across multiple platforms, you can connect Google Ads, Meta Ads, or other sources to the same data flow in Coupler.io. That way, your LinkedIn Ads data sits alongside other channels in one dataset, ready for cross-channel CPL comparisons or unified budget reporting.

Step 2: Organize your data set
Before the data reaches your destination, you can organize the LinkedIn Ads data set to match your reporting or analysis needs:
- Hide unwanted columns
- Sort and filter the dataset
- Create new columns using formulas
- Aggregate metrics across dimensions
- Combine data from different accounts or sources

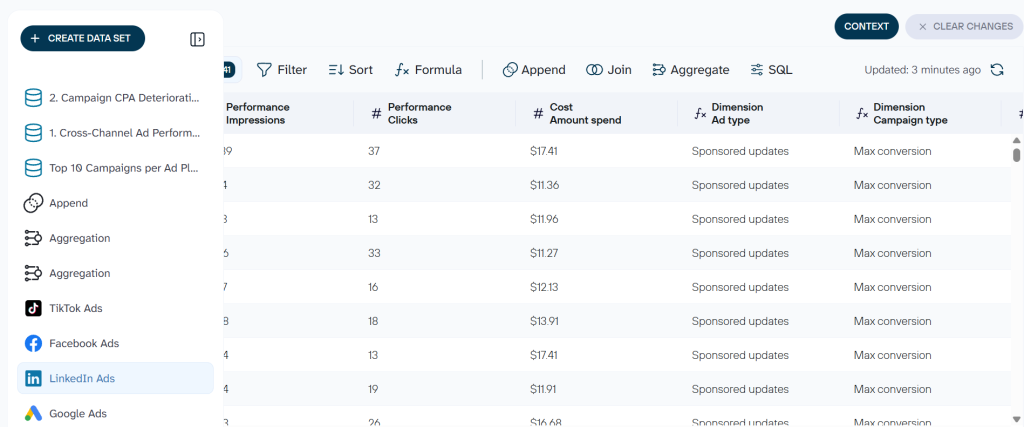
At the dataset step, you can control what columns will be available for the AI model if you plan to analyze LinkedIn Ads data in an AI Agent or connect the data flow to Claude or ChatGPT. Hide sensitive fields or irrelevant columns at this stage to keep the dataset clean and focused.
Tip: Add business context to improve AI analysis quality. For example, note what “conversion” means for each campaign objective (Lead Gen Form submissions vs. website conversions vs. job applications), that cost metrics come in both local currency and USD, or which campaigns target awareness vs. demand generation. This context helps AI tools interpret the data accurately instead of guessing.
Step 3: Load data and schedule updates
Follow the on-screen instructions to connect your destination. You can send LinkedIn Ads data to Google Sheets, Excel, Data Studio (recently renamed back from Looker Studio), Power BI, BigQuery, or AI tools like Claude and ChatGPT. Moreover, Coupler.io allows you to add multiple destinations within the same data flow. For example, if you want to export data from LinkedIn Ads to Excel and simultaneously connect a Data Studio dashboard, both destinations run from a single setup.
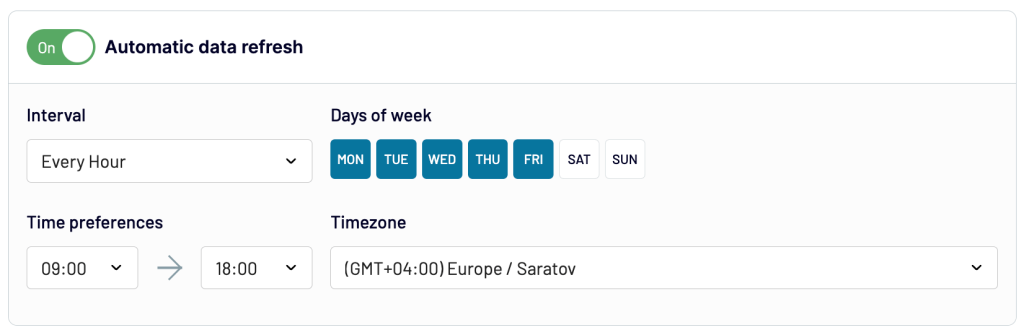
Next, toggle on the Automatic data refresh option to set up a schedule for the LinkedIn Ads data export.
For example, you can set the data flow to refresh every hour on weekdays during a specific time range. Coupler.io supports refresh intervals as frequent as every 15 minutes, keeping your reports up to date without manual re-exports.

On a successful run, the LinkedIn Ads data will be exported to your chosen destination. The data flow will automatically refresh on the schedule you set, so your reports always reflect the latest data.


Export LinkedIn Ads data on a schedule with Coupler.io
Get started for freeWhere you can import LinkedIn Ads data
Coupler.io exports LinkedIn Ads data to destinations across five categories. You can send data to multiple destinations within the same data flow, so a single setup can feed a dashboard, a spreadsheet, and an AI tool at the same time.
Dashboards and BI tools — Data Studio (recently renamed back from Looker Studio), Power BI, Tableau, and Qlik. Use these when you need self-updating dashboards for tracking campaign performance over time, sharing results with stakeholders, or comparing LinkedIn Ads against other channels in a unified view.
Spreadsheets — Google Sheets and Microsoft Excel. Good for ad hoc analysis, pivot tables, custom formulas, and lightweight reporting where a full BI tool is more than you need.
AI tools — Claude, ChatGPT, Gemini, Perplexity, CursorAI, Copilot, and OpenClaw via AI Integrations. Connect your LinkedIn Ads data to any of these tools for conversational campaign analysis. Ask questions about CPL trends, audience segments, or creative performance in plain language instead of building a report each time.
Data warehouses — BigQuery, Snowflake, PostgreSQL, Supabase, and Redshift. Use these for cross-source joins (combining LinkedIn Ads with CRM or web analytics data), long-term storage, or advanced SQL-based querying.
Other formats — JSON, CSV, and Monday.com. Export data in a structured format to import into tools that aren’t directly supported as destinations, or send it to Monday.com for project and campaign tracking.
For more details on exporting LinkedIn Ads data to different destinations, see our other articles:
What data you can export from LinkedIn Ads with Coupler.io
Coupler.io supports the following report types from LinkedIn Ads:
- Ad analytics by single dimension — campaign performance metrics (spend, clicks, impressions, conversions, etc.) grouped by one dimension at a time, such as campaign, creative, or member seniority.
- Ad analytics by multiple dimensions — the same performance metrics broken down by several dimensions simultaneously, for example campaign and member industry together.
- Sponsored leads — lead data collected through Lead Gen Form campaigns, including contact details submitted by prospects.
- Ad account users — list of users with access to the LinkedIn Ads account and their roles.
- Campaign groups — campaign group-level settings and metadata.
- Campaigns — individual campaign configurations, statuses, objectives, and targeting criteria.
- Creatives — ad creative details including format, copy, and associated campaigns.
- Video ads — video-specific ad data and creative metadata.
- Shares (creative sponsored content) — sponsored content shares associated with your creatives.
- Conversions — conversion tracking data tied to your LinkedIn Ads campaigns.
Supported Metrics
You can select the following LinkedIn Ads metrics to include in your report. The most commonly used metrics are listed first.
- Impressions — number of times your ads appeared on someone’s screen. For Sponsored Messaging, this counts as sends.
- Clicks — total chargeable clicks on your ads, including clicks to the landing page or company page. For CPM campaigns, this still counts clicks that would otherwise be charged under other objectives.
- Cost (local currency) — total amount spent on ads in your account’s local currency. When grouped by a demographic dimension like company size or seniority, the cost is not adjusted for over-delivery.
- Cost (USD) — total amount spent on ads converted to USD.
- Conversions — total number of times users took a desired action after clicking on or seeing your ad. When conversions can’t be attributed to individual users, group-level attribution or estimation may be used.
- Landing page clicks — clicks that take the user to the ad’s destination URL.
- Leads (One Click) — number of leads generated through One Click Lead Gen campaigns.
- Lead form opens (One Click) — number of times users opened the lead form for a One Click Lead Gen campaign.
- Reactions — total positive reactions on your ads, including like, interest, praise, and other response types.
- Total engagements — count of all user interactions with your ad, both paid and organic.
Supported Dimensions
You can group the performance metrics in your LinkedIn Ads report by one of the following dimensions. The most commonly used dimensions are listed first.
- Campaign — group results by individual ad campaign.
- Creative — group results by individual ad creative.
- Account — group results by LinkedIn Ads account.
- Campaign group — group results by campaign group.
- Member company — group results by the company where the ad viewer works.
Analyze LinkedIn Ads campaign performance with Coupler AI
LinkedIn Campaign Manager gives you campaign-level metrics like CPL, CTR, and spend. What it doesn’t show is which audience segment is driving your cost up, whether a creative that ran well last month is losing traction, or how your Lead Gen Form campaigns compare against website conversion campaigns on actual cost per result. These are the questions that come up in weekly reviews and stakeholder calls, and answering them manually means cross-referencing reports every time.
With the data flow you just set up, you can ask these questions directly. Every data flow in Coupler.io has a built-in AI Agent – the one that you can also use to set up data flows and manage them. Just type what you need to know about your LinkedIn Ads data in plain language. The Analytical Engine runs the calculations against your dataset and passes computed results to the AI model, so the answers reflect your actual numbers.

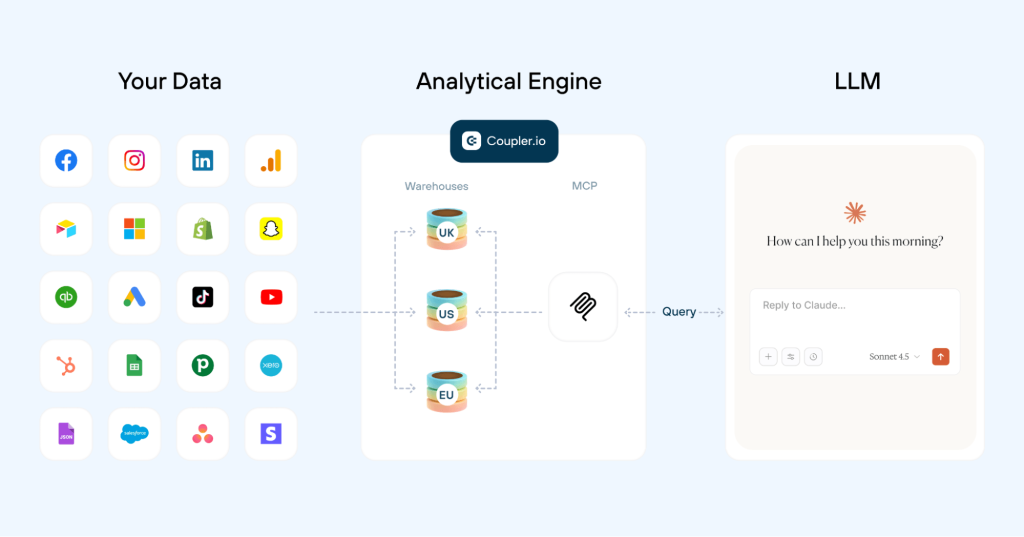
A few questions that work well with LinkedIn Ads data:
- Which campaigns have the lowest cost per lead this month, and how does that compare to last month?
- Break down CTR and CPC by audience seniority level. Where am I overpaying for clicks that don’t convert?
- Which creatives have been running the longest without a refresh? Flag any with declining CTR over the last 30 days.
- Compare Sponsored Content campaigns against Lead Gen Form campaigns on cost per conversion.
- What’s my daily spend pacing this month? Am I on track to stay within budget?
For recurring analysis like weekly CPL reviews or monthly campaign comparisons, the marketing-analytics skill handles the structure for you. Instead of writing the same prompts each time, the skill already knows what to ask about PPC data, including LinkedIn Ads. It works inside Coupler.io and in external AI tools via MCP.
For LinkedIn-specific checks, dedicated AI skills cover more than the questions above.
LinkedIn Ads budget pacing AI agent skill
Where LinkedIn Ads spend lands by month end, which campaigns spend their full budget, and why the underspenders can't spend.
LinkedIn Ads creative fatigue AI agent skill
Which LinkedIn Ads creatives are wearing out, roughly how long each has left, whether it's the audience, and how many new creatives a month.
LinkedIn Ads performance review skill
The LinkedIn Ads baseline read — what the account did, why it changed, reach and frequency, and what to do, with a number on each.
See all 200+ skills by Coupler AI
If you prefer working in Claude, ChatGPT, Gemini, or another AI tool, AI Integrations connect your data flow to those tools through Coupler.io’s MCP server. The same structured data and calculated results power the conversation. For a step-by-step walkthrough of the Claude setup, see how to connect LinkedIn Ads to Claude.
Ask questions about LinkedIn Ads performance in AI
Try Coupler AI for freeBonus tip: LinkedIn Ads analytics dashboard templates
Building a reporting dashboard from scratch takes time. A faster way to visualize your LinkedIn Ads data is to use ready-made LinkedIn Ads report templates by Coupler.io. They let you turn your data into visual insights with no hassle in just a couple of minutes.
LinkedIn Ads dashboard
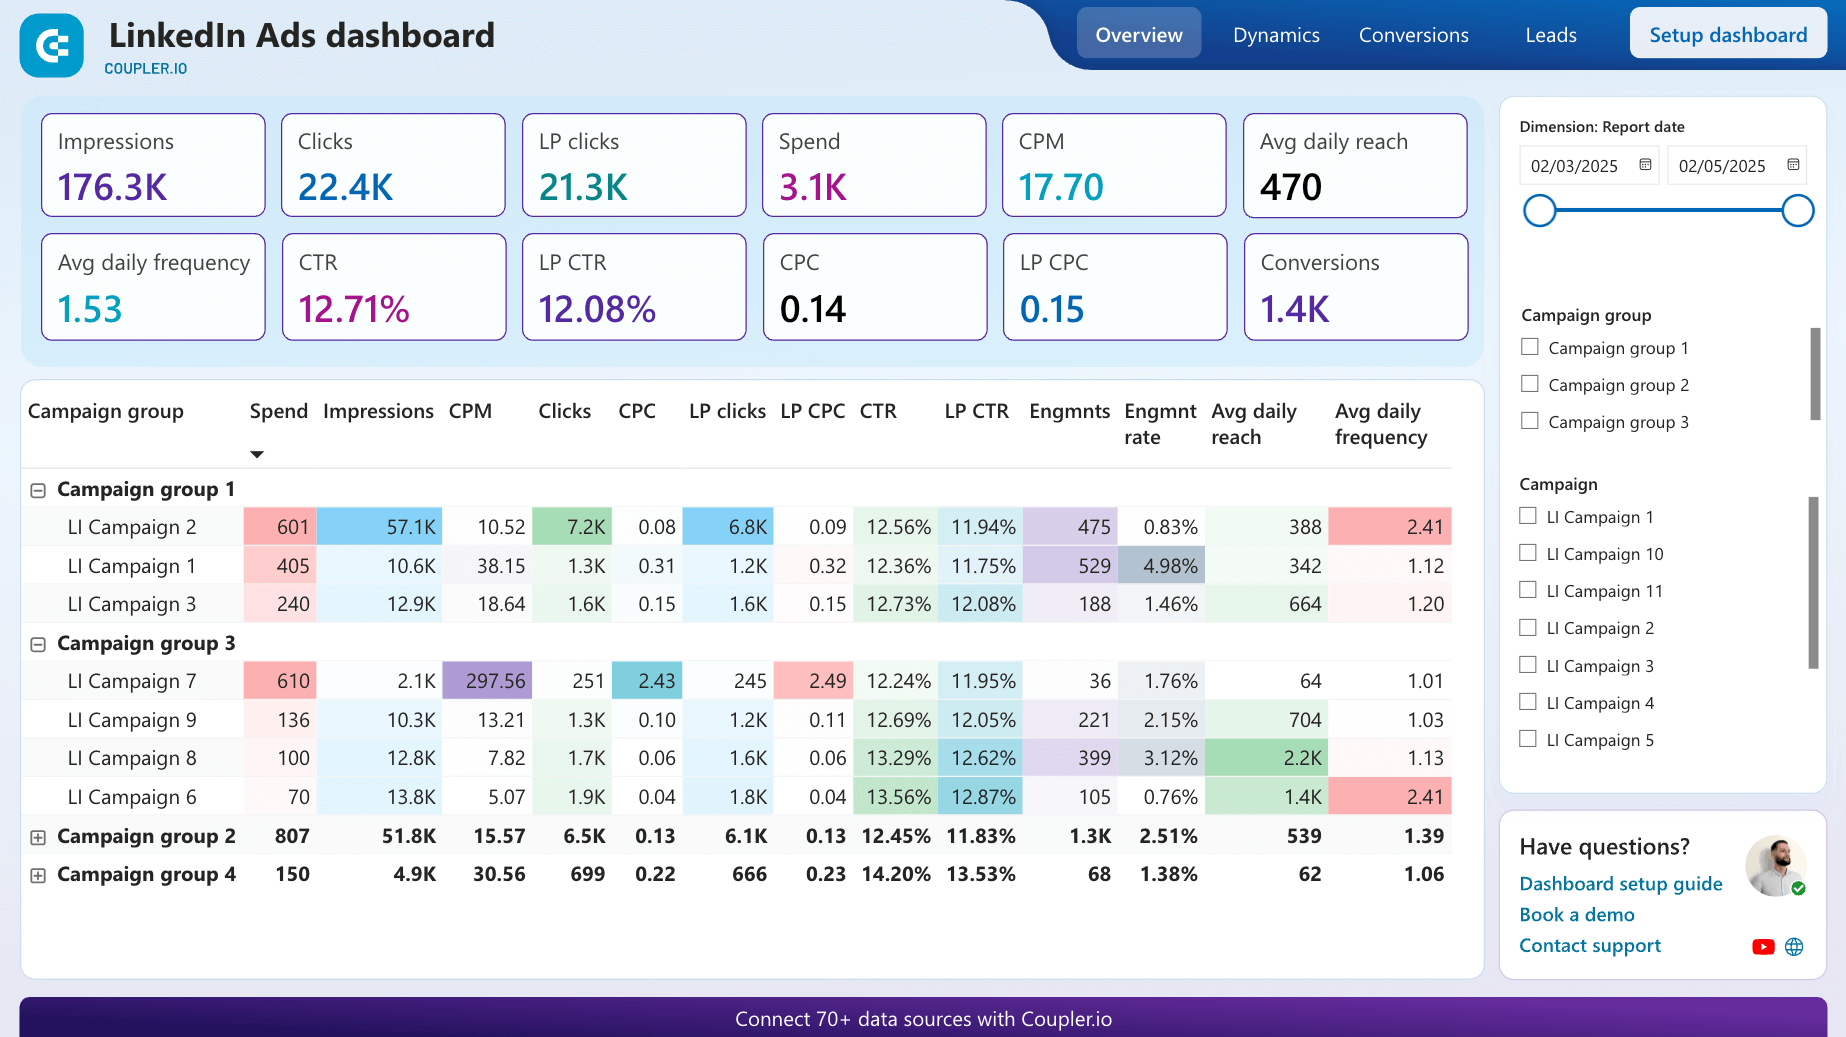
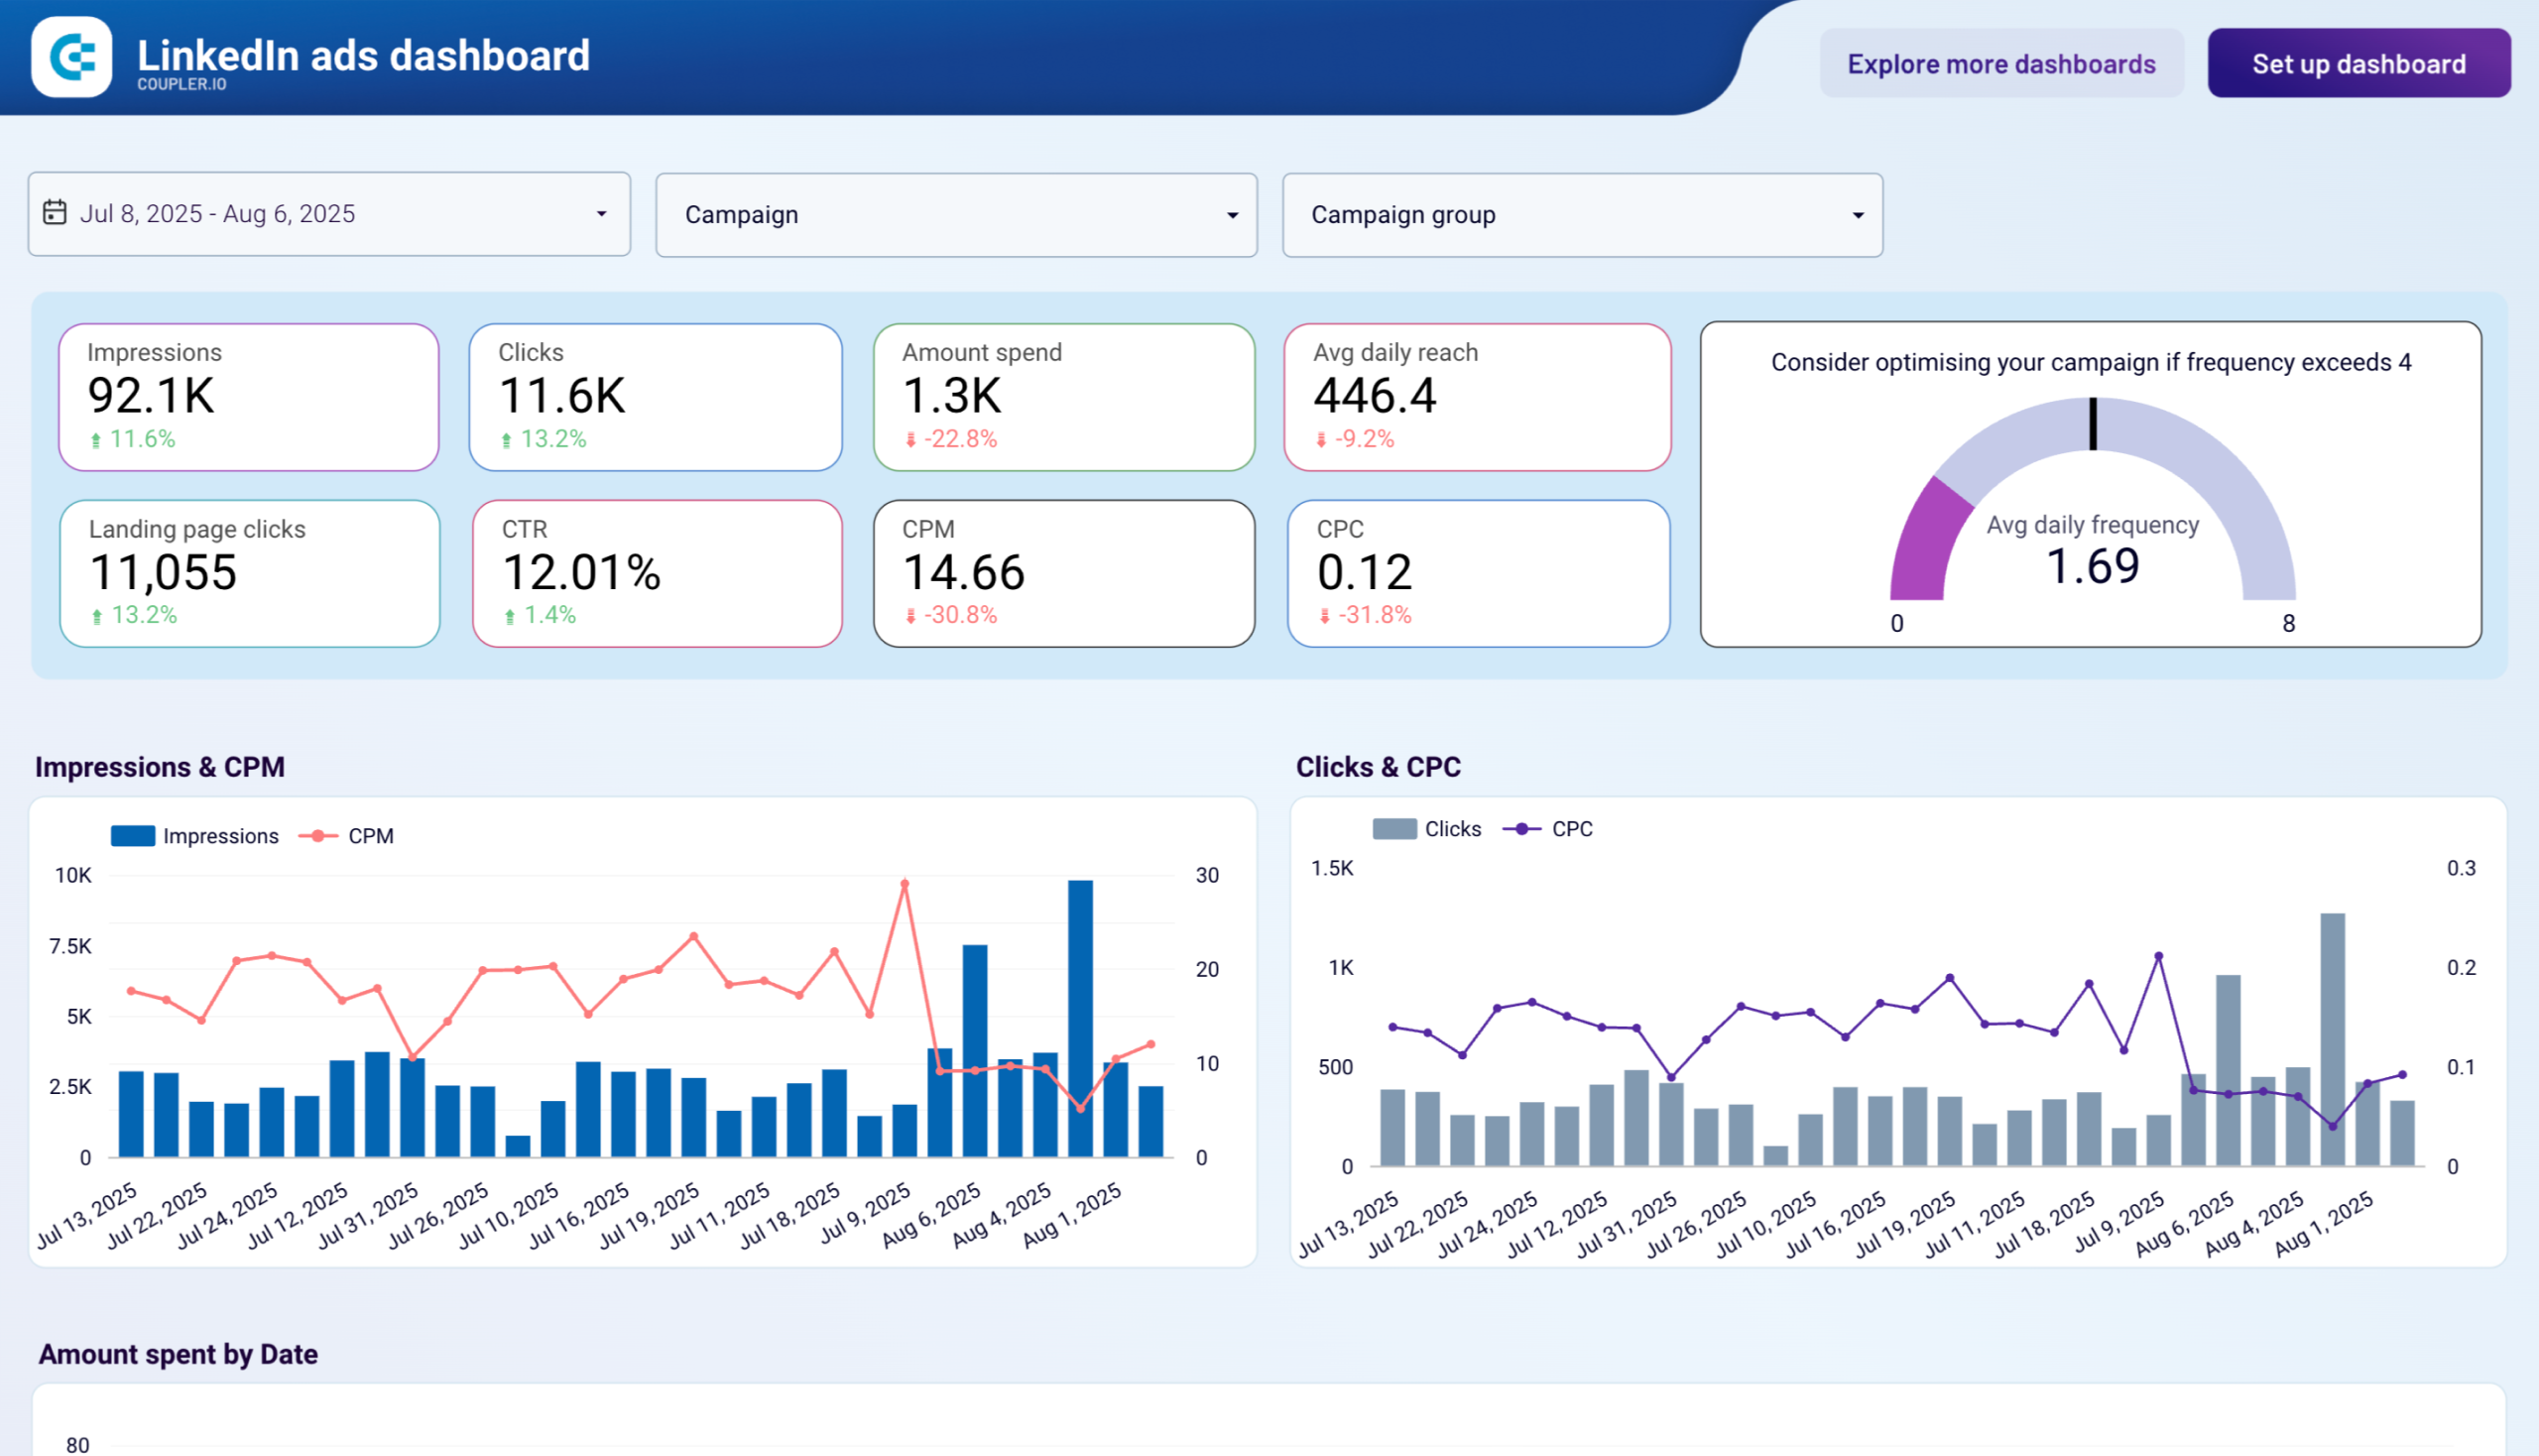
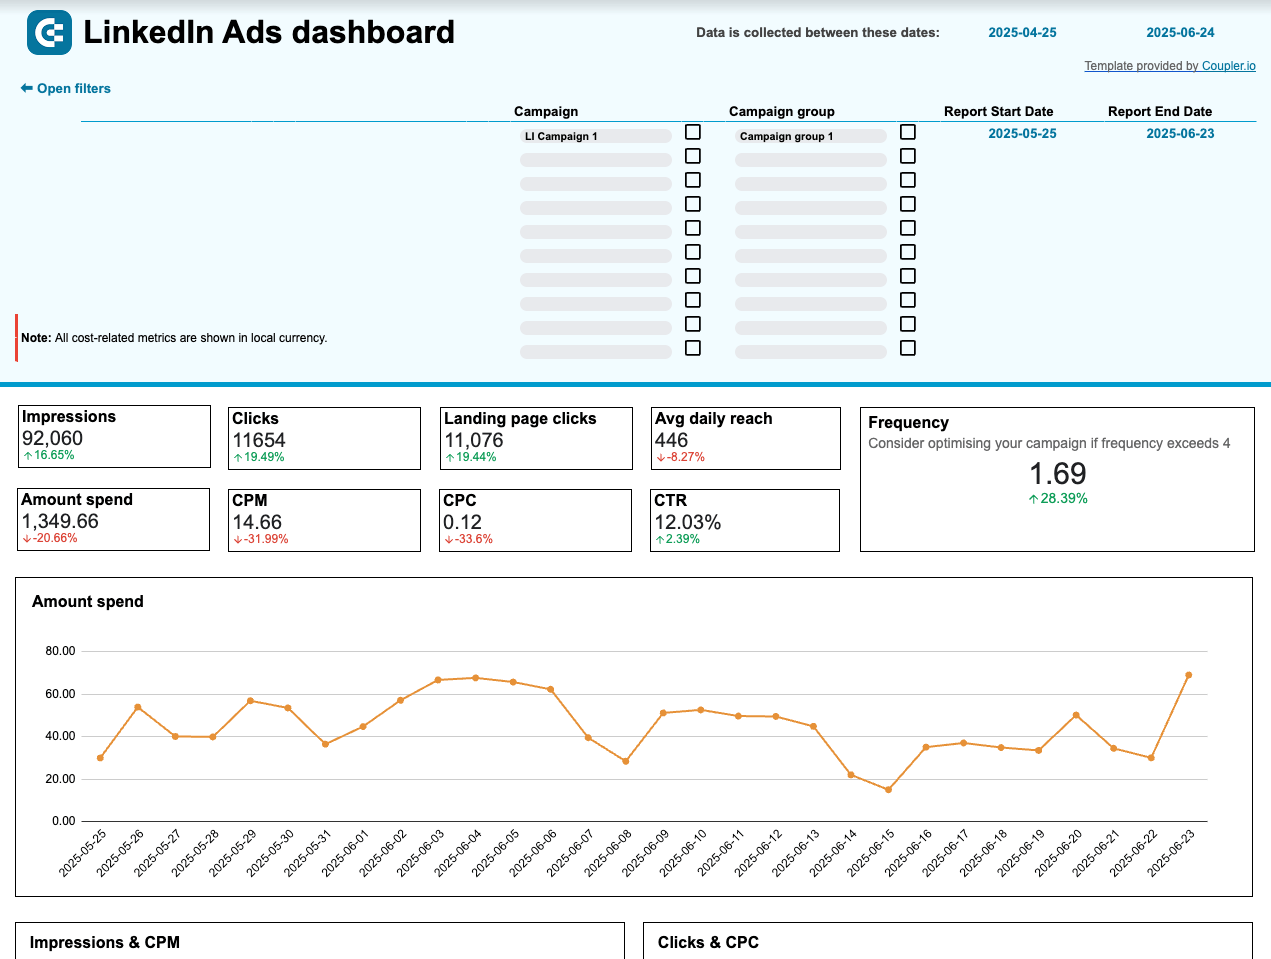
This LinkedIn Ads dashboard template gives you an overview of ad campaign performance on LinkedIn. You can analyze and track the dynamics of key metrics such as impressions, clicks, CTR, and amount spent in one place.

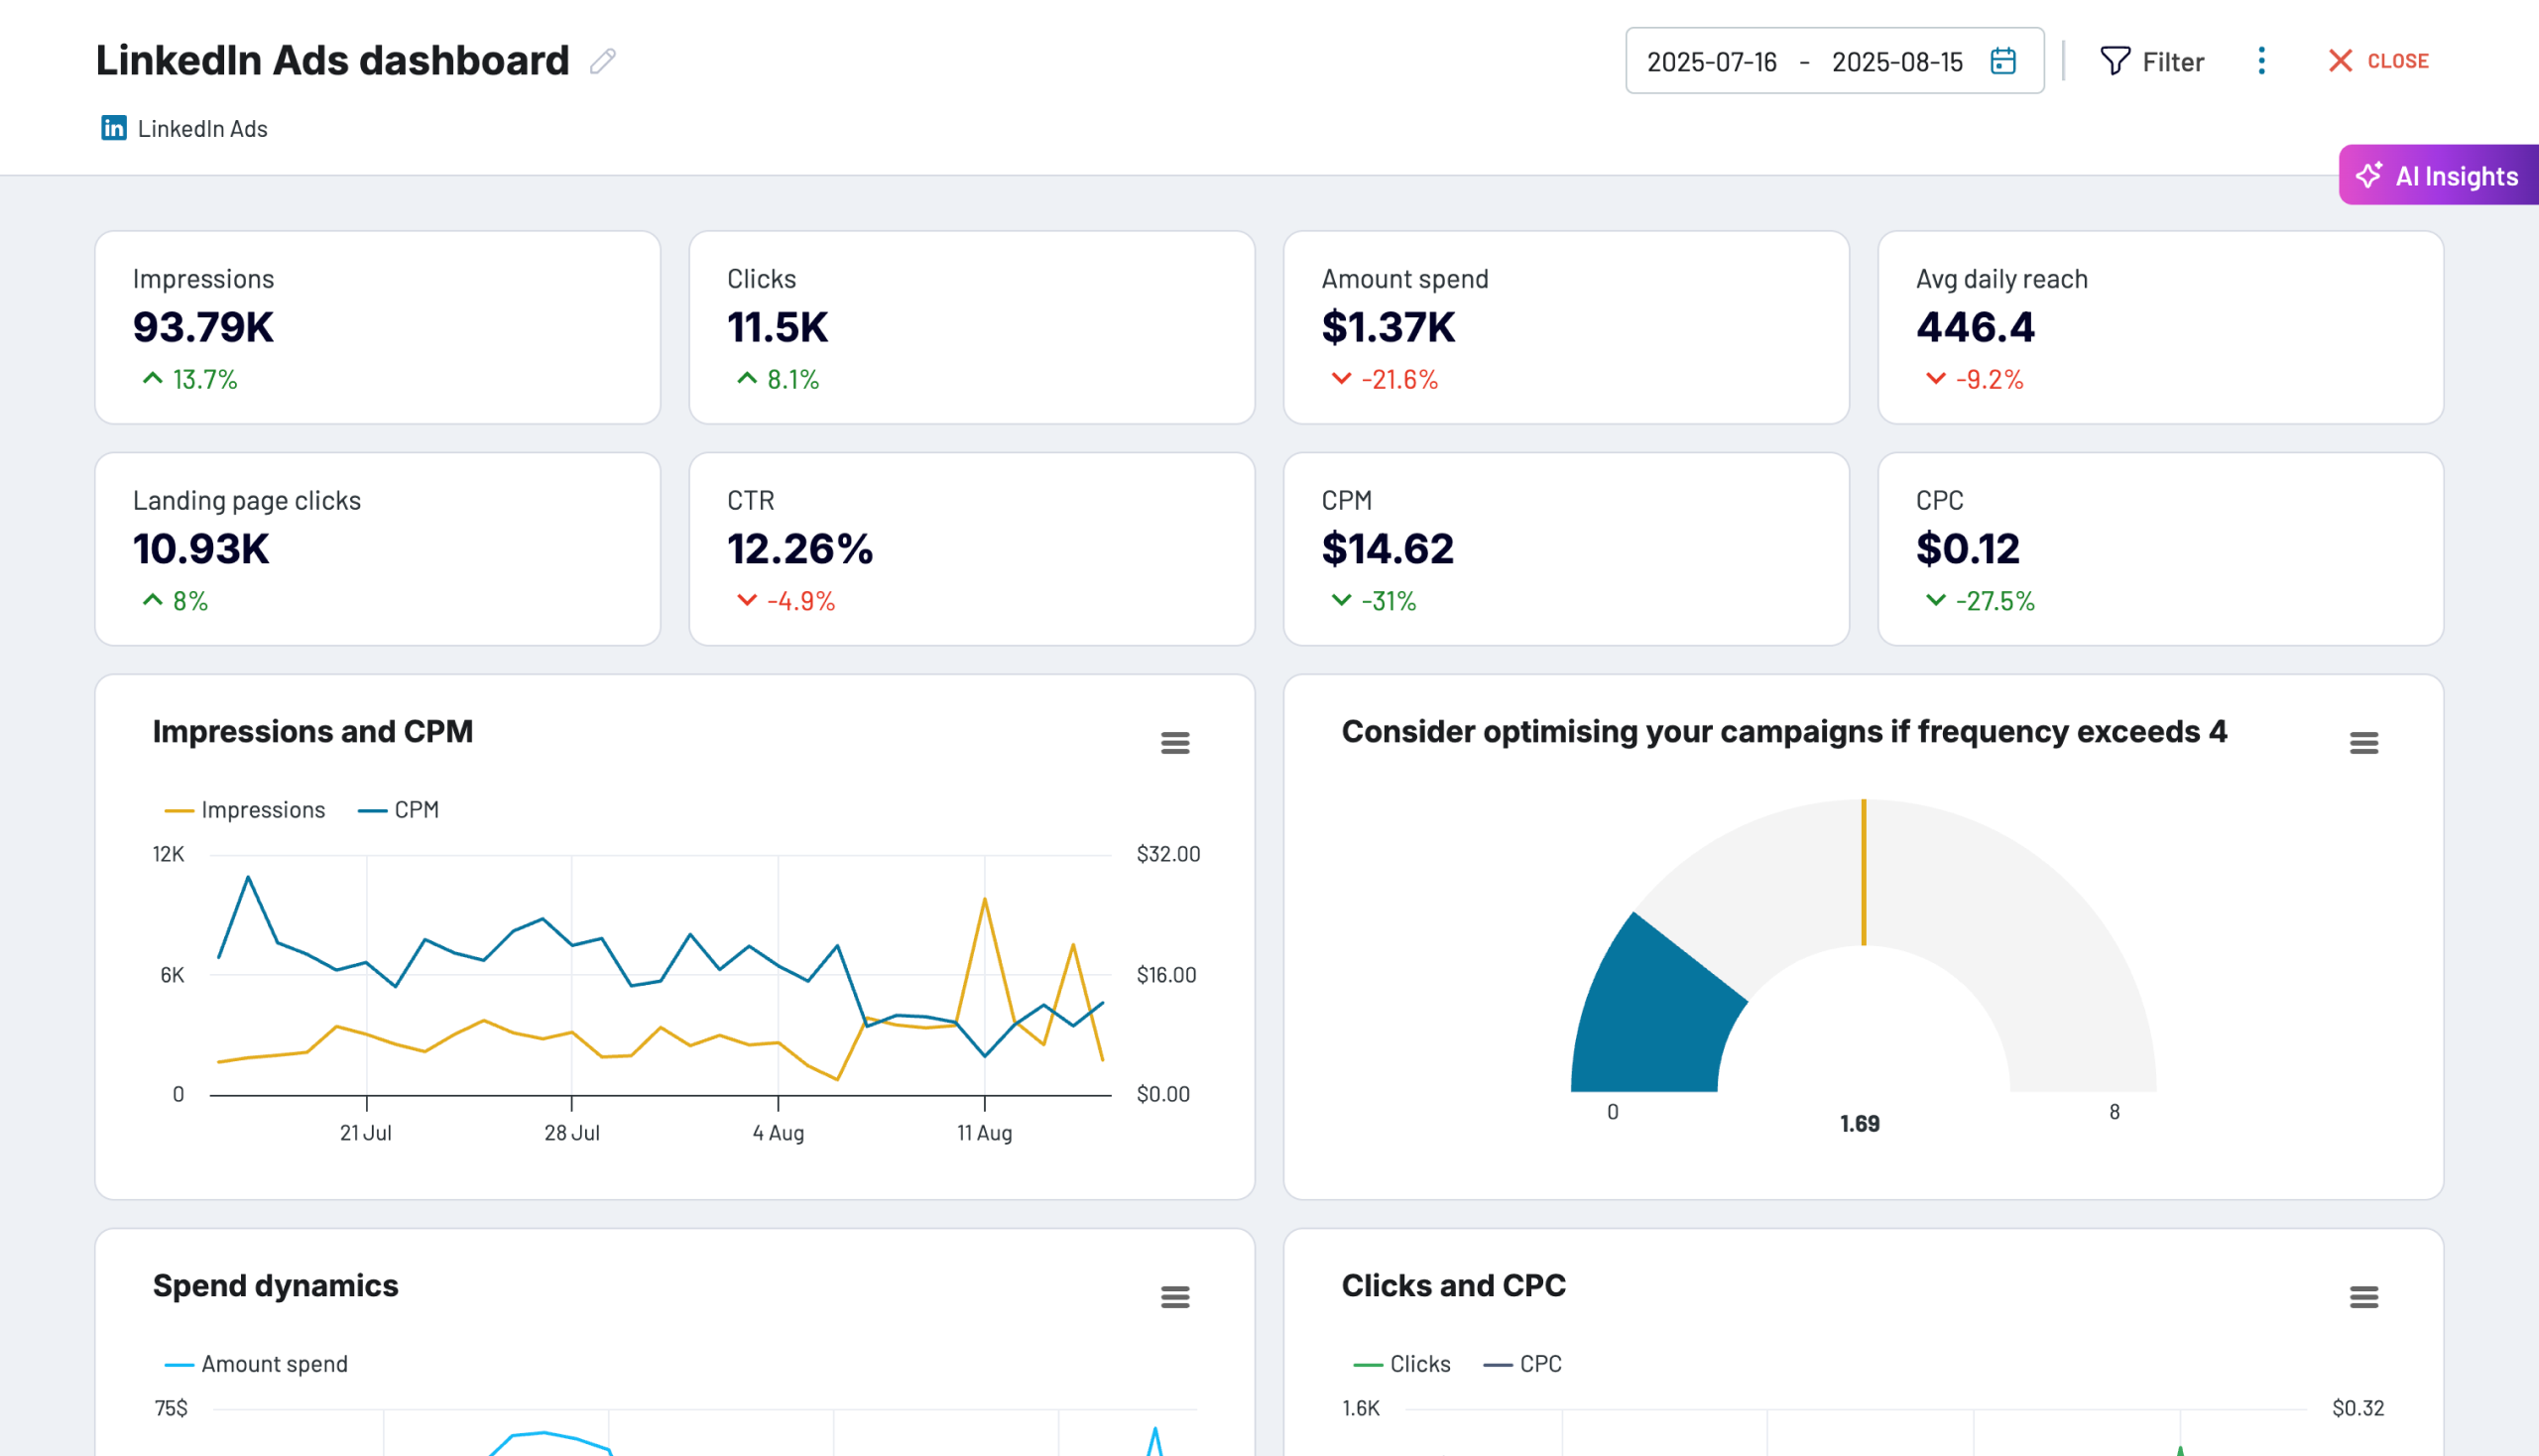
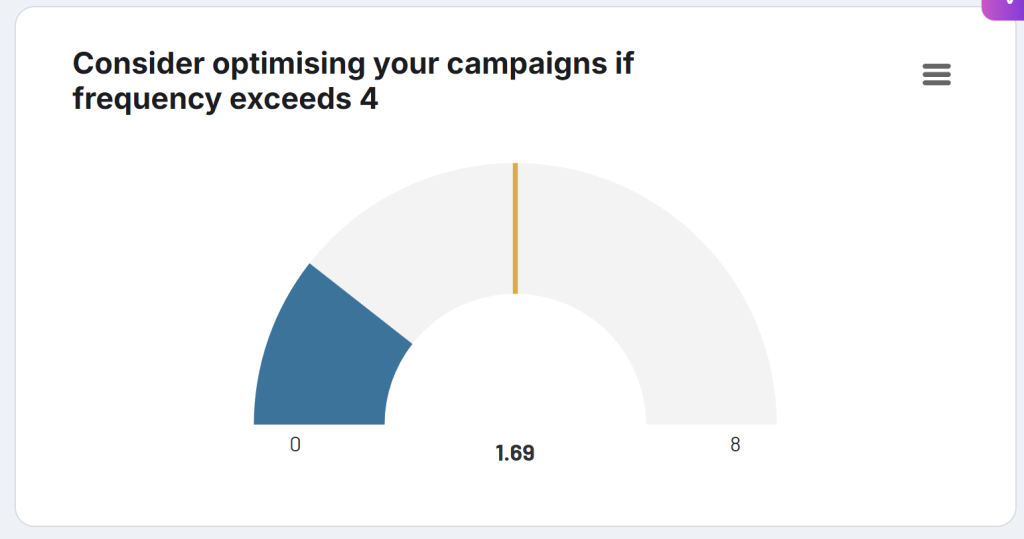
The dashboard allows you to filter by campaign for a detailed breakdown of performance. Use the gauge to monitor frequency and the table to directly compare the success of your campaigns.

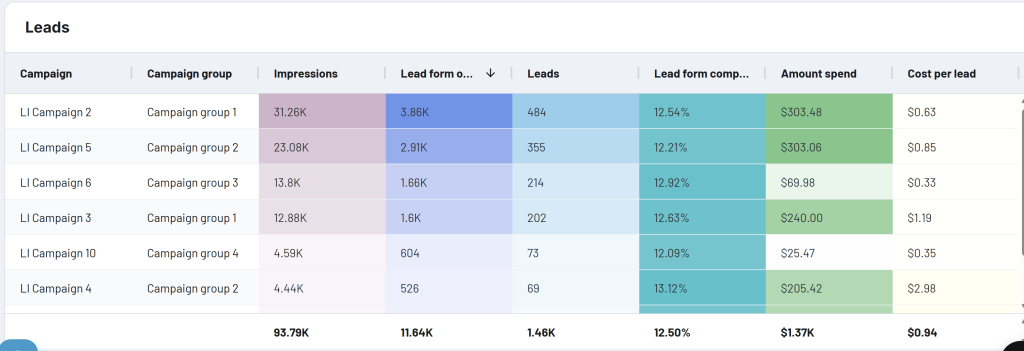
Meanwhile, there is a separate table for analyzing leads. It offers insights into conversion efficiency, growth over time, cost fluctuations, and campaigns that deliver the lowest cost per lead.

The dashboard is available in Coupler.io, as well as a template in Looker Studio, Power BI, and Google Sheets. Choose the version you prefer, sign up for Coupler.io, and connect your LinkedIn Ads data in minutes.







LinkedIn Ads leads dashboard
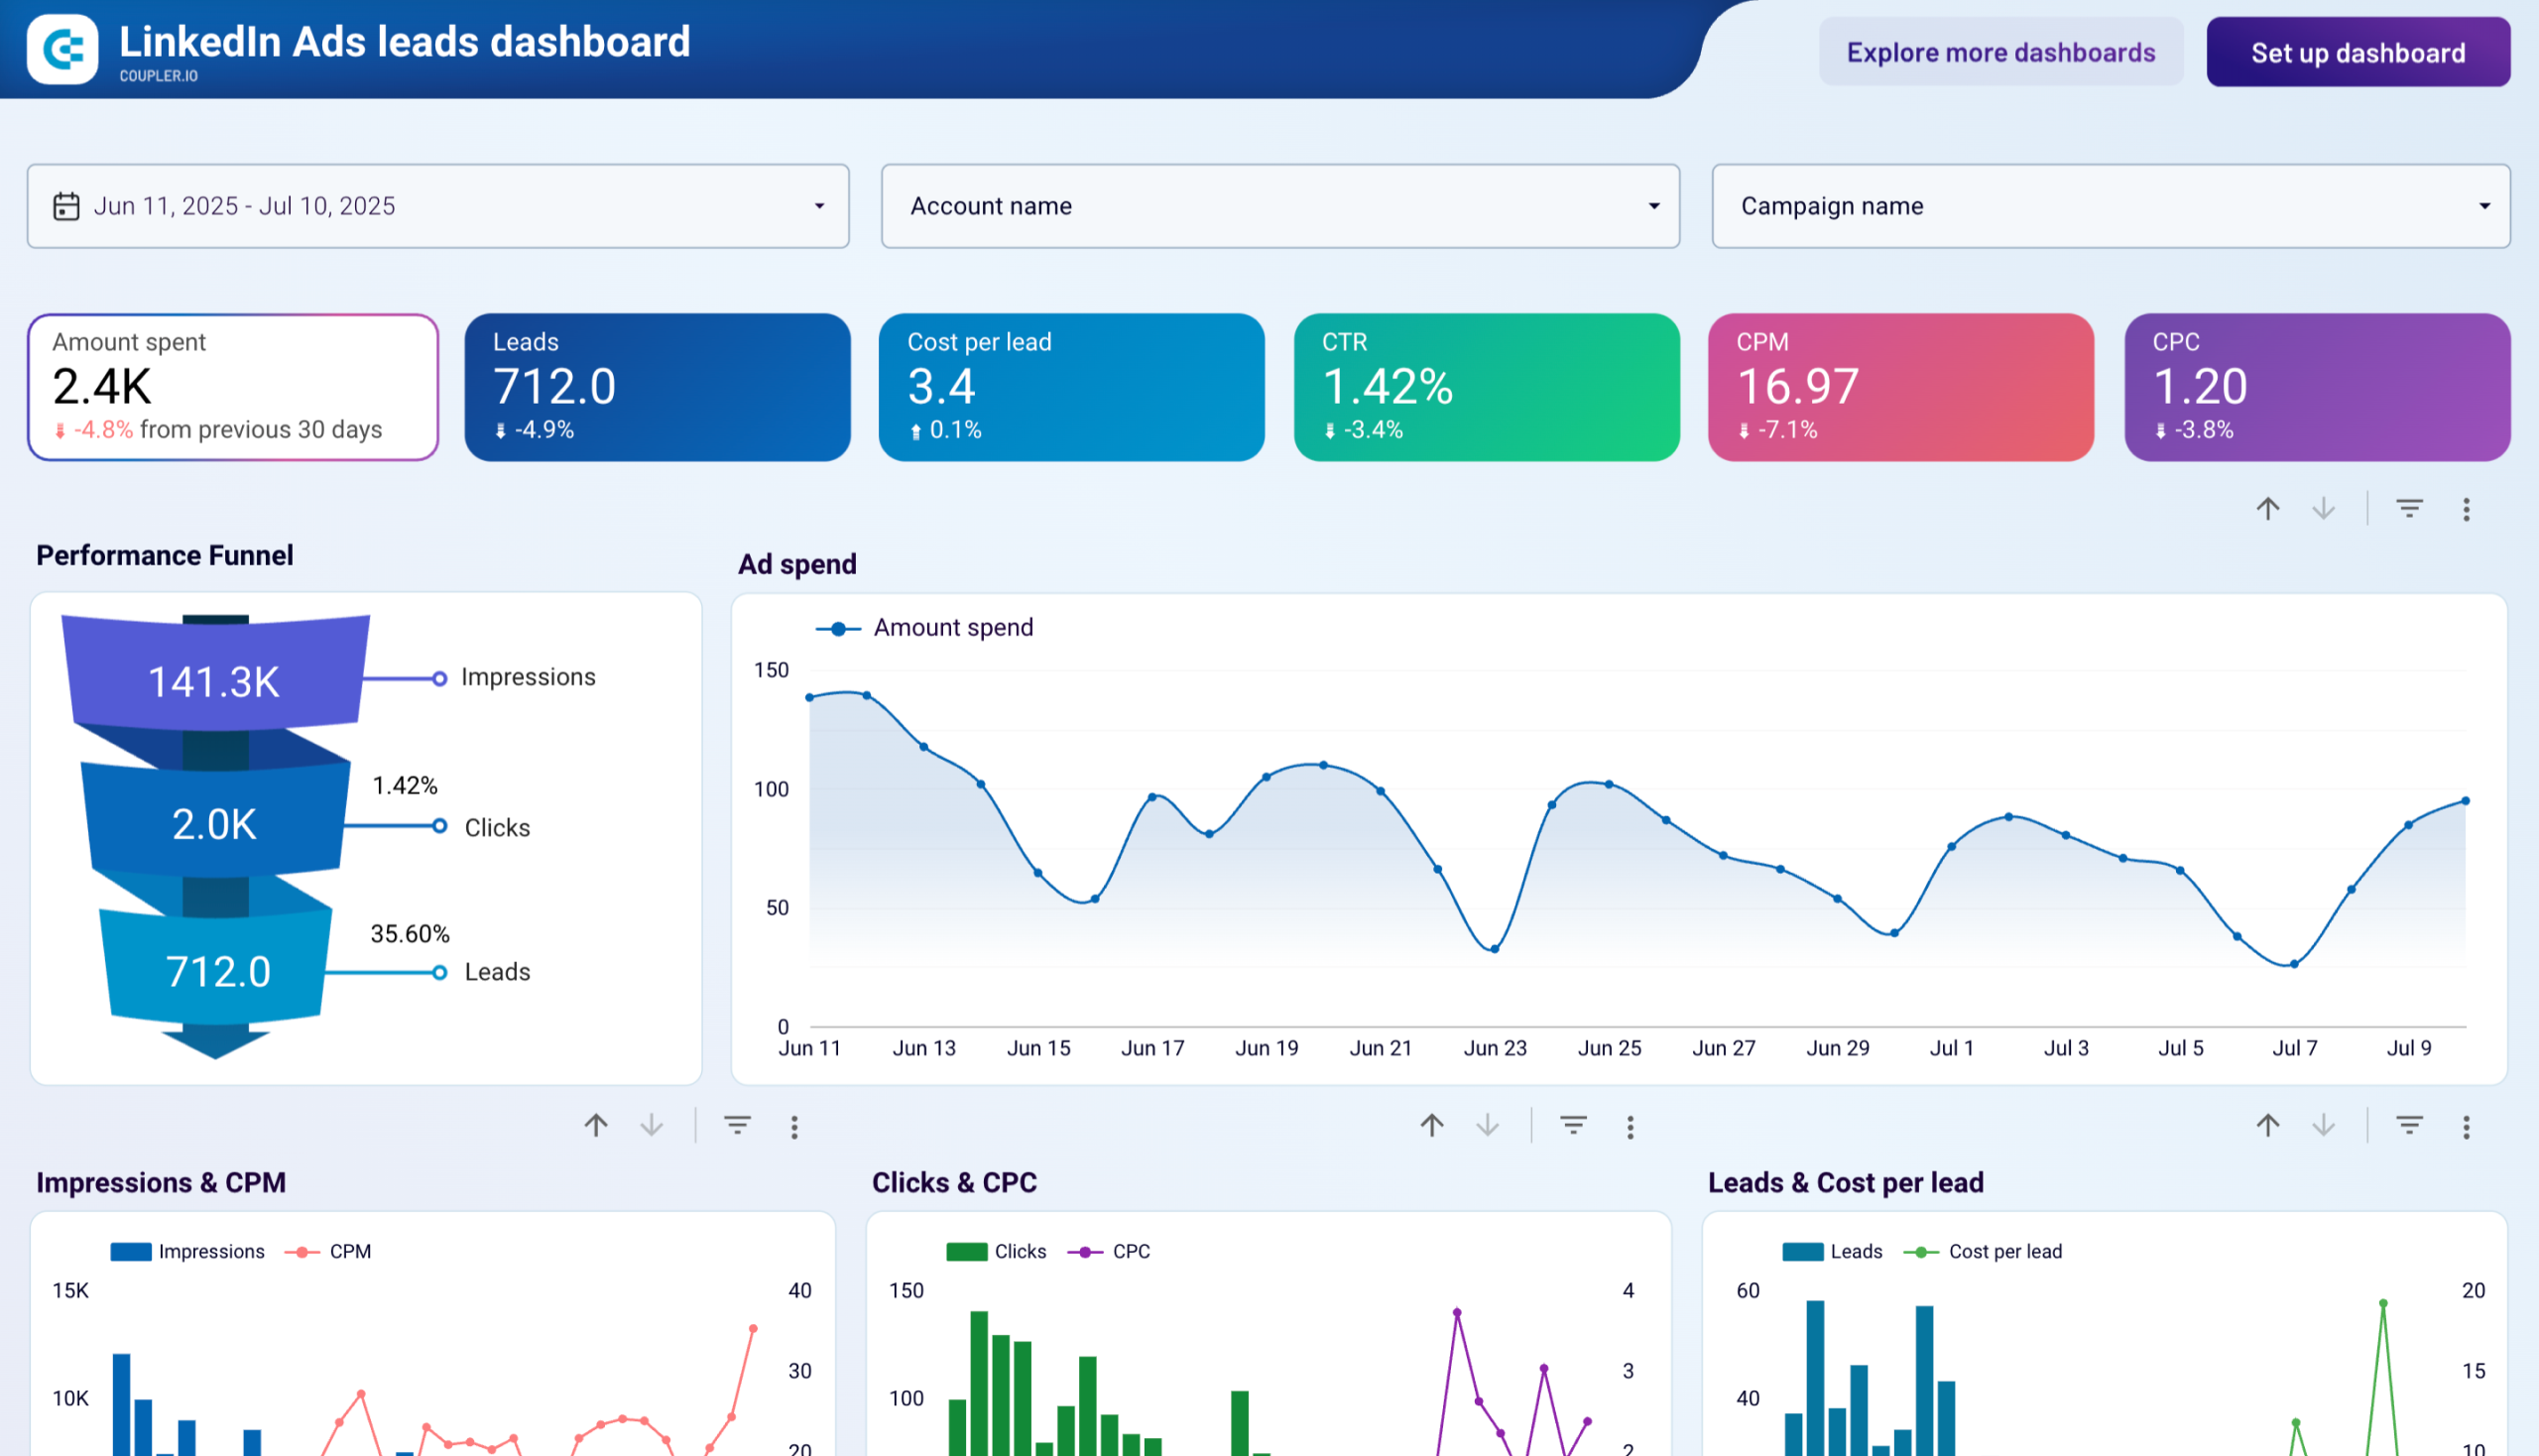
The LinkedIn Ads leads dashboard focuses specifically on lead generation performance from your LinkedIn advertising campaigns. It helps B2B marketers track lead acquisition costs, identify high-converting campaigns, and optimize budget allocation for maximum lead generation ROI.
Key insights you can get:
- Lead generation funnel analysis to identify where prospects drop off in the conversion process and which campaigns have the highest click-to-lead conversion rates
- Cost per lead benchmarking across campaigns with trend analysis to spot performance improvements or declines over time
- Budget efficiency insights showing the relationship between daily spend levels and lead generation volume to optimize spending patterns
- Campaign ROI comparison with detailed metrics breakdown to identify top-performing targeting strategies and creative approaches
The LinkedIn Ads leads dashboard is built in Google Data Studio by Coupler.io. Use the setup instructions to connect it to your LinkedIn Ads data in minutes.
LinkedIn Ads creatives dashboard
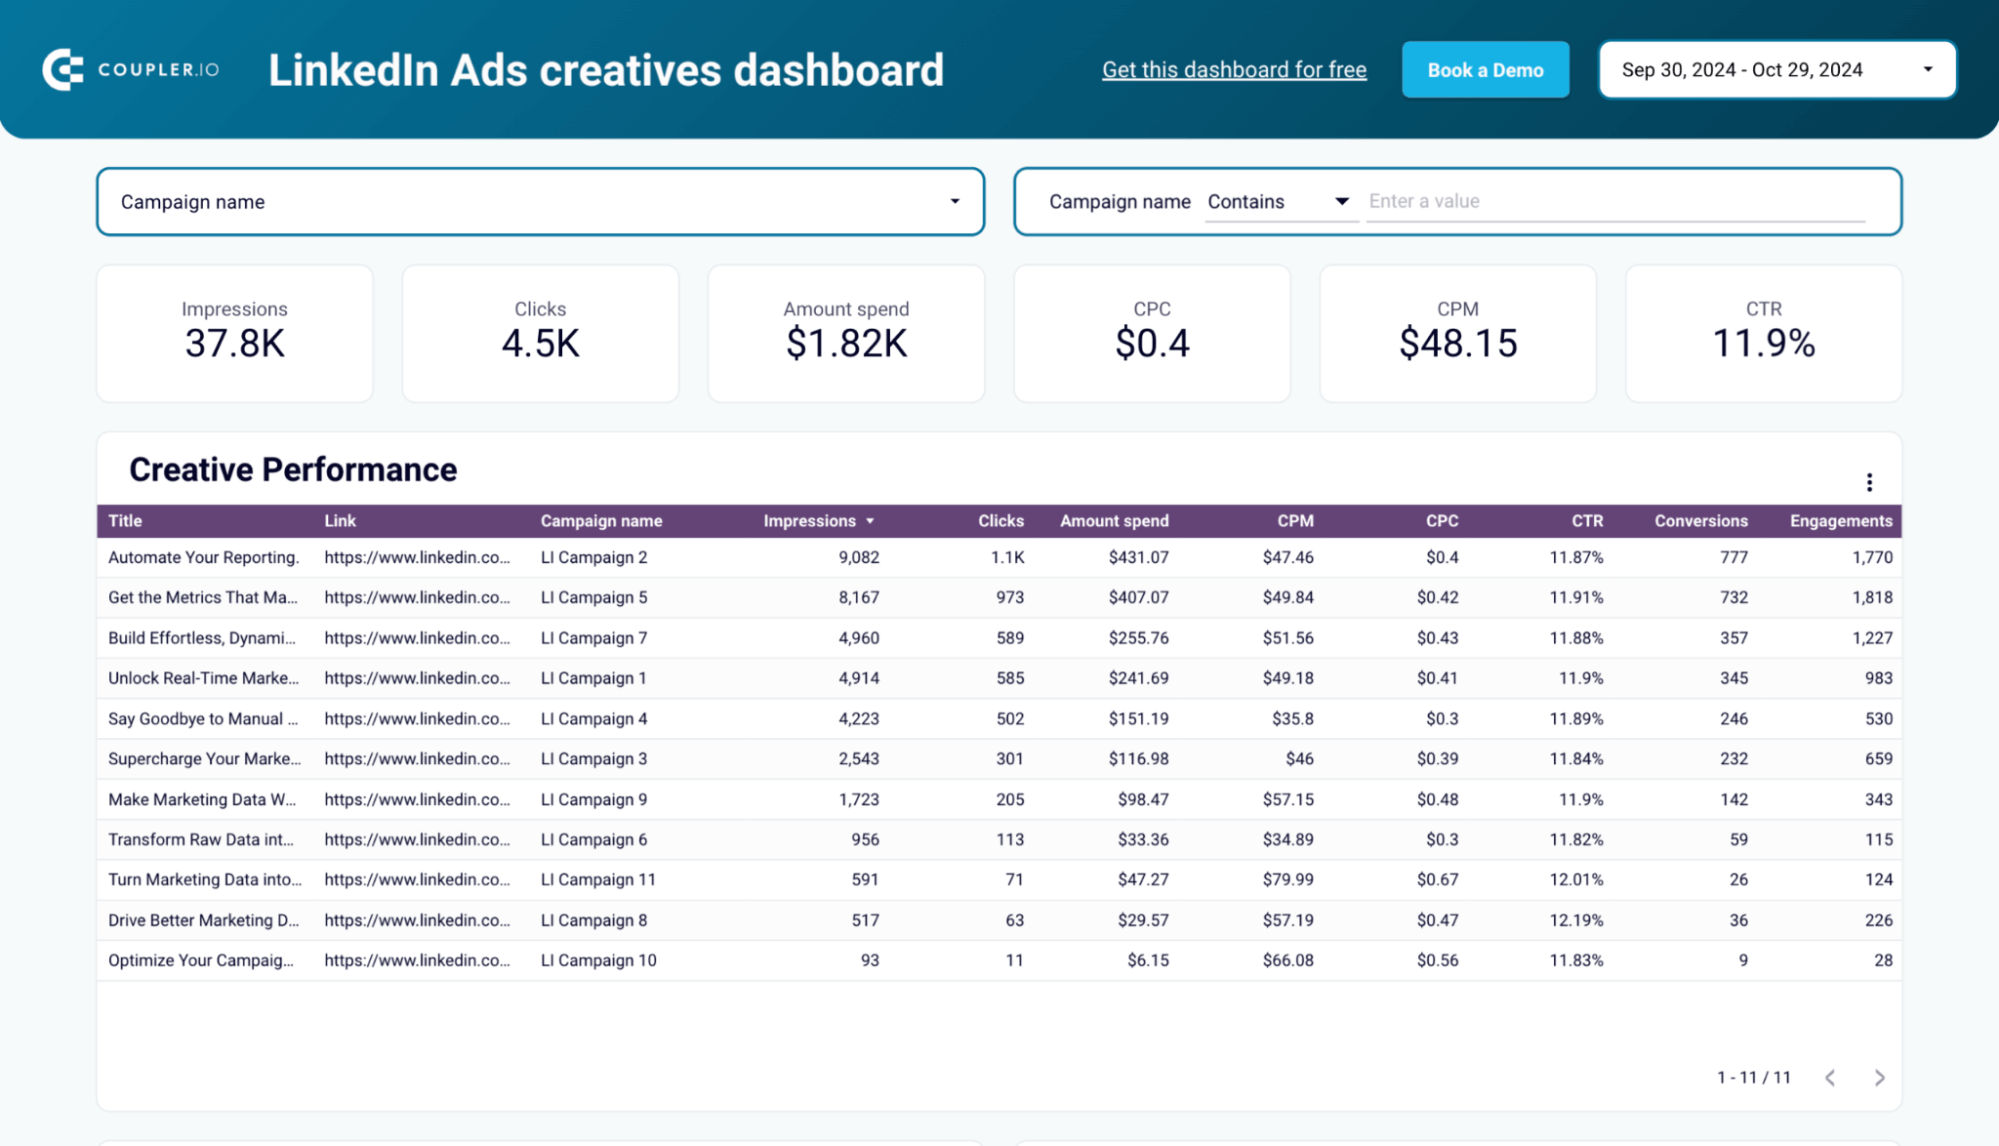
This dashboard template lets you analyze the performance of your LinkedIn ad creatives in detail.
LinkedIn Ads creatives dashboard

LinkedIn Ads creatives dashboard
Preview dashboardIt visualizes metrics like impressions, clicks, CPC, CPM, CTR, and engagements to understand which ad creatives are performing best and which need to be optimized.
It includes visuals like
- Impressions & CPM and Clicks & CPC charts to show trends in audience engagement and ad costs.
- Spend Dynamics chart to track ad spend over time.
- Creative Performance table to give a detailed breakdown of performance metrics for each creative.
The LinkedIn Ads Creatives dashboard template is built in Data Studio by Coupler.io. Check the setup instructions to connect this LinkedIn Ads dashboard to your data.
LinkedIn page and ads analytics dashboard
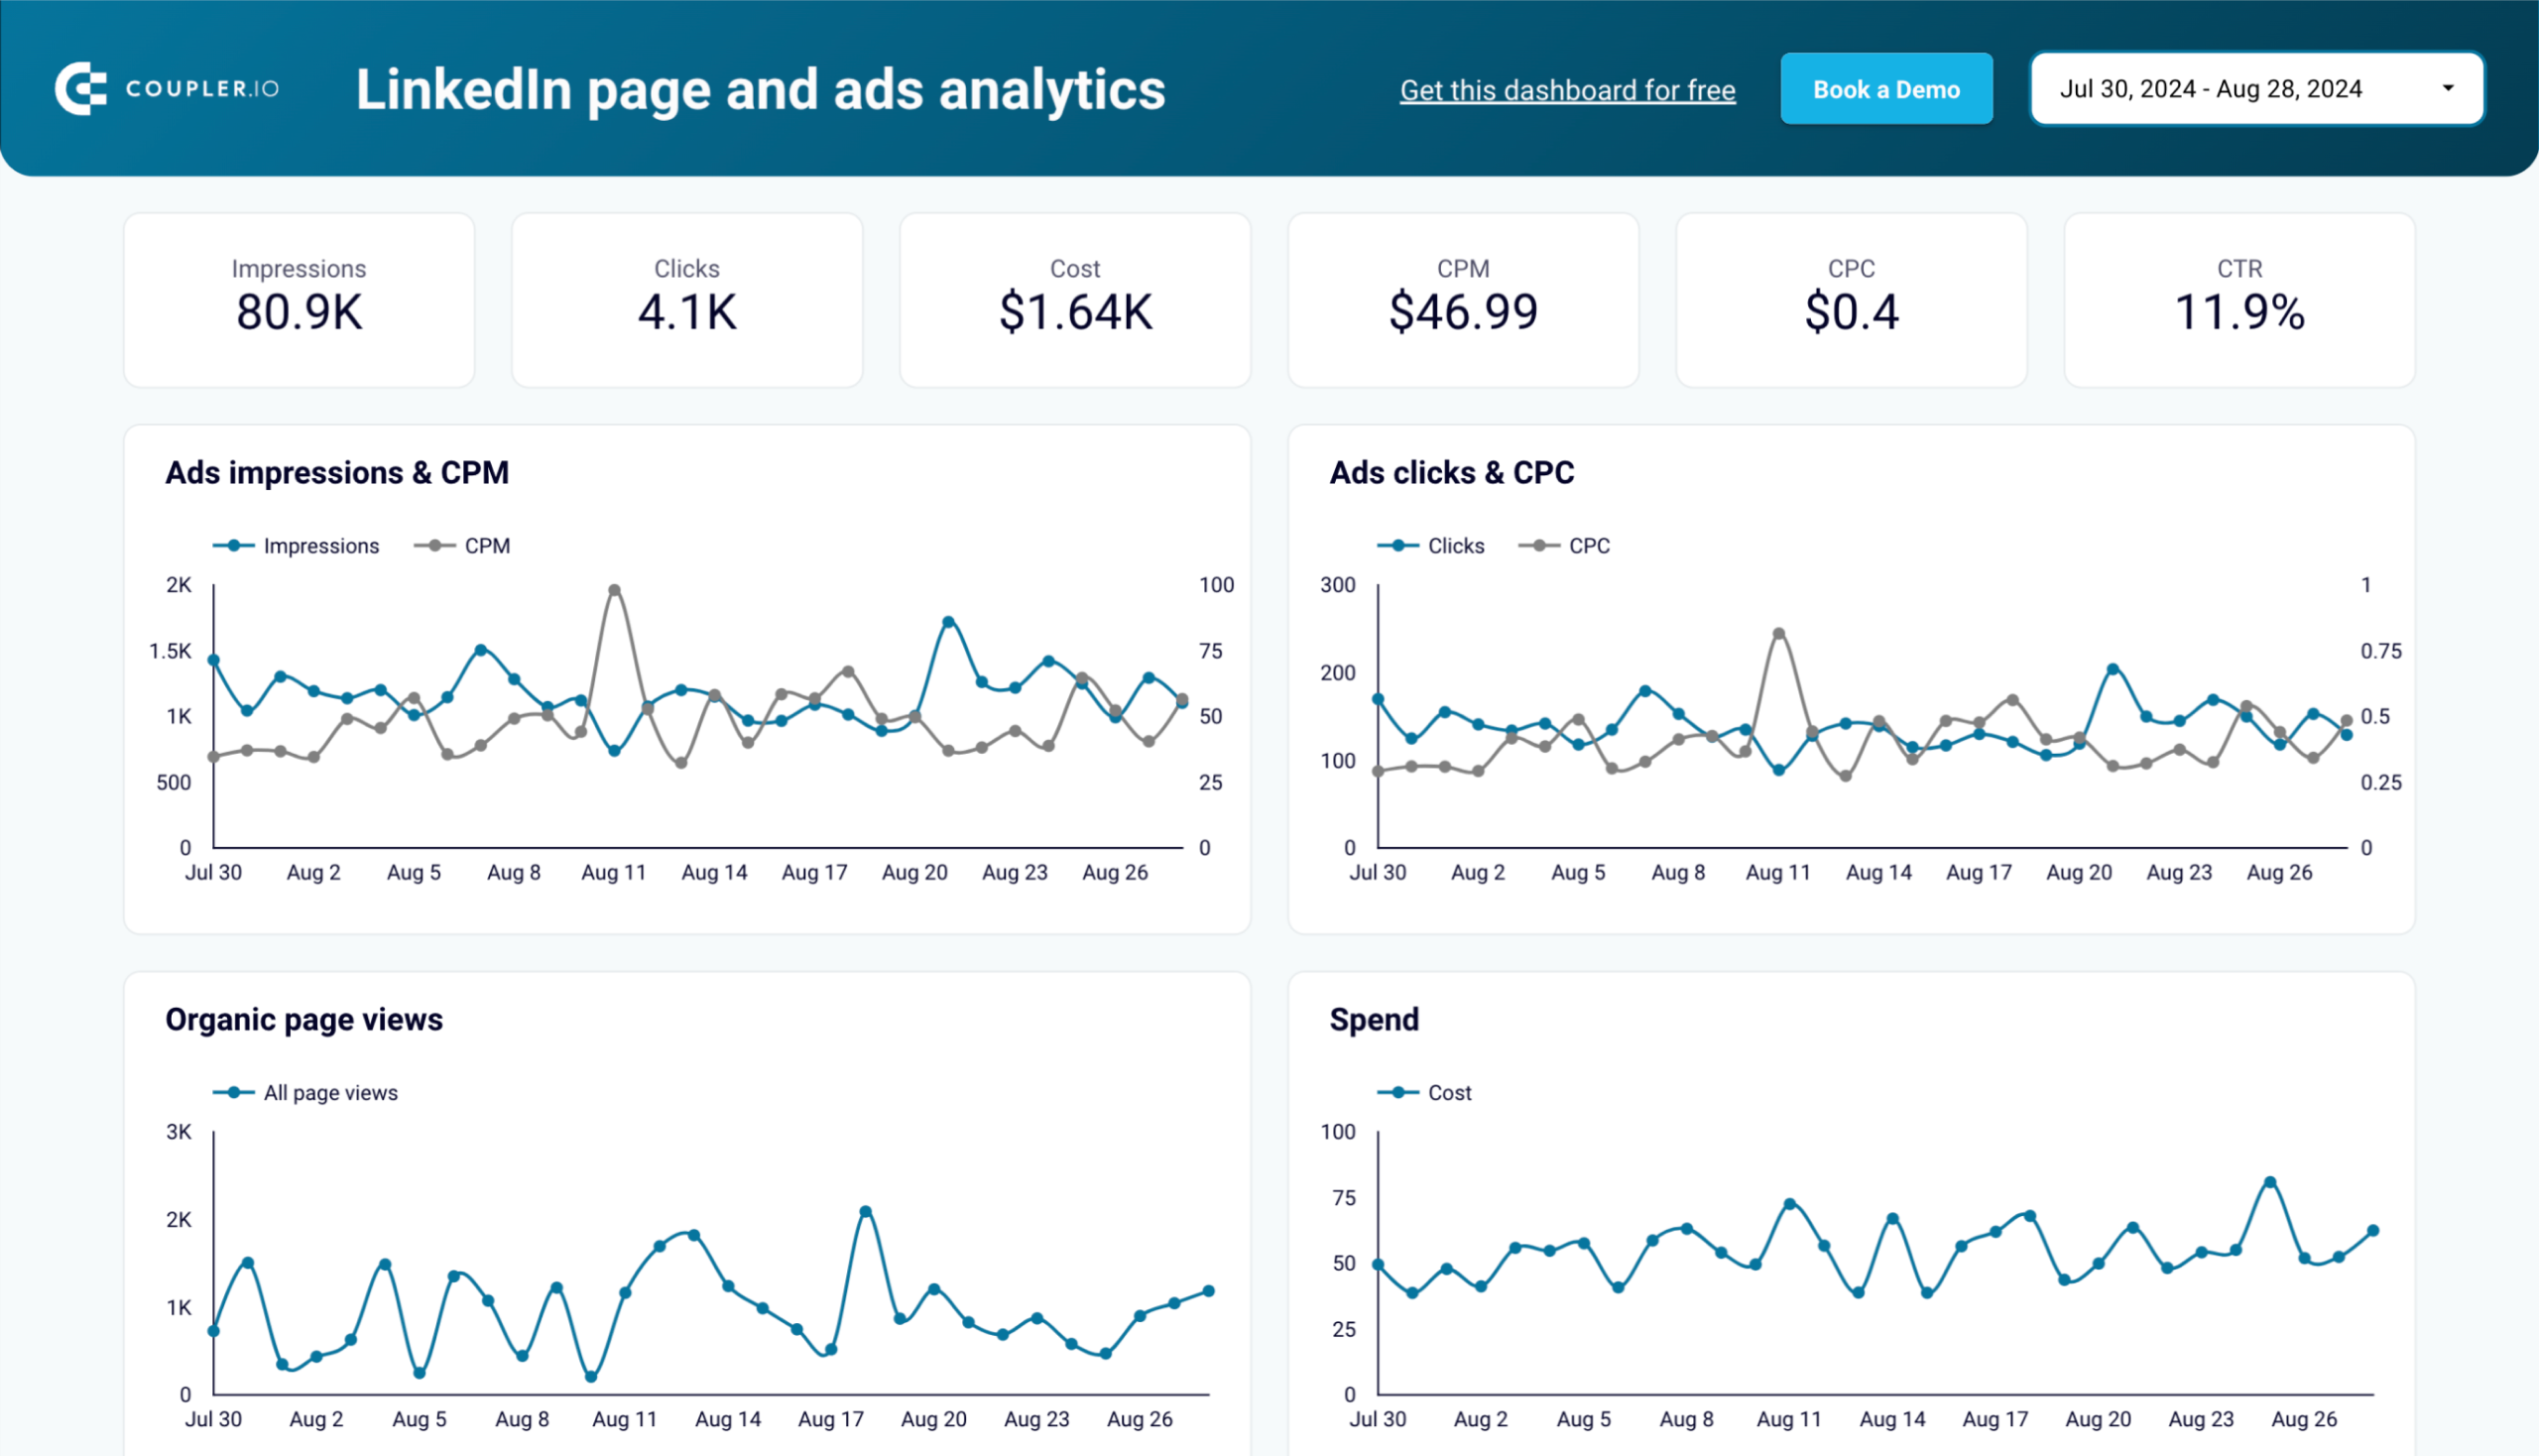
This dashboard combines insights from LinkedIn Ads and LinkedIn Company Pages, enabling you to monitor both organic and paid performance.
LinkedIn page and ads analytics dashboard
LinkedIn page and ads analytics dashboard
Preview dashboardWith a complete view of your LinkedIn presence, you can find opportunities to optimize content and campaigns easily. The visuals include:
- Ads Impressions & CPM and Ads Clicks & CPC charts to understand ad performance and costs. The Organic Page Views chart highlights content reach over time, while the Spend Chart tracks ad spend dynamics.
- Campaign Overview table to compare performance (impressions and page views) by country.
- Post Performance table analyzes likes, comments, and reposts to identify top-performing content.
The LinkedIn ads and analytics dashboard is designed in Google Data Studio and powered by Coupler.io. You can get the dashboard with your LinkedIn data in minutes by following the setup instructions.
Other methods to export LinkedIn Ads data
Coupler.io handles the connection, scheduled refresh, data transformations, and AI analysis. For recurring LinkedIn Ads reporting, it’s the recommended path. But if you need a one-time download or have a technical team that prefers custom integrations, these alternatives work for those cases.
Manual export
You can export LinkedIn Ads data directly from the Campaign Manager as a CSV file. Select the campaigns or ad analytics view, choose your date range and columns, and download the report. It’s straightforward for a one-off snapshot, but each time you need updated data, you’ll have to repeat the export and manually re-import it into your reporting tool.
Custom integration based on the LinkedIn API
You can write custom scripts to export data from LinkedIn company pages and LinkedIn Ads programmatically using the LinkedIn API. Coupler.io uses the same API under the hood. However, building your own integration gives you full control over the data structure and delivery. On the other hand, this requires proficiency in working with APIs and programming languages like Python. For teams without a technical background, the setup and maintenance overhead makes this impractical for regular reporting.
Why export LinkedIn Ads data with Coupler.io
Manual CSV exports and API scripts work for specific situations — a one-time audit or a team with engineering resources to maintain custom pipelines. For regular LinkedIn Ads reporting, Coupler.io removes the repetitive work:
- All LinkedIn Ads report types from a single connector — ad analytics, campaigns, creatives, video ads, sponsored leads, and more
- Scheduled refreshes that keep reports up to date without manual re-exports
- Transformations that filter, organize, and calculate before the data leaves
- Multiple destinations from one data flow — dashboards, spreadsheets, warehouses, and AI tools at the same time
- AI analysis through AI Agent inside Coupler.io or through external AI tools like Claude and ChatGPT via AI Integrations
Ready-made LinkedIn Ads dashboard templates get you from connected data to a working dashboard in minutes. And once the data flow is live, you can ask the AI Agent questions about campaign performance, creative fatigue, or CPL trends without leaving Coupler.io.
For more on running LinkedIn Ads effectively, see how to optimize LinkedIn Ads in 10 steps. And for a deeper look at LinkedIn Ads analytics workflows, check the LinkedIn Ads analytics guide.
Connect LinkedIn Ads data to dashboards, AI, and more with Coupler.io
Get started for free