We build Coupler.io. And yes, we eat our own dog food every day, across our entire data infrastructure. Here’s an honest look at what it’s like from our team: multiple data flows, one source of truth, and a few patterns worth stealing.


TL;DR
Our data stack runs on one rule: BigQuery is the single source of truth for everything. Here’s what that means in practice:
- 500+ data flows across our systems with over 300 of them using Coupler.io to move data in and out of BigQuery
- Sales, HR, and content teams all work from reports backed by a single BigQuery source
- Zero data living in standalone spreadsheets, disconnected dashboards, or third-party tools
- Non-technical team members can update shared data without filing a single ticket
The challenge we were solving
Before we locked in on this architecture, our data had the same problem most growing companies run into: it was everywhere.
Reports lived in spreadsheets. Dashboards pulled from different sources. Someone would update a product name in one place, and it wouldn’t reflect somewhere else for days. Sales automations would fire on stale data. When someone asked what's the actual number?, there was no clean answer. And the root cause was a lack of a single place where everything could come from.
BigQuery became that place, and Coupler.io keeps it fed: moves data in from every source and out to every tool that needs it, on a schedule, without engineering overhead. What follows is based on conversations with the people who built and maintain this stack day to day: Elvira Nassirova (Analytics Engineer and Data Team Lead), Piotr Małek (Analytics Engineer), and Olexander Paladiy (Product Director).
The architecture we landed on
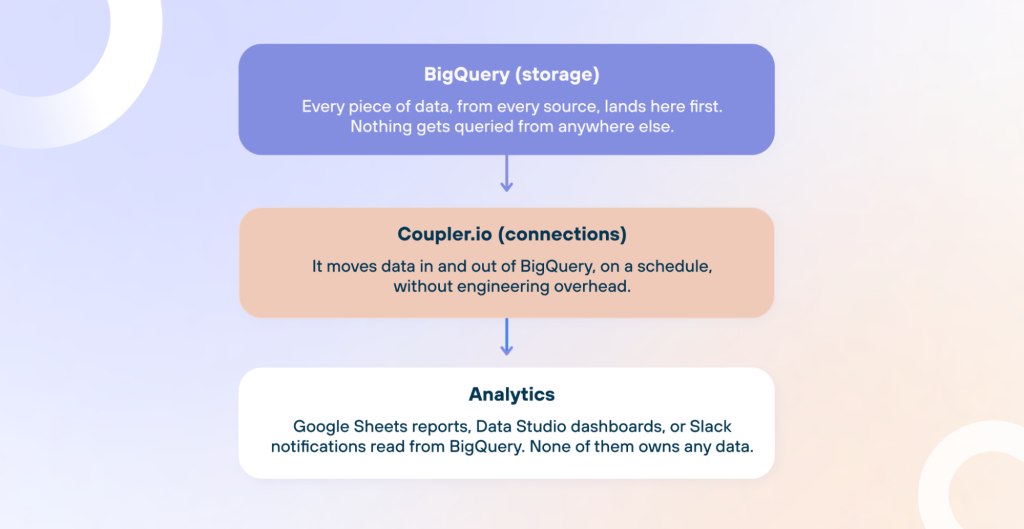
Olexander, Product Director at Coupler.io, frames it in three layers: storage, connections, and analytics.
BigQuery is a storage. Sales data from Pipedrive, ad performance from LinkedIn and Meta, SEO data from Search Console, survey results from Google Forms — all land here before going anywhere else. No report, dashboard, or automation pulls from any other source. It is the rule that makes everything else work. When two people look at different numbers, it is almost always because the data came from two different places. One source eliminates that problem entirely.
Coupler.io is connections. A new data source takes minutes to set up, not days. The data team does not build or maintain custom BigQuery integrations for every new source. When a flow breaks, an alert goes out before anyone notices something is wrong. This matters more than it sounds. APIs change. Platforms update their authentication. Without something watching the connections, broken flows go undetected until someone asks why the dashboard looks off. With over 300 flows running through Coupler, the team could not realistically monitor each one manually.
Everything downstream is analytics. Google Sheets reports, Data Studio dashboards, and Slack notifications all read from BigQuery; they don’t own any data. This means there is no separate copy of the data living inside a tool that someone forgot to update, and no spreadsheet one person maintains quietly while the rest of the team treats it as the source of truth.

Check out how to use BigQuery for data analytics.
Elvira, Analytics Engineer and Data Team Lead at Coupler.io, explains what that means for how dashboards get built:
When we use Data Studio for internal dashboards, we create a table in BigQuery and connect Data Studio directly to it. This way, we eliminate a third tool that we would otherwise need to control.
What we ingest into BigQuery
We pull data from many Coupler.io data sources: sales tools, ad platforms, analytics, surveys, and more. Not every integration is equally straightforward. Some sources have messy APIs, some require lengthy approval processes, and some just lose your data after a certain point. Below are a few handpicked examples and what it actually took to get them working reliably.
We also blogged about how to import data into BigQuery.
Sales data (Pipedrive)
Sales teams use Pipedrive CRM; they needed access to deals, persons, organizations, and products from Pipedrive, and the automations running on top of that data needed it to be fresh. When a decision to trigger an MRR update depends on what’s in Pipedrive, stale data means the wrong call. And if something broke, the team needed to know right away, not hours later when a report looked off.
The bottleneck: Building and maintaining direct integrations for all of that from scratch wasn’t realistic. And even if it were, there was no built-in way to know when something broke.
The fix:
- Coupler.io pulls selected Pipedrive entities (deals, persons, organizations, products) on an hourly schedule

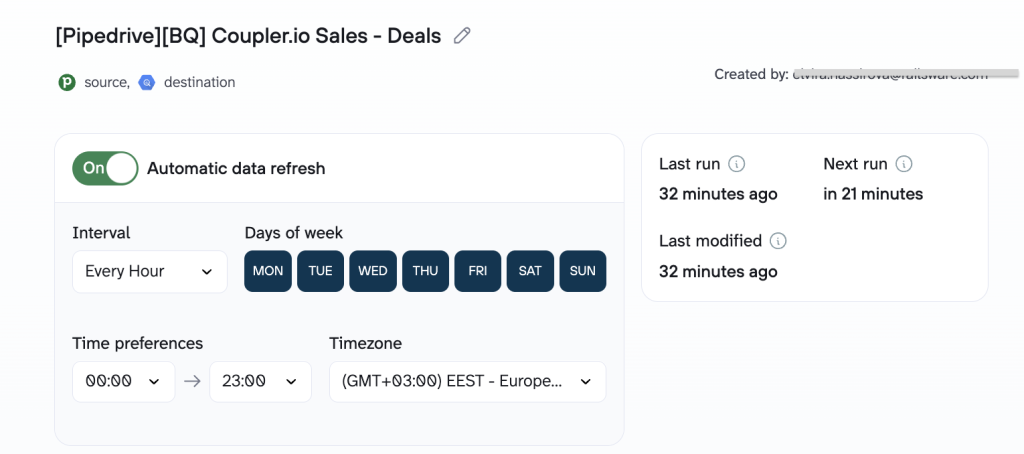
- Data lands in BigQuery, where it powers dashboards and feeds downstream automations
- If a sync fails, the responsible person gets an email immediately
We have a lot of automations that rely on very recent data. Coupler.io sends data very regularly, and if something breaks, it sends an email to the person. So it’s very easy to spot when some issues appear.


The output: A live Pipedrive mirror in BigQuery, available to all three sales teams, refreshed every hour.
The payoff: No custom-built Pipedrive integration. No engineering tickets to add new entities. You specify the entity, the fields, and the destination. That’s it.
It saves us a lot of time by not building these integrations from scratch, as we need multiple entities from Pipedrive, like persons, organizations, and deals.


Ad performance (LinkedIn & Meta)
And here is an example of how we use BigQuery for marketing data analytics. To pull data from LinkedIn’s API directly, a team needs to register a developer app on LinkedIn’s platform and wait for LinkedIn to approve it. That approval is not guaranteed and can take a long time. Meta works differently: the API access itself is easier to get, but the raw data it returns is messy. Something as basic as daily clicks and impressions requires significant cleanup before it’s usable in a report.
The bottleneck: The marketing team needed ad performance data in BigQuery without dealing with LinkedIn’s API approval process or spending hours cleaning raw Meta Ads data.
The fix:
- LinkedIn connects via Coupler.io with a simple OAuth sign-in (no app creation, no approval waiting)
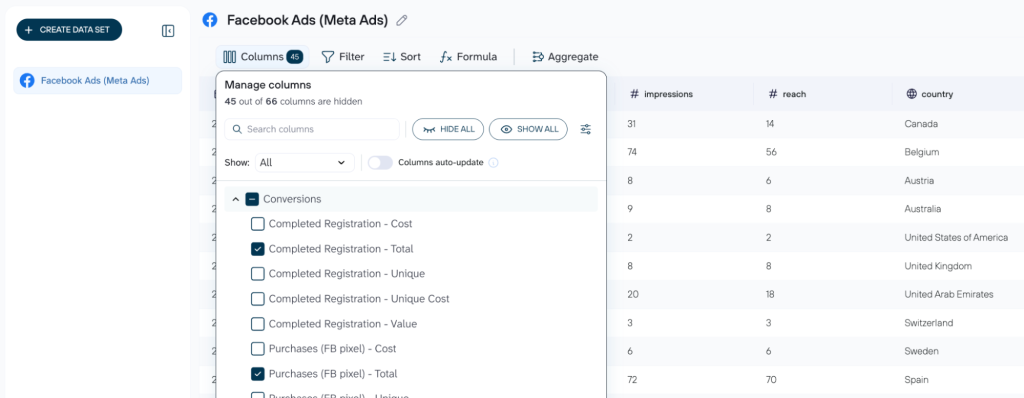
- Raw Meta Ads are filtered and sorted in Coupler.io before it lands in BigQuery, so daily clicks and impressions arrive clean

- Both sources refresh on schedule alongside all other data flows
The output: Clean, queryable ad data in BigQuery, ready to join against revenue, signups, or anything else.
The payoff: Coupler.io handles the authorization layer for LinkedIn, so the marketing team doesn’t have to. And for Meta, Coupler.io delivers the data aggregated and ready to use.
Connecting LinkedIn through Coupler.io is basically sign in and done. As a user, you don’t need to request any approvals because they know this app. Working with Meta also requires zero effort. You just pull up rows for precisely what we send to dashboards.
SEO history (Search Console)
Google Search Console only keeps data for around 16 months and then deletes it from the platform permanently. The problem is that nobody notices until someone asks a historical question, and by that point, there is no way to get it back.
The bottleneck: The content team needed a longer SEO history than that (ideally, years’ worth) to spot trends and answer historical questions from the content team.
The fix:
- Coupler.io syncs Search Console data to BigQuery on a rolling schedule

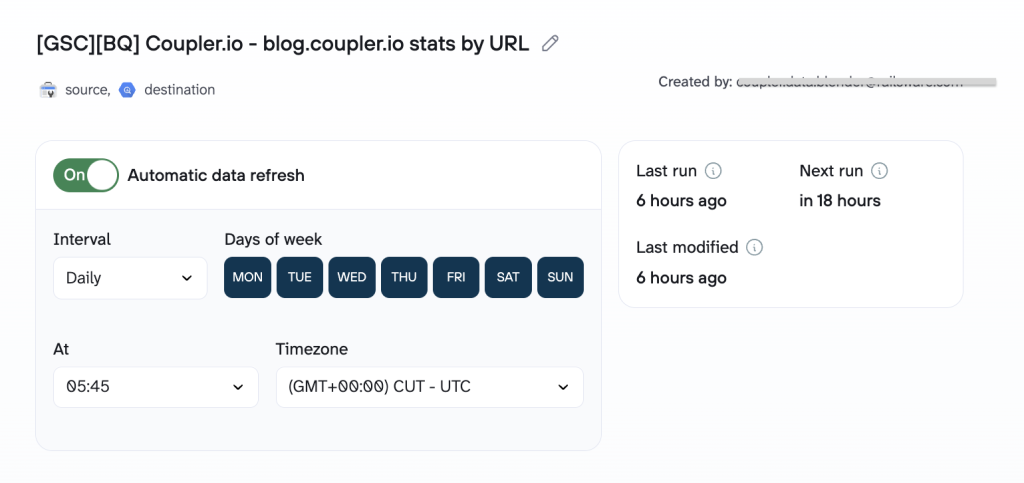
- Data accumulates over time, well beyond the 16-month platform limit
- The content team queries it alongside GA4 data for any time range they need (Coupler.io also offers pre-built dashboard templates for SEO reporting)
The output: A growing historical SEO dataset that will keep compounding in value the longer we run it.
The payoff: We learned this lesson the hard way. Someone asked whether Coupler.io could pull Search Console data from three years ago. At that moment, it couldn’t. But now it can, using the incremental fetching feature.
By importing it with Coupler.io, you can save it to BigQuery and have a much longer history. So now we’re prepared.
What goes out of BigQuery
Data doesn’t just flow into BigQuery; it flows out too. Once everything is centralized, the challenge is to make it accessible to people who don’t write SQL. Here are several examples of how we route data out of BigQuery and into the hands of the teams that need it.
Google Sheets reports for non-technical teams
Giving non-technical team members direct BigQuery access creates its own problems. Queries break, filters get misapplied, etc. But keeping data locked inside it meant every report request landed on the analytics team. Two options, both bad.
The bottleneck: Most people at Coupler.io aren’t data engineers. They need reports they can open, filter, and act on without writing SQL or getting access to BigQuery.
For non-technical readers who just need to filter the data, Piotr says:
I apply filters outside because if you don’t know SQL, it will be hard for you to edit it. But this kind of filter you can expose easily. And the person who just needs this data can adjust it freely.
The fix:
- Elvira builds a BigQuery view or table with all necessary joins, calculations, and logic, and connects it to Coupler.io.

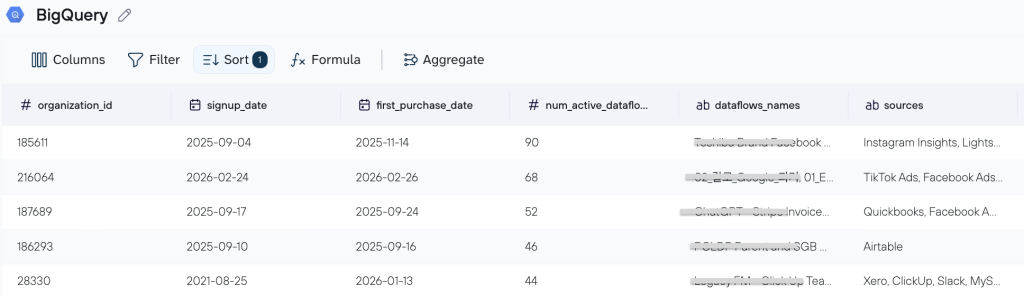
A common use case for me is creating a table data view in BigQuery with all the needed calculations based on multiple sources, like Pipedrive, spreadsheets, or HubSpot. I unite, calculate, and publish this report, then send it to Google Sheets on a schedule using Coupler. This is a report that can be used by an end user.
- Coupler.io pushes that output to Google Sheets on a selected schedule
- Non-technical users interact with the sheet while the underlying query stays untouched in BigQuery.
Here’s an example of a regular content updates model that the content team uses daily. Each row is a blog post URL tracked by keyword position over time, search volume, and new users per month. The content team can filter by date, sort by traffic, or check ranking trends without opening BigQuery or writing a single query. The data refreshes automatically on a schedule. The sheet is always fresh, and the underlying query stays untouched.

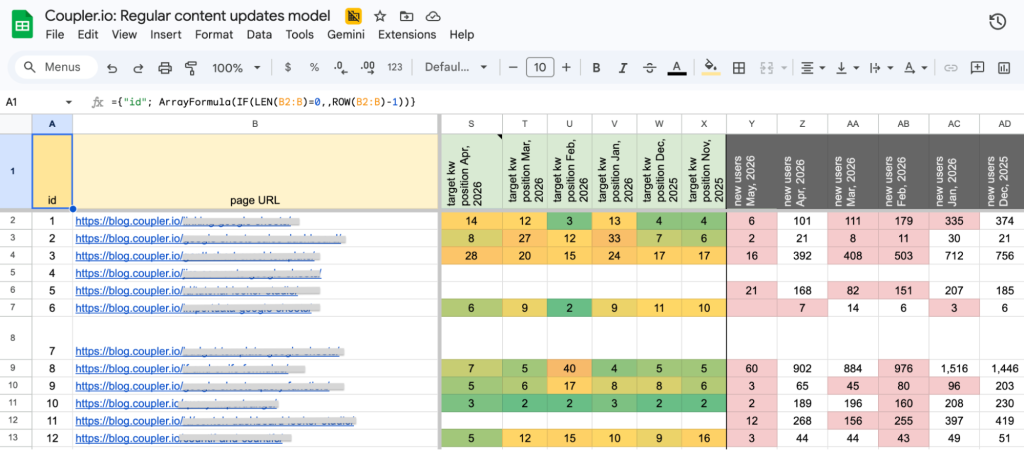
The output: Hundreds of live Google Sheets reports, including blog engagement and SEO dashboards the content team uses daily.
The payoff: Users get the flexibility of a spreadsheet without the data integrity risk. The source of truth stays in BigQuery.
Coupler.io also handles something that sounds small but used to cause real friction: column names. BigQuery uses technical names; the people reading reports don’t speak that language.
I use Coupler.io to rename columns. In BigQuery, we usually have technical names, and I rename them to a more readable format. This is really helpful because before we had workarounds where we either left it as is or created a separate tab to rename columns.
Multiple destinations from one BigQuery source
Coupler.io supports multiple destinations, so the same BigQuery data can land in Google Sheets, Looker Studio, and Claude at the same time. Feed Claude a live export from BigQuery and you can ask questions about your pipeline health, revenue trends, or lead qualification in plain language. No duplicate flows, no manual exports, no asking the data team to set up a separate pipeline for each team that needs access.
And on top of that is the Coupler.io AI Agent. You don’t need to export data or write a query to answer a business question, you can ask it directly inside Coupler.io. For example, here is our Blog performance report built in Data Studio.

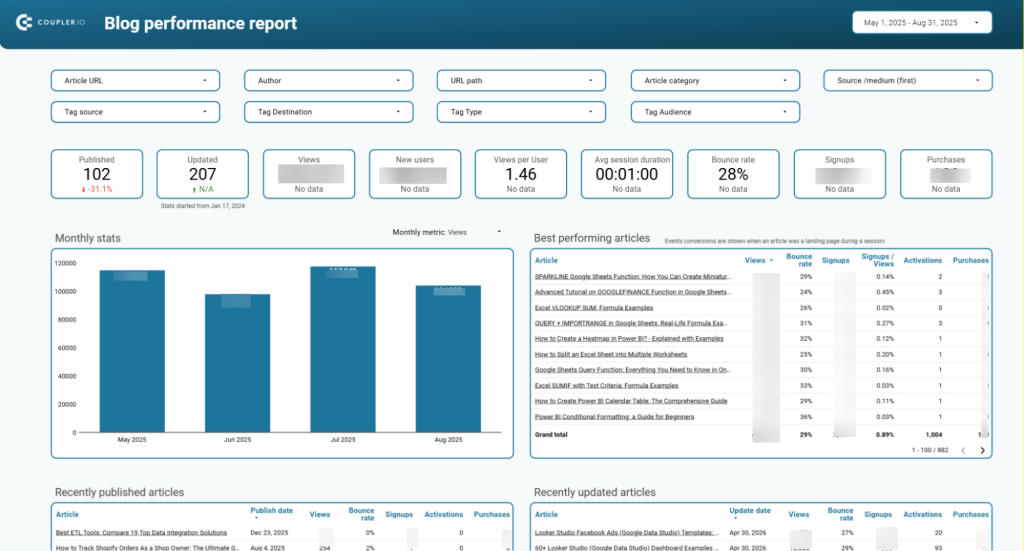
The data source for this dashboard is BigQuery. Meanwhile, in the data flow for it, you can easily talk to the AI agent to reveal something that is hard to find in the dashboard. For example, create a performance overview of certain types or groups of blog posts, detect low/high performance content that was updated recently, and so on.

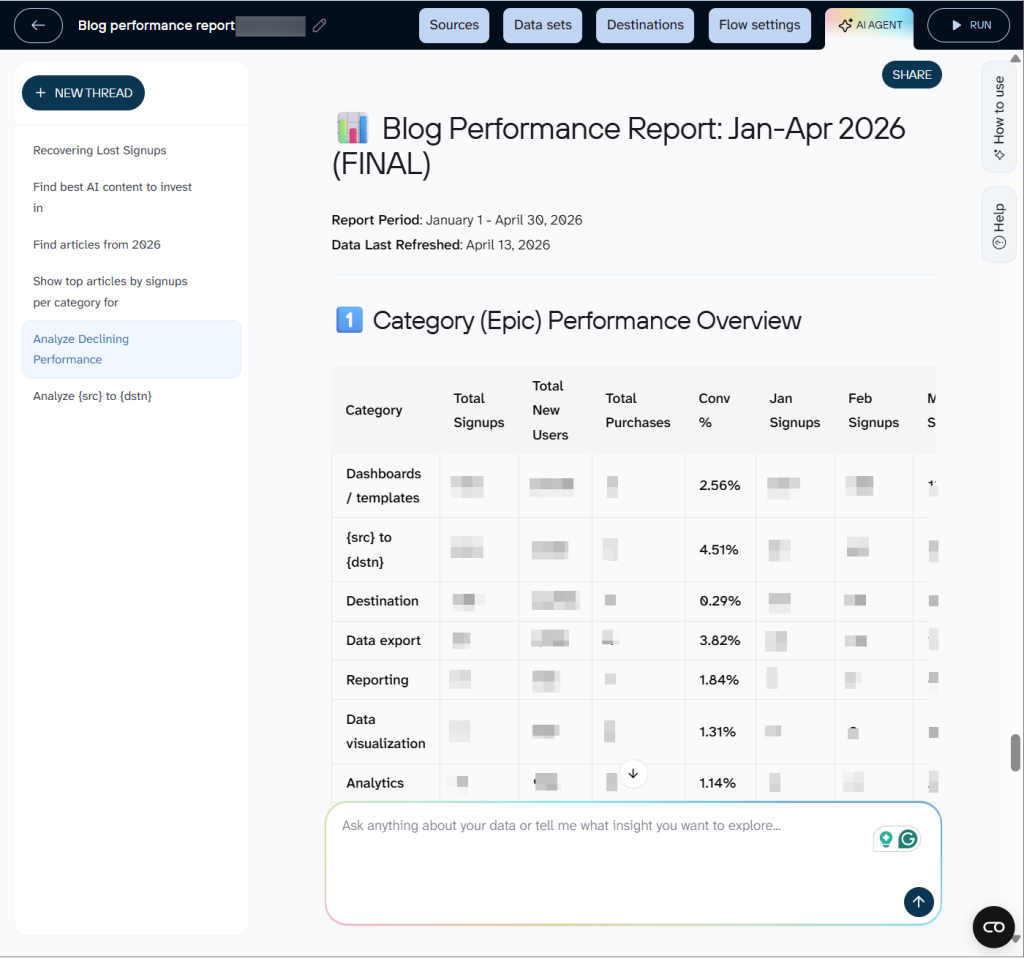
The kind of analysis that would normally take an analyst an hour to pull together takes a few seconds. And because it reads from BigQuery directly, the answer is always based on fresh data, not a snapshot someone exported last week.
Slack notifications for sales teams
When someone signs up or hits a certain usage pattern, they get qualified as a prospect worth contacting. But a lead list is only useful if it’s up-to-date. If the spreadsheet the notification links to was last refreshed hours ago, the salesperson clicking through can’t be sure whether that lead is still uncontacted.
The bottleneck: The sales team needed to know, in real time, which qualified leads hadn’t been contacted yet, and be looking at an up-to-date list the moment they clicked through.
The fix:
- A query runs in BigQuery to pull the list of leads that are already qualified but haven’t been contacted yet (internally called “rotting”)
- At the same moment, a Slack notification goes out to the sales team
- Coupler.io pushes the refreshed list to a spreadsheet
The output: A Slack notification with a link to a live, up-to-date list, not a snapshot from earlier in the day.

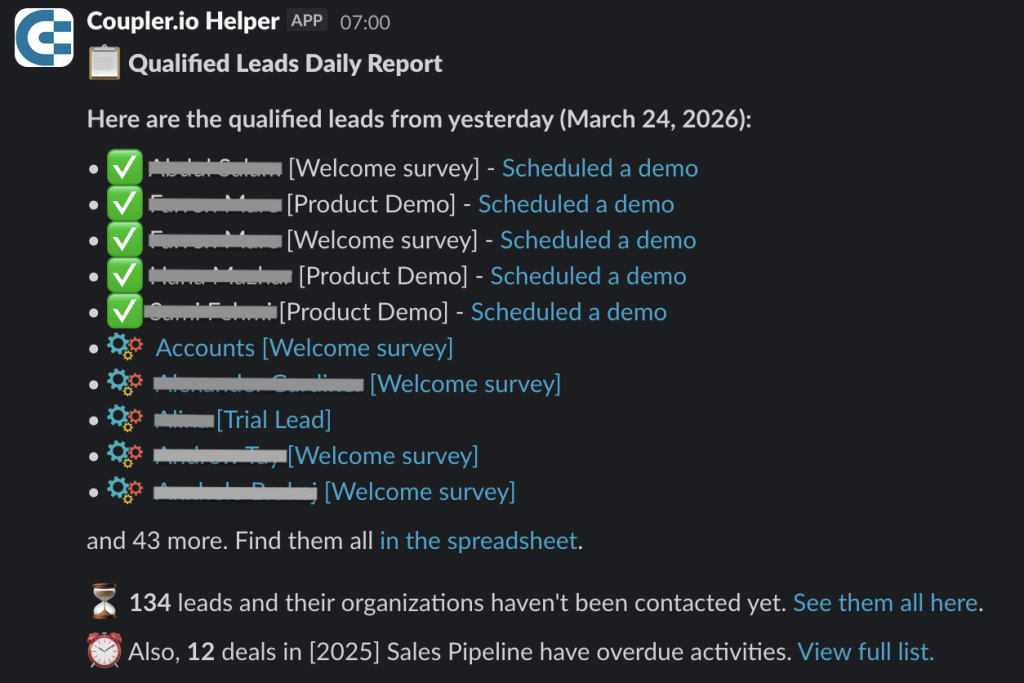
The payoff: When a salesperson clicks through, they’re looking at exactly the data that triggered the alert. No lag, no stale rows.
The moment the script sends this notification, the list is refreshed as well. So it kind of supports what’s linked in the notification.
What one source of truth changed across the whole team
A data stack only works as a single source of truth if everyone on the team actually trusts it. That trust is based on the confidence that the numbers you’re looking at are the same numbers everyone else sees.
Here is what that looks like in practice for us:
- No more “which version is correct?” Every report, dashboard, and automation pulls from BigQuery. There is no spreadsheet someone maintains on the side, no direct export someone forgot to update.
- Non-technical teams stay unblocked. The content team filters their own reports. The marketing team updates the competitor list. The HR team cleans survey data. Nobody files a ticket to change a column name.
- Automations run on data they can trust. Sales notifications fire on leads that were qualified an hour ago, not yesterday. The link in the Slack message always points to a list that was refreshed at the exact same moment.
- History doesn’t disappear. Search Console deletes data after a certain point. We lost some history before we realized that. Now everything goes into BigQuery as it comes in, so the data is there when someone needs it.
The combination of BigQuery and Coupler.io did not require us to become a bigger data team. It just removed the parts that used to slow everyone else down.
Got any questions about how we’ve built this?


Need a walkthrough demo, expert guidance from a data analyst, or real-time support?
Get a demo