Marketing data often ends up scattered across ad platforms, web analytics tools, CRMs, SEO platforms, and ecommerce systems that all measure performance differently. That makes it hard to trust reporting or answer basic questions like which campaigns drive revenue and which channels influence conversions.
BigQuery gives marketing teams a single warehouse where that data can be unified, compared on equal terms, and analyzed across the full customer journey.
Why use BigQuery for marketing analytics
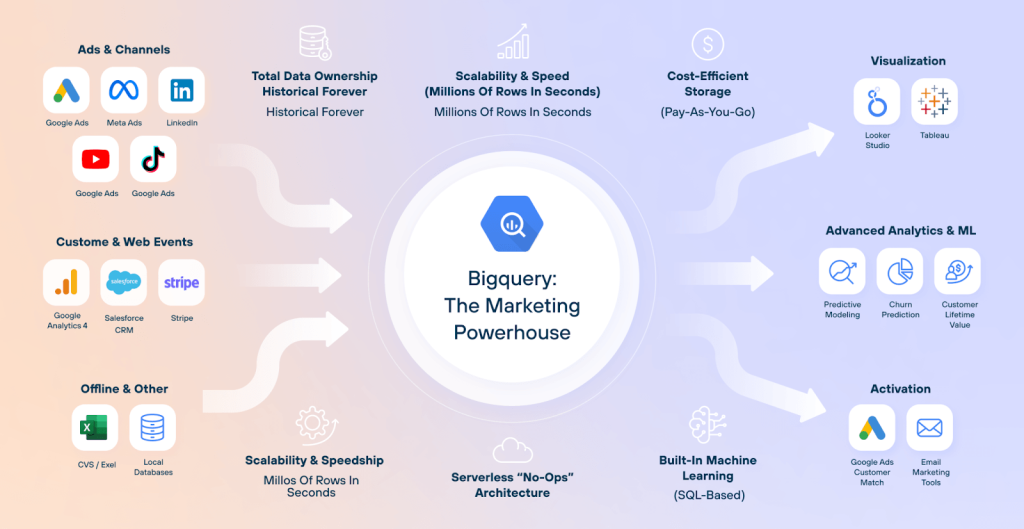
The key use case of Google BigQuery for marketing analytics is to move beyond platform-by-platform reporting. Marketers centralize external data in one warehouse so it can be analyzed together. That typically means consolidating datasets from:
- Paid advertising platforms (Google Ads, Facebook Ads, TikTok Ads, LinkedIn Ads)
- Web analytics platforms like Google Analytics 4
- SEO data from Google Search Console
- CRM and lifecycle tools such as HubSpot or Salesforce
- Ecommerce platforms like Shopify or Stripe
- Email marketing platforms such as Klaviyo or Mailchimp
Once these datasets live in the same data warehouse, marketers can analyze performance across the entire marketing system rather than channel by channel. BigQuery also connects natively with Looker Studio, which makes it straightforward to turn that centralized data into dashboards and visual reports.
Coupler.io handles the data pipeline side of this workflow. This data integration platform automates data flows from 400+ business apps into BigQuery (and other analytical destinations) without custom code or manual exports.
United Way Northwest Indiana shows what that looks like in practice. Using Coupler.io, the team automated data flows from siloed marketing and CRM apps, cut reporting labor by roughly 80 hours a month, and saved about $20,000 annually.
Consistency over time matters too. Many teams combine data using manual exports or spreadsheets. That works for quick analysis, but it becomes fragile as the number of data sources grows. Spreadsheet workflows depend on manual updates, inconsistent naming, and repeated transformations, all of which make long-term reporting difficult to maintain.
A warehouse approach solves this by creating stable datasets that update automatically. This allows dashboards and reports to rely on the same underlying data definitions.

Automate data flows to and out of BigQuery with Coupler.io
Get started for freeWhat changes once marketing data is in BigQuery
Moving digital marketing data into a warehouse changes what teams can realistically analyze.
1. Cross-platform comparison becomes possible
Each marketing platform measures performance using its own attribution logic.
Ad platforms allow different attribution windows for counting conversions. Some measure conversions based on clicks within a certain time period, while others include view-through conversions.
Because these rules differ, metrics like CPA or ROAS can appear inconsistent when viewed across platforms.
When marketing data is centralized in BigQuery, teams can standardize attribution definitions and metric calculations. This allows performance comparisons to be made on consistent definitions rather than platform-specific reporting rules.
2. Long-term marketing history stays intact
Many marketing platforms limit how long detailed data remains accessible.
Event-level analytics data may be retained only for a limited period unless exported (14 months for Google Analytics). That makes long-term trend analysis difficult when relying solely on platform dashboards.
With BigQuery for marketing analytics, organizations maintain their own historical data of marketing activity. This makes it possible to analyze multi-year trends:
- Seasonality patterns
- Cohort performance
- Lifecycle behavior
- Long-term campaign effectiveness
The warehouse becomes the system of record for marketing data, rather than individual platforms.
3. The marketing funnel can be modeled end-to-end
When data stays inside platform silos, reporting is naturally organized around individual channels.
Advertising platforms show ad performance, analytics tools show website activity, while CRM systems show customer records.
The customer journey spans all of these systems.
With marketing data stored in BigQuery, teams can connect these datasets and analyze the full funnel:
Ad interaction → website session → lead generation → purchase → retention.
This allows marketers to move beyond channel performance and understand how different marketing activities contribute to the overall customer lifecycle.
The common workflow to analyze marketing data in BigQuery
Once marketing teams decide to centralize their data in BigQuery, the next challenge is to build a workflow that keeps the system reliable over time.
Most successful marketing analytics setups follow the same basic pattern:
- Define the analytical questions first
- Load marketing data into the warehouse automatically
- Organize datasets so metrics remain stable
- Connect reporting tools for dashboards and exploration
Skipping or rushing any of these steps usually leads to fragile reporting systems that require constant manual fixes.
Step 1. Decide what questions you’re answering
Before importing large amounts of data into BigQuery, teams need to clarify what they actually want to measure.
This step is often overlooked because warehouses make it technically easy to load everything. Without clear analytical goals, datasets grow quickly while insights remain limited.
Typical marketing questions that drive warehouse analytics include:
- How does ROAS compare across ad platforms once attribution rules are standardized?
- Which campaigns drive the highest lifetime value customers, not just initial purchases?
- Where do users drop out of the funnel between ad click, site visit, and conversion?
- Which content pages contribute to conversions later in the customer journey?
- Which acquisition channels generate repeat buyers?
Defining questions like these early helps determine which datasets are necessary and how they should be structured.
It also prevents a common warehouse problem: collecting large amounts of marketing data that no one actually uses.
Step 2. Connect marketing tools to BigQuery and automate data load
Some sources offer native exports. For example, GA4 can export raw event data directly to BigQuery, and Google Search Console supports ongoing bulk export for search performance data.
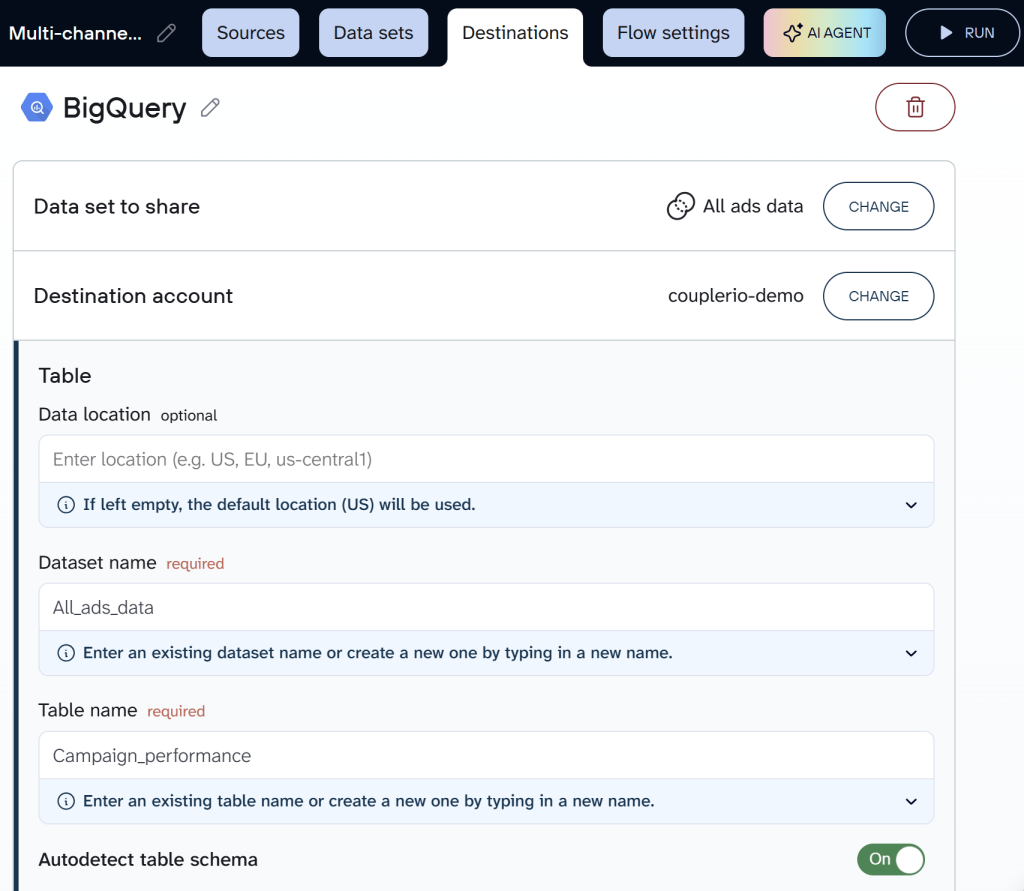
For these and other marketing tools (ad platforms, CRMs, ecommerce systems, email platforms), Coupler.io provides a straightforward way to load data into BigQuery. The workflow takes a few steps and a couple of minutes:
- Create a data flow with the connected sources
- Choose the BigQuery dataset and table to load data (with auto or custom schema)
- Schedule automatic data refresh.
As a result, you use one connector for over 400 business applications. You do not mess with creating custom pipelines using APIs. In addition to BigQuery, you also get spreadsheets, dashboards, and AI tools as alternative destinations for your data. So, the same data flow can feed your dashboards and automatically refresh data in BQ.
Explore all the ways of how to import data into BigQuery.
Coupler.io turns BigQuery from a data storage destination into a working analytics system by keeping data up to date without manual effort.
Xray.Tech saw this firsthand. Before automating their data pipeline, the team spent nearly an hour per client on billing prep because they were pulling data manually from calendars and Airtable.
After connecting those sources to BigQuery through Coupler.io, they reduced processing time to 10 minutes. More importantly, once the data was flowing consistently, the team optimized BigQuery usage to enable broader operational and resource-allocation decisions they couldn’t make before.
Connect 400+ data sources to BigQuery with Coupler.io
Get started for freeStep 3. Organize datasets so reporting stays stable
Loading data into BigQuery is only the beginning. The long-term reliability of marketing analytics depends on how datasets are organized.
A common warehouse structure separates datasets into three logical layers.
- Raw layer. Data imported directly from source systems with minimal changes. Coupler.io loads source data from platforms like HubSpot, GA4, and Google Ads into BigQuery on a schedule, preserving the original structure for reference or reprocessing later.
- Clean layer. Standardized and prepared for analysis. Naming differences are resolved, date fields are aligned, unnecessary columns are removed. Coupler.io supports this step with built-in transformation options: renaming, hiding, reordering, filtering, and sorting columns before the data lands in BigQuery.
- Reporting layer. Analysis-ready tables built for dashboards and recurring reporting. Coupler.io’s append and replace write modes let teams decide whether a table should be fully refreshed or updated incrementally as reporting needs evolve.
Separating these layers prevents dashboards from querying raw tables directly, which helps control query costs and avoids unexpected metric changes when upstream data shifts.
BigQuery also supports table partitioning, which is commonly used for marketing datasets that grow continuously. Partitioning tables by date allows queries to scan only the relevant portions of the dataset, reducing both cost and query time.
Step 4. Visualize data in Looker Studio (and keep Sheets for ad-hoc)
Once datasets are structured properly, reporting tools can connect directly to BigQuery. For most marketing teams, that reporting layer is Looker Studio. Why not Power BI or Tableau? BigQuery provides a native integration with LS, which allows the dashboards to update automatically as new data arrives in the warehouse.
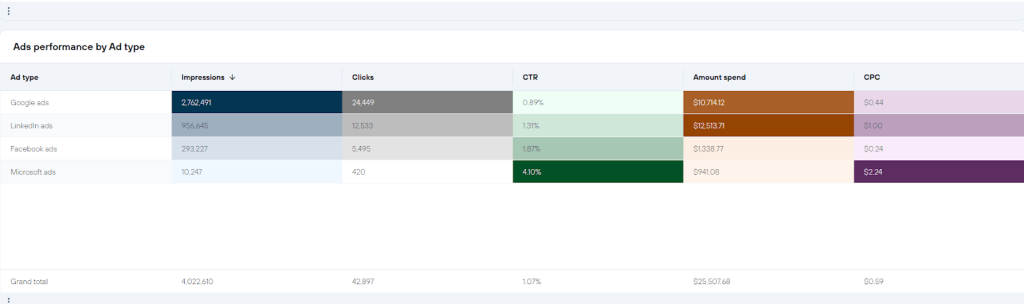
Coupler.io’s PPC multichannel dashboard is a practical example. It brings together ad performance data from Google Ads, LinkedIn Ads, Meta Ads, and TikTok Ads into one view. Spend, clicks, CTR, CPC, and campaign performance sit side by side in a single dashboard rather than across four separate platform reports.
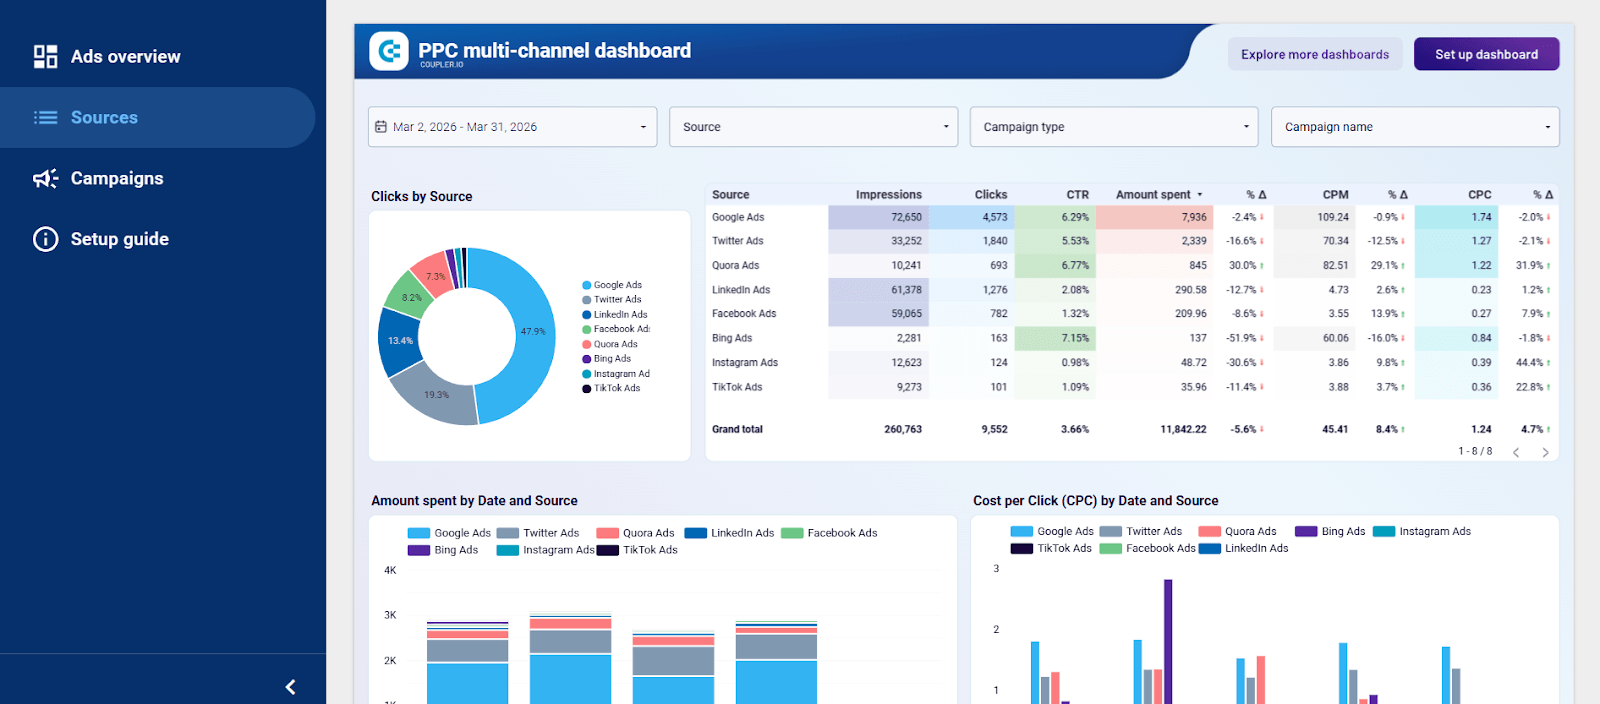
Using BigQuery as the analytical backend offers several advantages:
- Dashboards query stable datasets rather than raw platform APIs
- Complex transformations happen in the warehouse rather than in the visualization layer
- Historical marketing data remains available for long-term analysis
At the same time, dashboards cannot answer every analytical question.
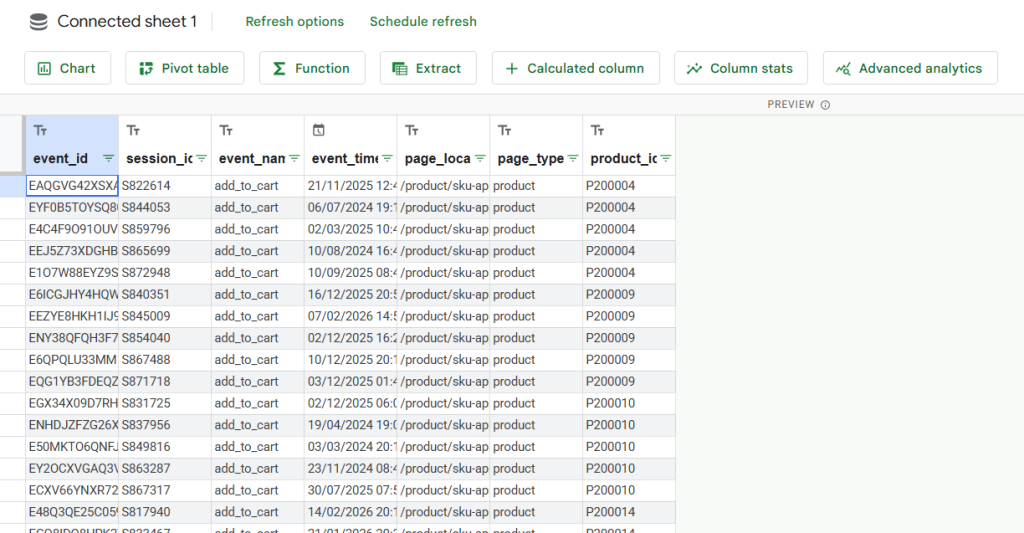
At the same time, dashboards can’t answer every question. Google Sheets still works well for exploratory analysis. BigQuery allows query results to be exported to Sheets. Click “Open in” and select “Connected sheets” to get started.
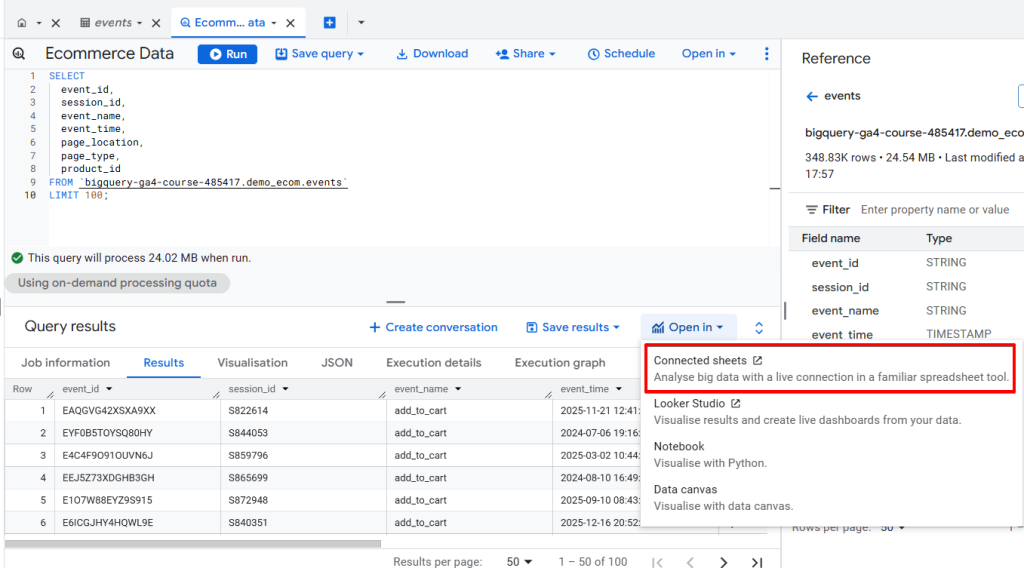
Here’s what the data would look like once it’s exported in Google Sheets:
In practice, the workflow often looks like this:
- BigQuery → Looker Studio for recurring stakeholder dashboards
- BigQuery → Google Sheets for quick analysis and one-off questions
This combination gives marketing teams both structured reporting and flexible exploration without relying on manual BigQuery data export.
BigQuery marketing analytics use cases
Once marketing data is centralized and structured, the value of BigQuery becomes more visible in how teams actually use it.
Most organizations follow a similar pattern: connect multiple data sources, standardize key metrics, and build reporting layers that answer cross-channel questions. The difference is in what they prioritize: paid performance, SEO impact, lifecycle analysis, or full-funnel visibility.
Each of the use cases below relies on the same underlying workflow: connecting sources to BigQuery through Coupler.io on a schedule, organizing the data into stable reporting datasets, and surfacing metrics in Looker Studio or Sheets.
Cross-channel paid ads warehouse
One of the most common ways marketing teams use BigQuery is to build a cross-channel paid advertising warehouse.
Most teams run campaigns across several platforms at once, typically Google Ads, Meta Ads, TikTok Ads, LinkedIn Ads, and sometimes additional programmatic networks. Each platform provides its own reporting interface, but comparing performance across them is rarely straightforward.
The deeper problem is that each platform measures conversions differently:
- Google Ads allows configurable conversion windows.
- Meta commonly reports conversions on a 7-day click attribution window.
- TikTok supports click-through, view-through, and engaged-view attribution.
- LinkedIn uses its own configurable lookback windows.
Because attribution rules vary, the same campaign can appear to perform very differently depending on which platform report you are looking at. Teams often end up debating whose numbers are “correct” rather than focusing on budget decisions.
A cross-channel warehouse solves this by bringing all advertising data into one environment where metrics can be standardized.
A typical architecture looks like this:
Ad platforms → BigQuery → reporting tables → Looker Studio dashboards
Ad performance data is automatically imported into BigQuery. From there, teams create reporting tables that normalize fields such as campaign IDs, cost, conversions, and reporting dates. Once those definitions are standardized, metrics like CPA and ROAS can be calculated consistently across channels.
This allows marketers to use BigQuery for campaign analysis rather than relying on each platform’s native attribution model.
For example, a team could answer questions like:
- Which platform actually produces the lowest CPA when measured using the same attribution rules?
- Which campaigns generate the most revenue per dollar spent across all channels?
Instead of comparing separate platform dashboards, the marketing team can evaluate paid performance across the entire acquisition system and make clearer budget allocation decisions.
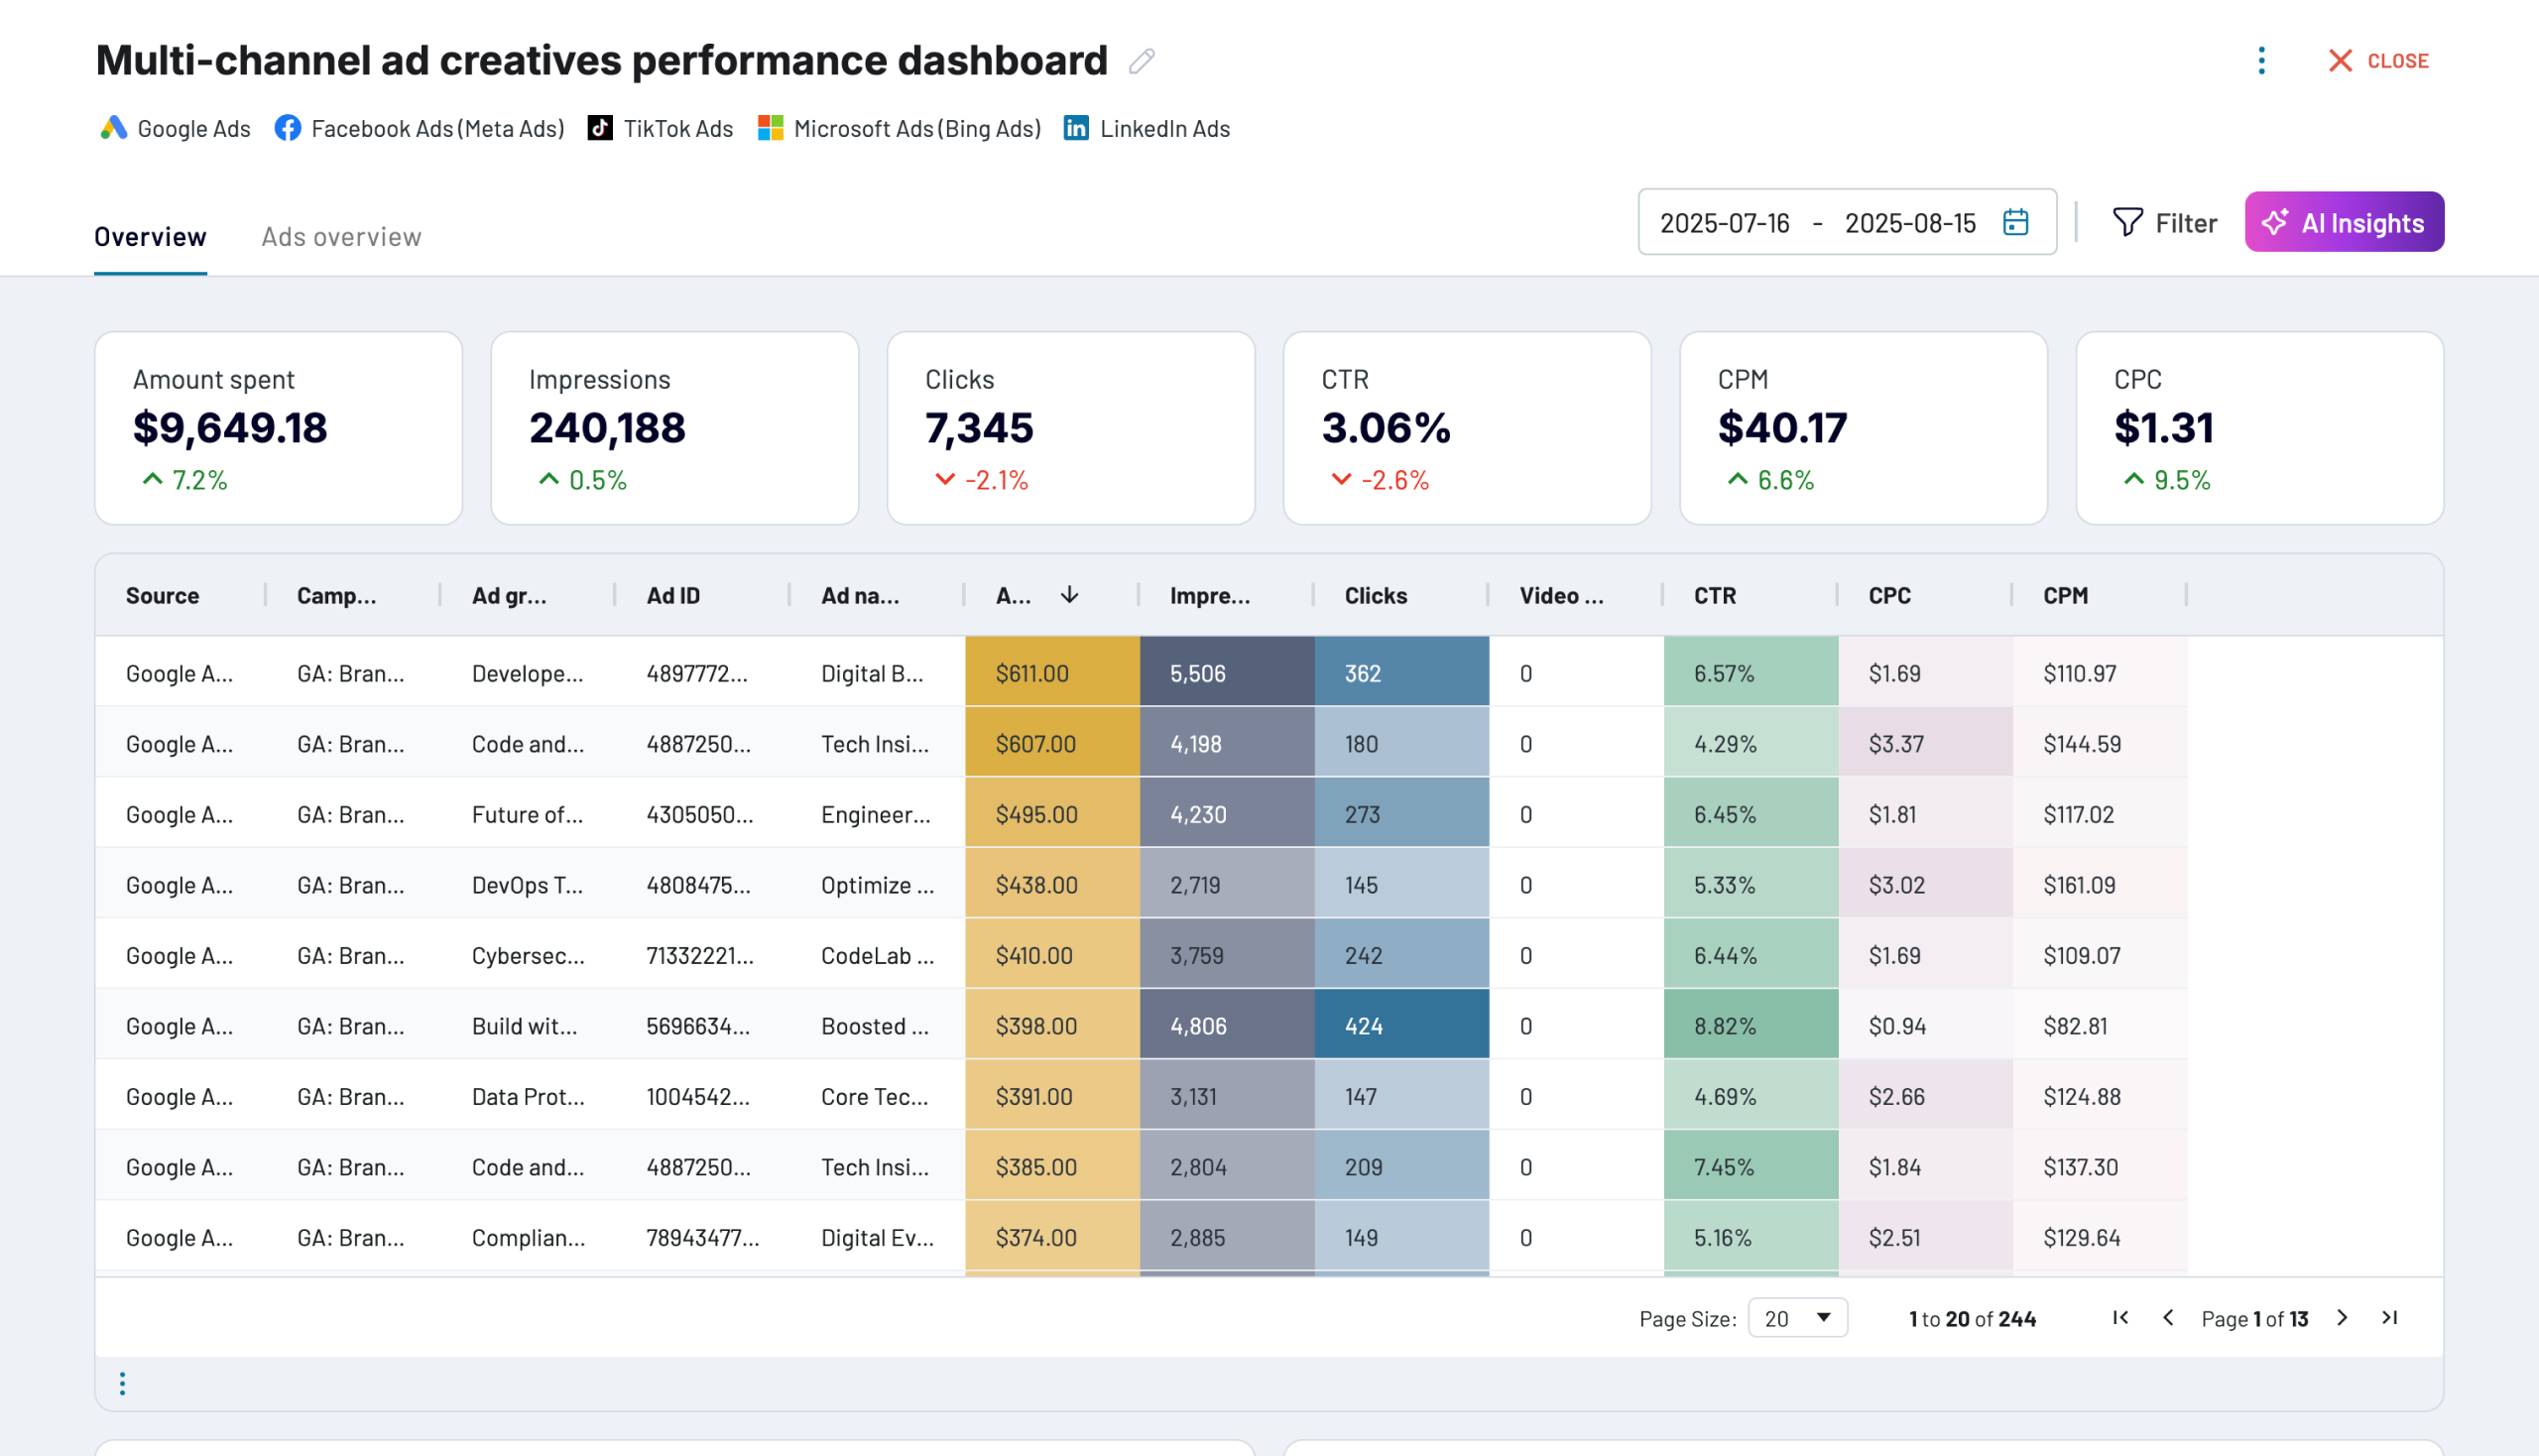
If you want to skip the warehouse setup and get a cross-channel view immediately, Coupler.io’s multi-channel ad creatives dashboard can get you started. It pulls data from multiple ad platforms into a single Looker Studio report, ready to use in minutes. You can replicate the same data flow with BigQuery as the destination if you need deeper analysis later.


SEO and web analytics warehouse
Another common BigQuery setup combines SEO and web analytics data in the same warehouse. In practice, this usually means connecting Google Search Console and Google Analytics datasets.
Each tool answers a different part of the traffic story.
- Search Console shows how pages perform in search results: impressions, clicks, queries, and rankings.
- Google Analytics shows what happens after users arrive on the website: sessions, engagement, conversions, and revenue.
Both tools are useful on their own. They fall short when the goal is to understand how search visibility translates into business outcomes. Search Console cannot show which users convert. Google Analytics does not provide detailed query-level search performance.
Exporting both datasets into BigQuery allows teams to analyze these signals together.
A typical warehouse setup looks like this:
- Search Console export → BigQuery
- GA4 export → BigQuery
- Joined datasets → reporting tables → Looker Studio dashboards
Coupler.io allows you to integrate your data to BigQuery from both the Search Console and GA4. It automates data flows to keep them on a refresh schedule so the joined datasets stay up to date.
Once the data is centralized, marketers can connect search performance data with on-site behavior and conversion metrics. This enables analyses that are difficult to perform inside the native tools. For example:
- Which landing pages gain impressions in search but lose engagement after the click
- Which content topics generate revenue over time, not just search traffic
Another advantage is scale. Search Console exports large volumes of query and page data into BigQuery, which makes it possible to analyze long-tail search patterns over extended time periods.
Teams can perform analyses such as clustering queries by topic, tracking how rankings evolve for groups of pages, or identifying content opportunities based on emerging search demand.
For SEO teams, this warehouse approach moves the focus away from traffic metrics alone. Instead of asking which pages get the most clicks, marketers can evaluate which search visibility actually contributes to conversions and revenue.
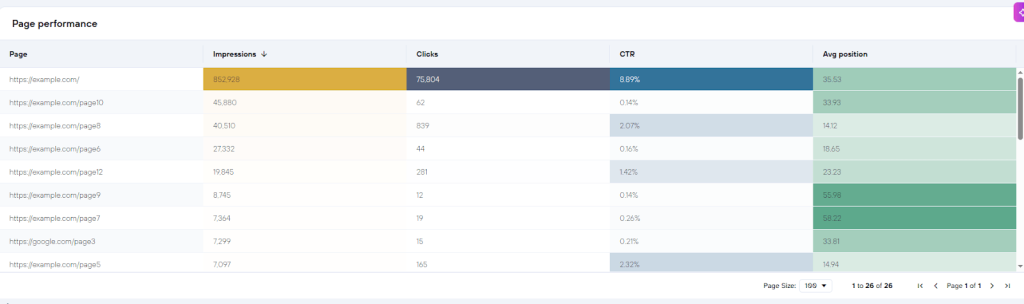
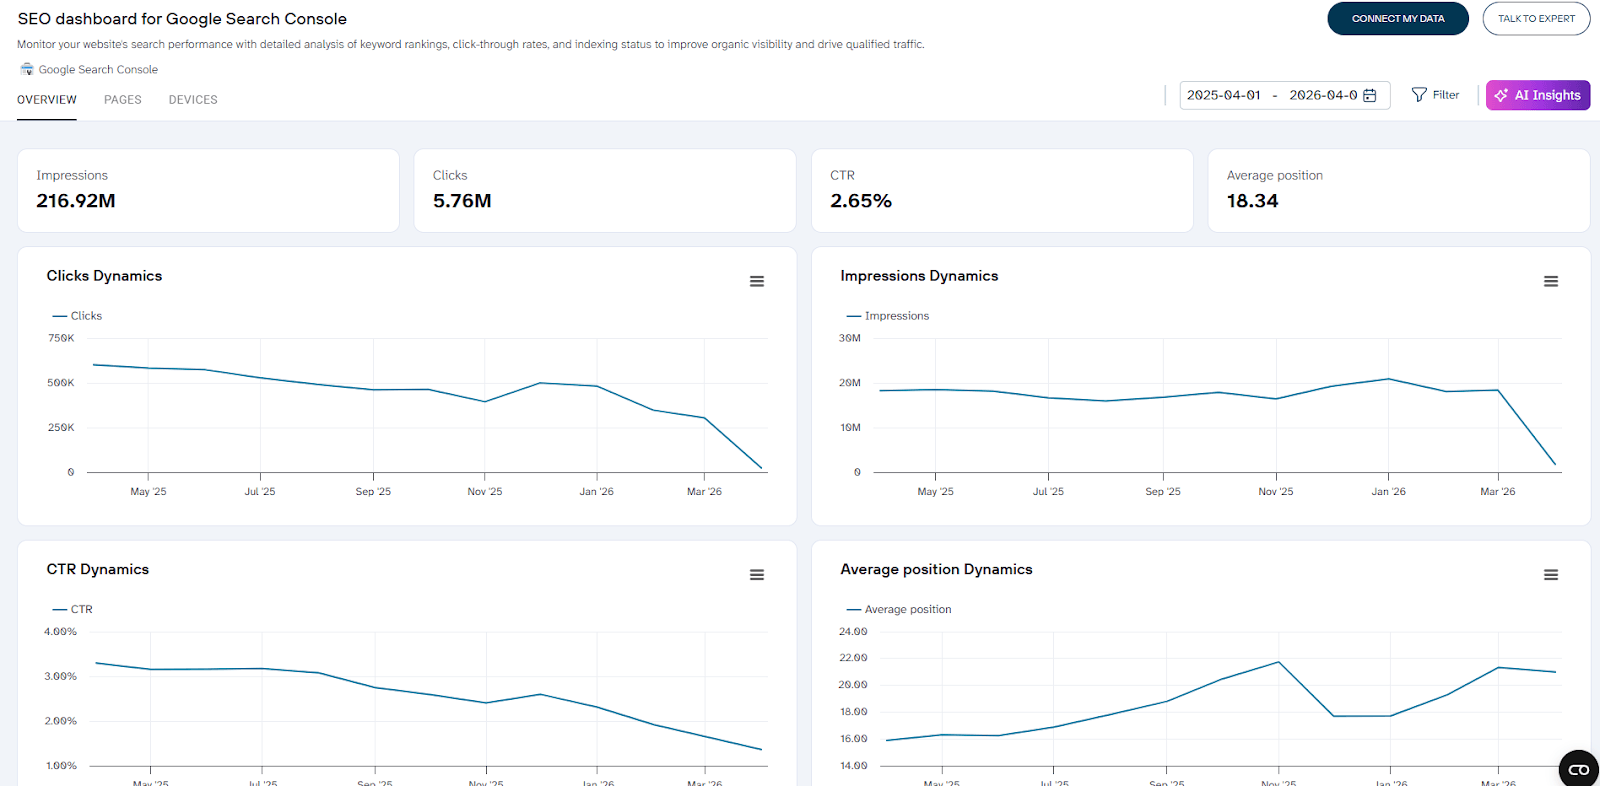
For a quick start, Coupler.io’s SEO dashboard for Google Search Console provides an automated Looker Studio report. It covers the main SEO metrics: best- and worst-performing URLs, CTR analysis, and ranking trends. You can set up the same data flow with BigQuery as the destination for deeper long-term analysis.
SEO dashboard for Google Search Console
 Preview dashboard
SEO dashboard for Google Search Console
Preview dashboardSocial media performance warehouse
Another practical example of BigQuery data analysis for marketing is building a social media performance warehouse that consolidates organic metrics across platforms.
Most social networks provide their own analytics dashboards. Instagram reports post engagement, YouTube tracks watch time and subscribers, and platforms like TikTok and LinkedIn offer separate performance insights.
The challenge appears when teams try to evaluate content performance across platforms.
Questions such as these become difficult to answer using native dashboards:
- Which content formats perform best across social networks?
- Which platforms drive the most website traffic or conversions?
- How does audience growth evolve across channels over time?
A social media warehouse solves this by importing metrics from multiple networks into BigQuery.
Typical datasets might include:
- Instagram Insights
- Facebook Pages data
- YouTube channel analytics
- TikTok public performance metrics
- LinkedIn company page analytics
With the centralized data, teams can standardize fields such as publishing date, impressions, engagement, and link clicks. This allows marketers to evaluate social performance across platforms rather than reviewing each dashboard separately.
You can track engagement trends, publishing patterns, and audience growth over longer periods rather than relying only on short platform reporting windows. BigQuery also makes it easier to compare content performance using one consistent reporting layer.
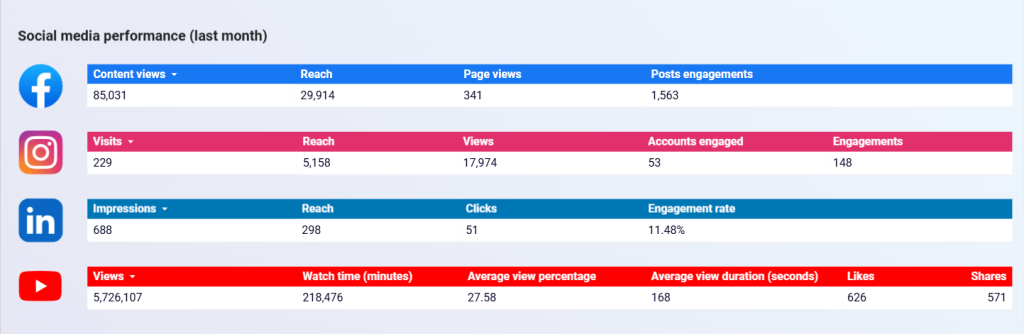
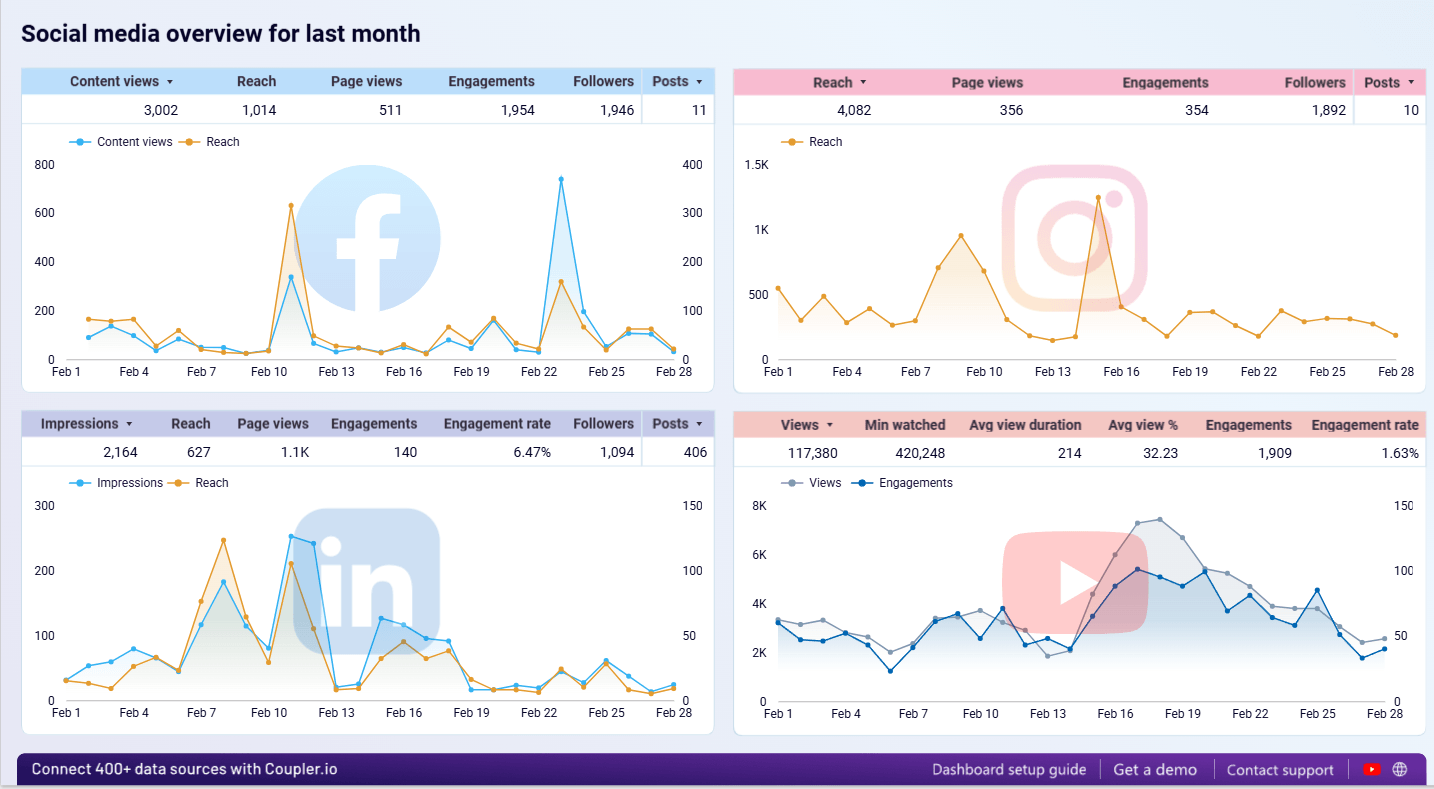
These insights can then be visualized in a social media dashboard. For example, one of our social media performance dashboards can bring together cross-platform metrics such as reach, engagement, page views, and follower growth in one place.
Social media performance dashboards
 Preview dashboard
Social media performance dashboards
Preview dashboardE-commerce marketing stack in BigQuery
E-commerce marketing often spans several systems across the customer journey.
A typical path might look like this:
Ad click → website visit → product interaction → email signup → purchase → repeat order
Each stage is usually tracked by a different platform. Advertising tools capture campaign performance, analytics platforms track user behavior, ecommerce systems record transactions, and email platforms monitor lifecycle engagement.
When these datasets remain separate, it becomes difficult to understand how marketing activities influence revenue across the full funnel.
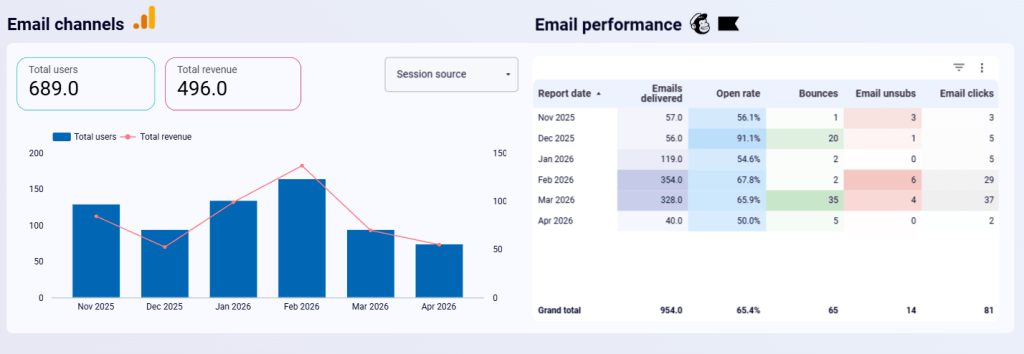
An e-commerce marketing stack built on BigQuery solves this by consolidating campaign, website, and transaction data into a single warehouse. Typical sources include advertising platforms such as Google Ads or Meta Ads, web analytics tools like Google Analytics, ecommerce platforms such as Shopify, email marketing platforms like Klaviyo, and CRM or customer lifecycle systems.
Coupler.io connects all of these sources to BigQuery in a single pipeline, with no custom integrations or scripts for each platform. Once centralized, marketers can track campaigns using BigQuery across multiple stages of the customer journey, rather than evaluating performance only within ad platforms.
That makes it possible to answer questions like:
- Which acquisition channels bring in the most customers?
- How does email engagement influence conversion rates after the first visit?
Because campaign, behavioral, and transaction data are stored in the same environment, BigQuery becomes much more useful for campaign analysis. Instead of judging campaigns only by first-purchase conversions, teams can analyze repeat purchases, retention, and long-term revenue contribution.
We helped one of our clients Tradezella solve a similar problem. The team could track subscriptions and high-level business metrics, but they lacked visibility into user activity between signup and renewal.
They could not distinguish active users from disengaged ones, identify where users were dropping out of the funnel, or tailor communication based on actual behavior. After syncing application data into BigQuery with Coupler.io and organizing it around funnel stages, they generated fresh lifecycle segments and ran more relevant campaigns as a result.
This also applies to ecommerce businesses because ultimately, aside from accurately tracking purchases, you also need to understand which platform your users are converting from to allocate your marketing budget efficiently.
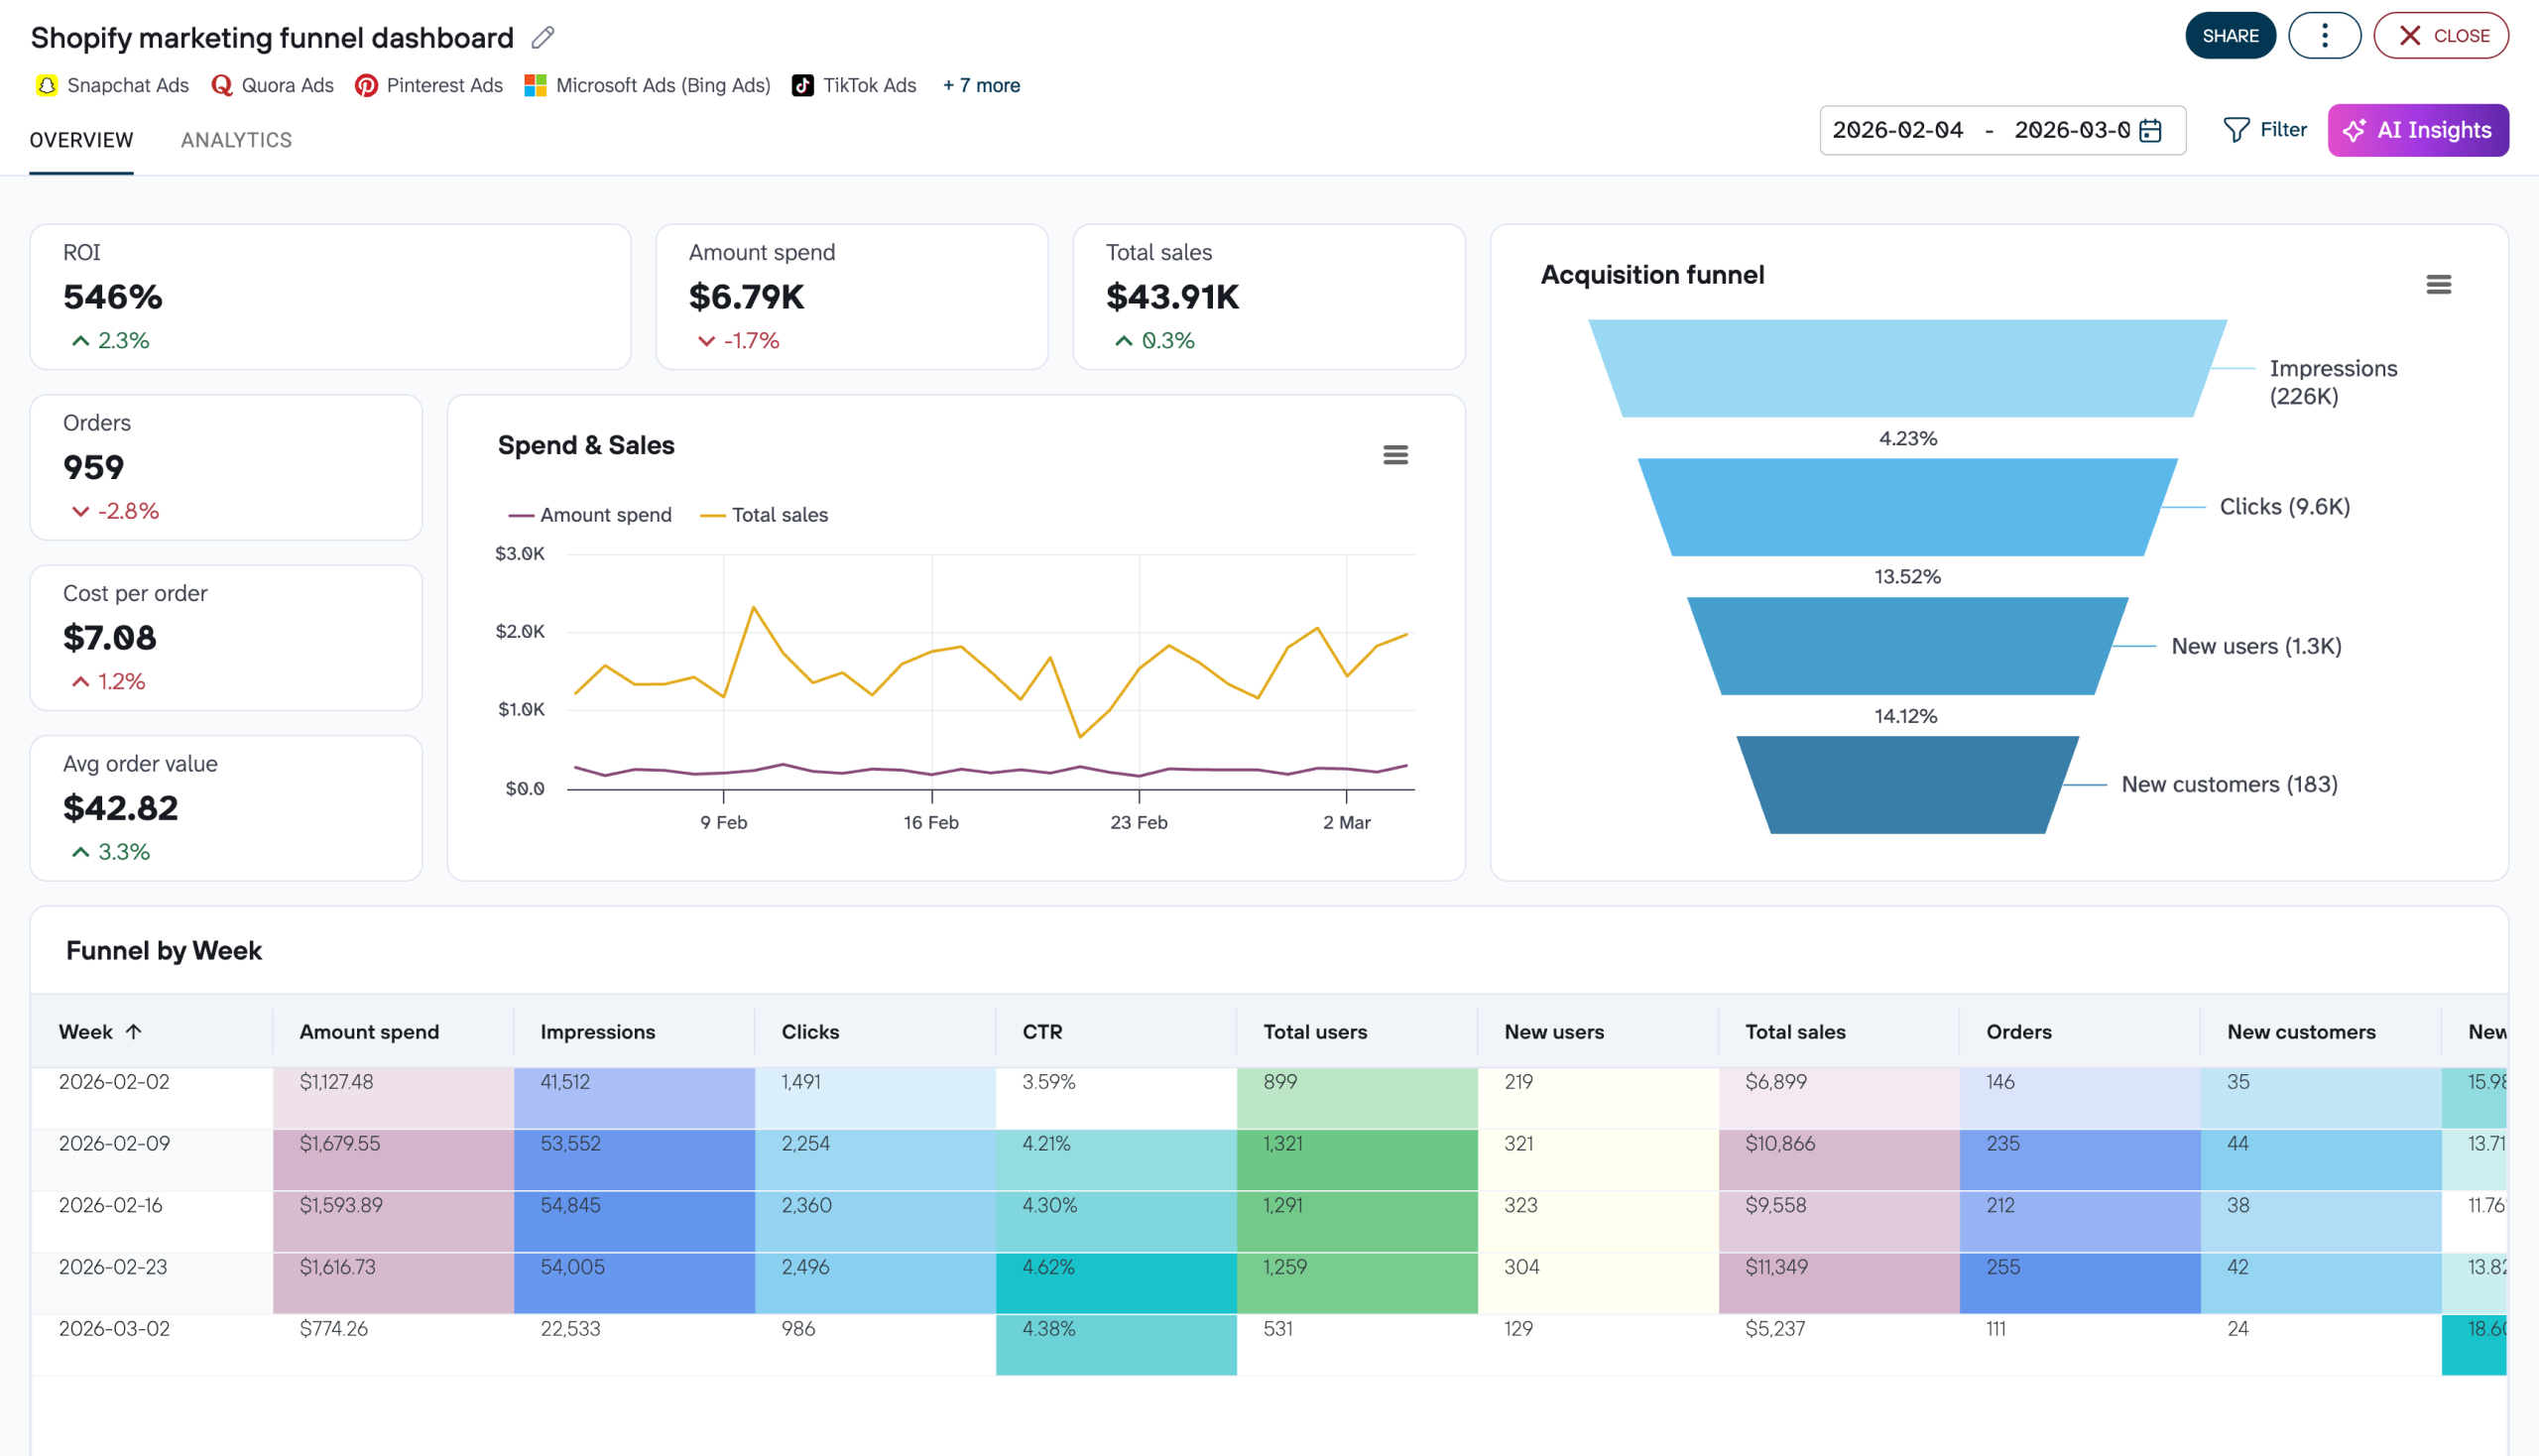
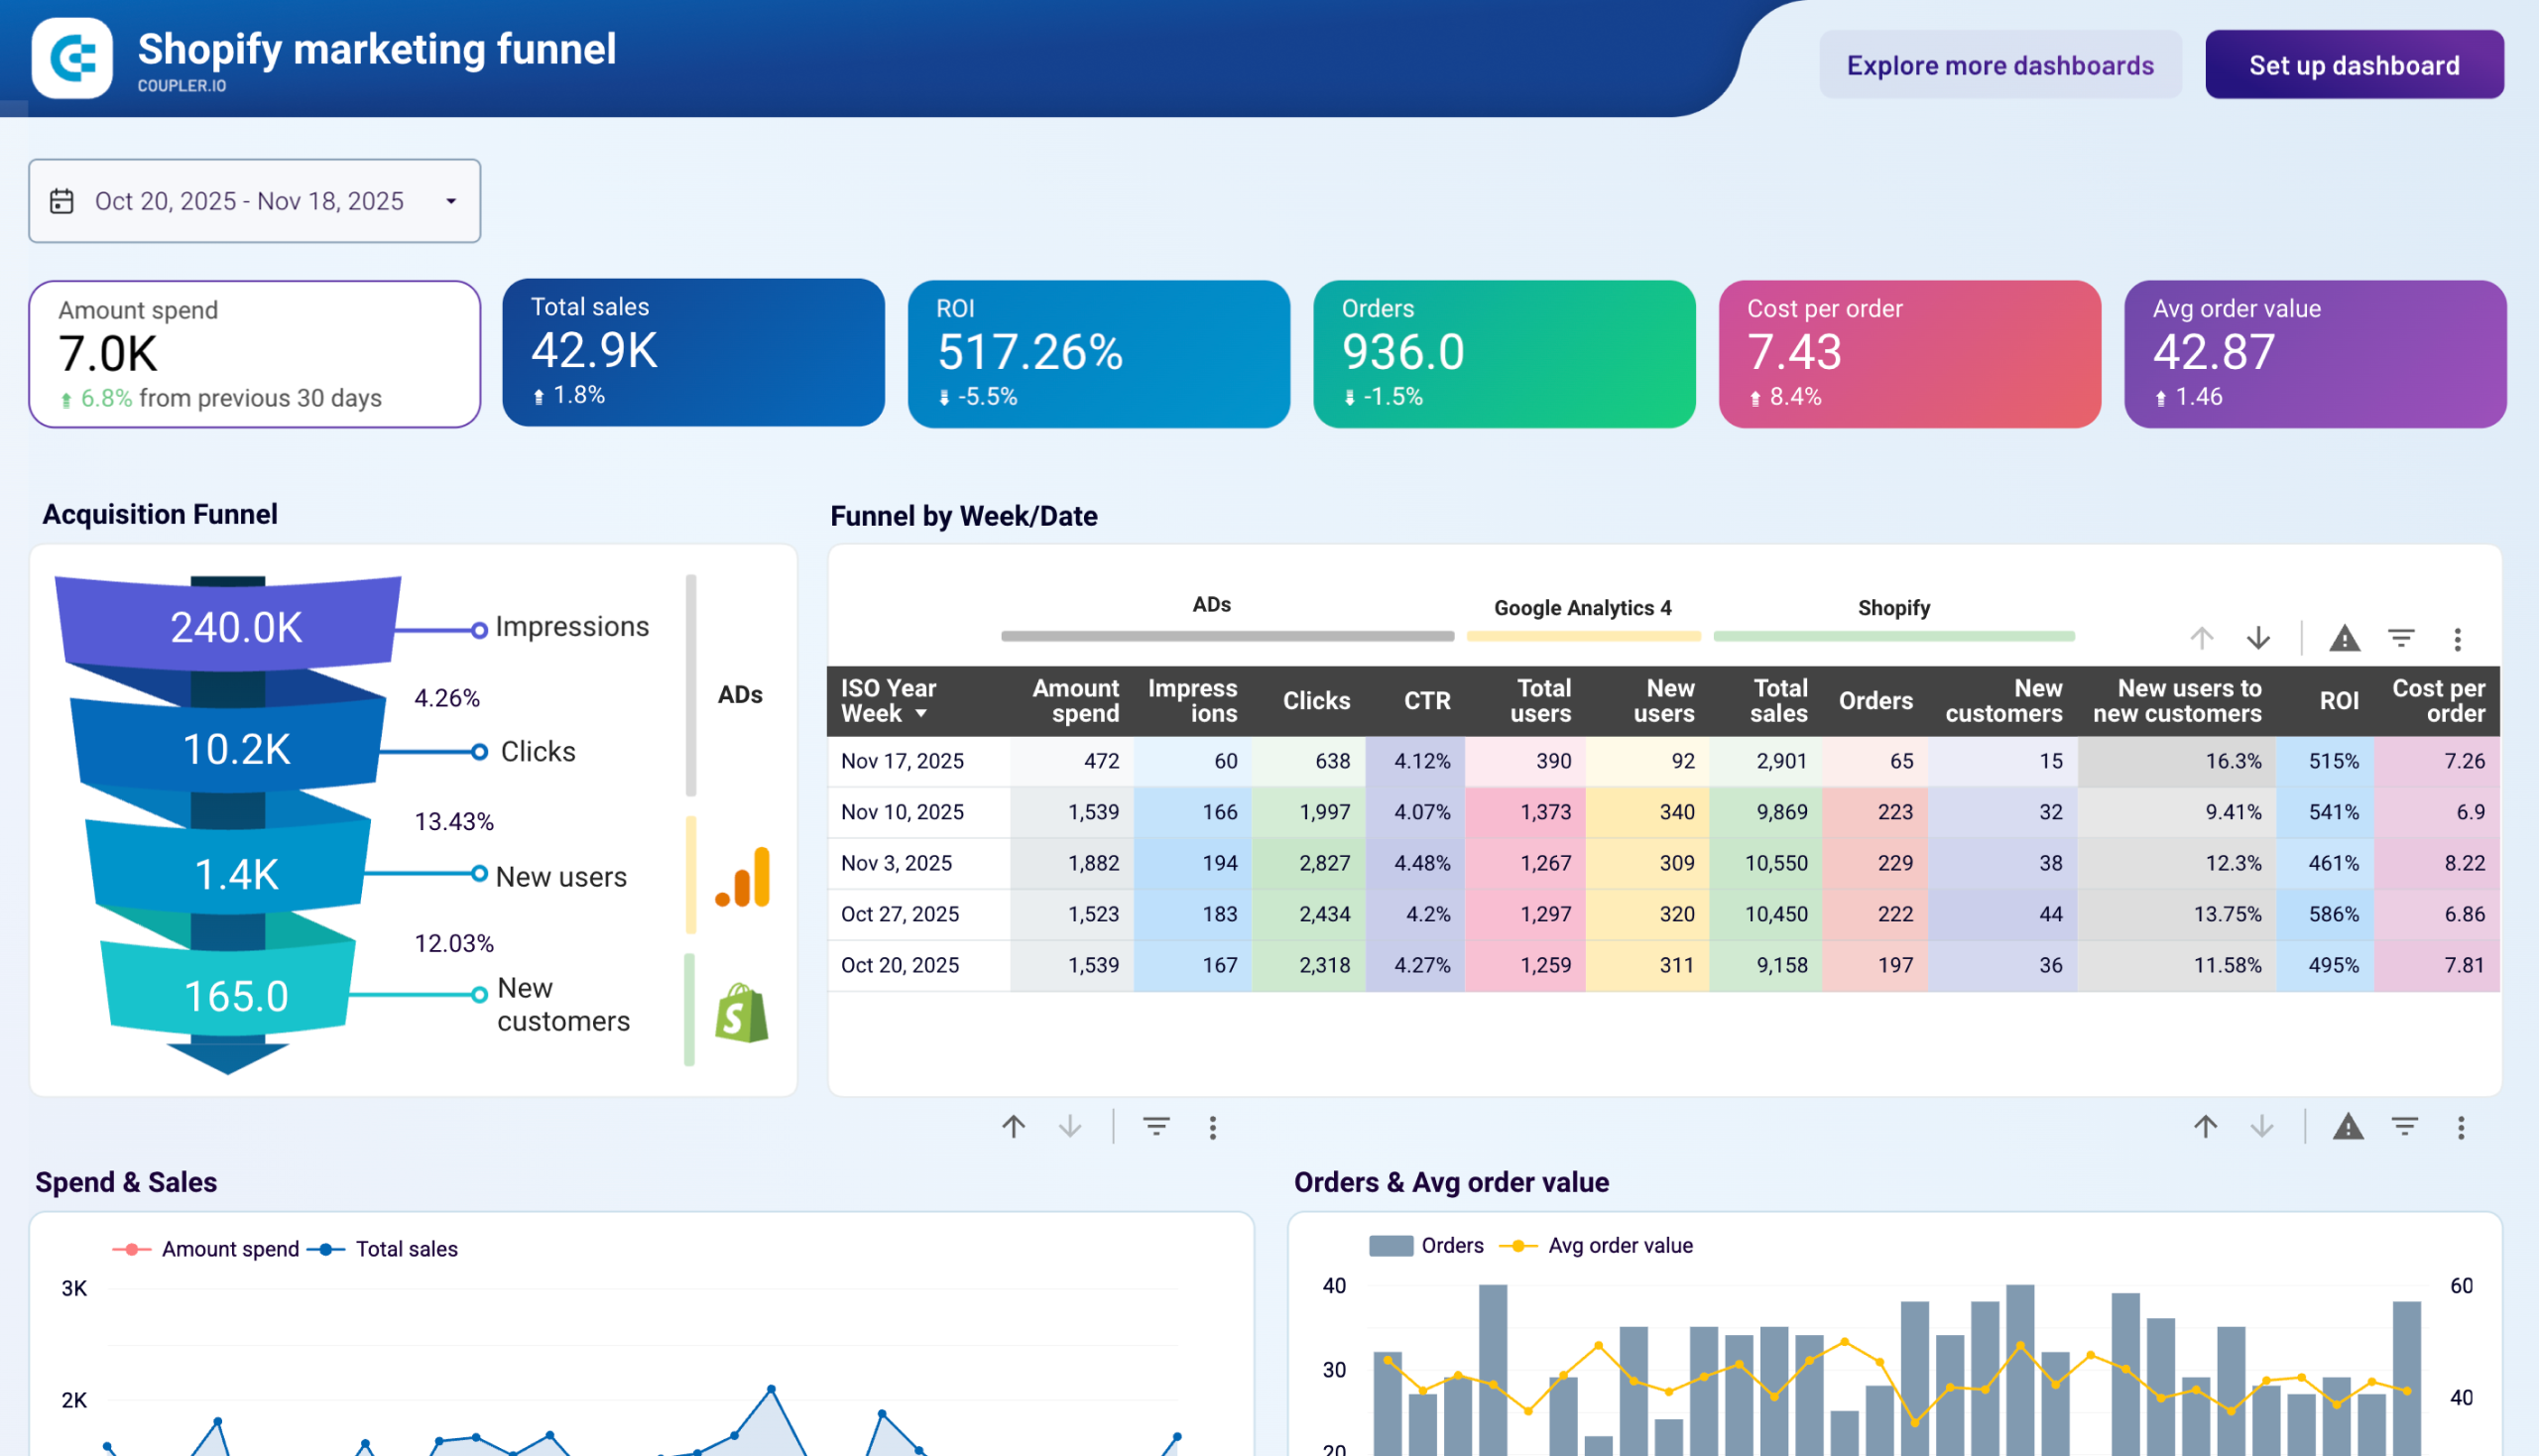
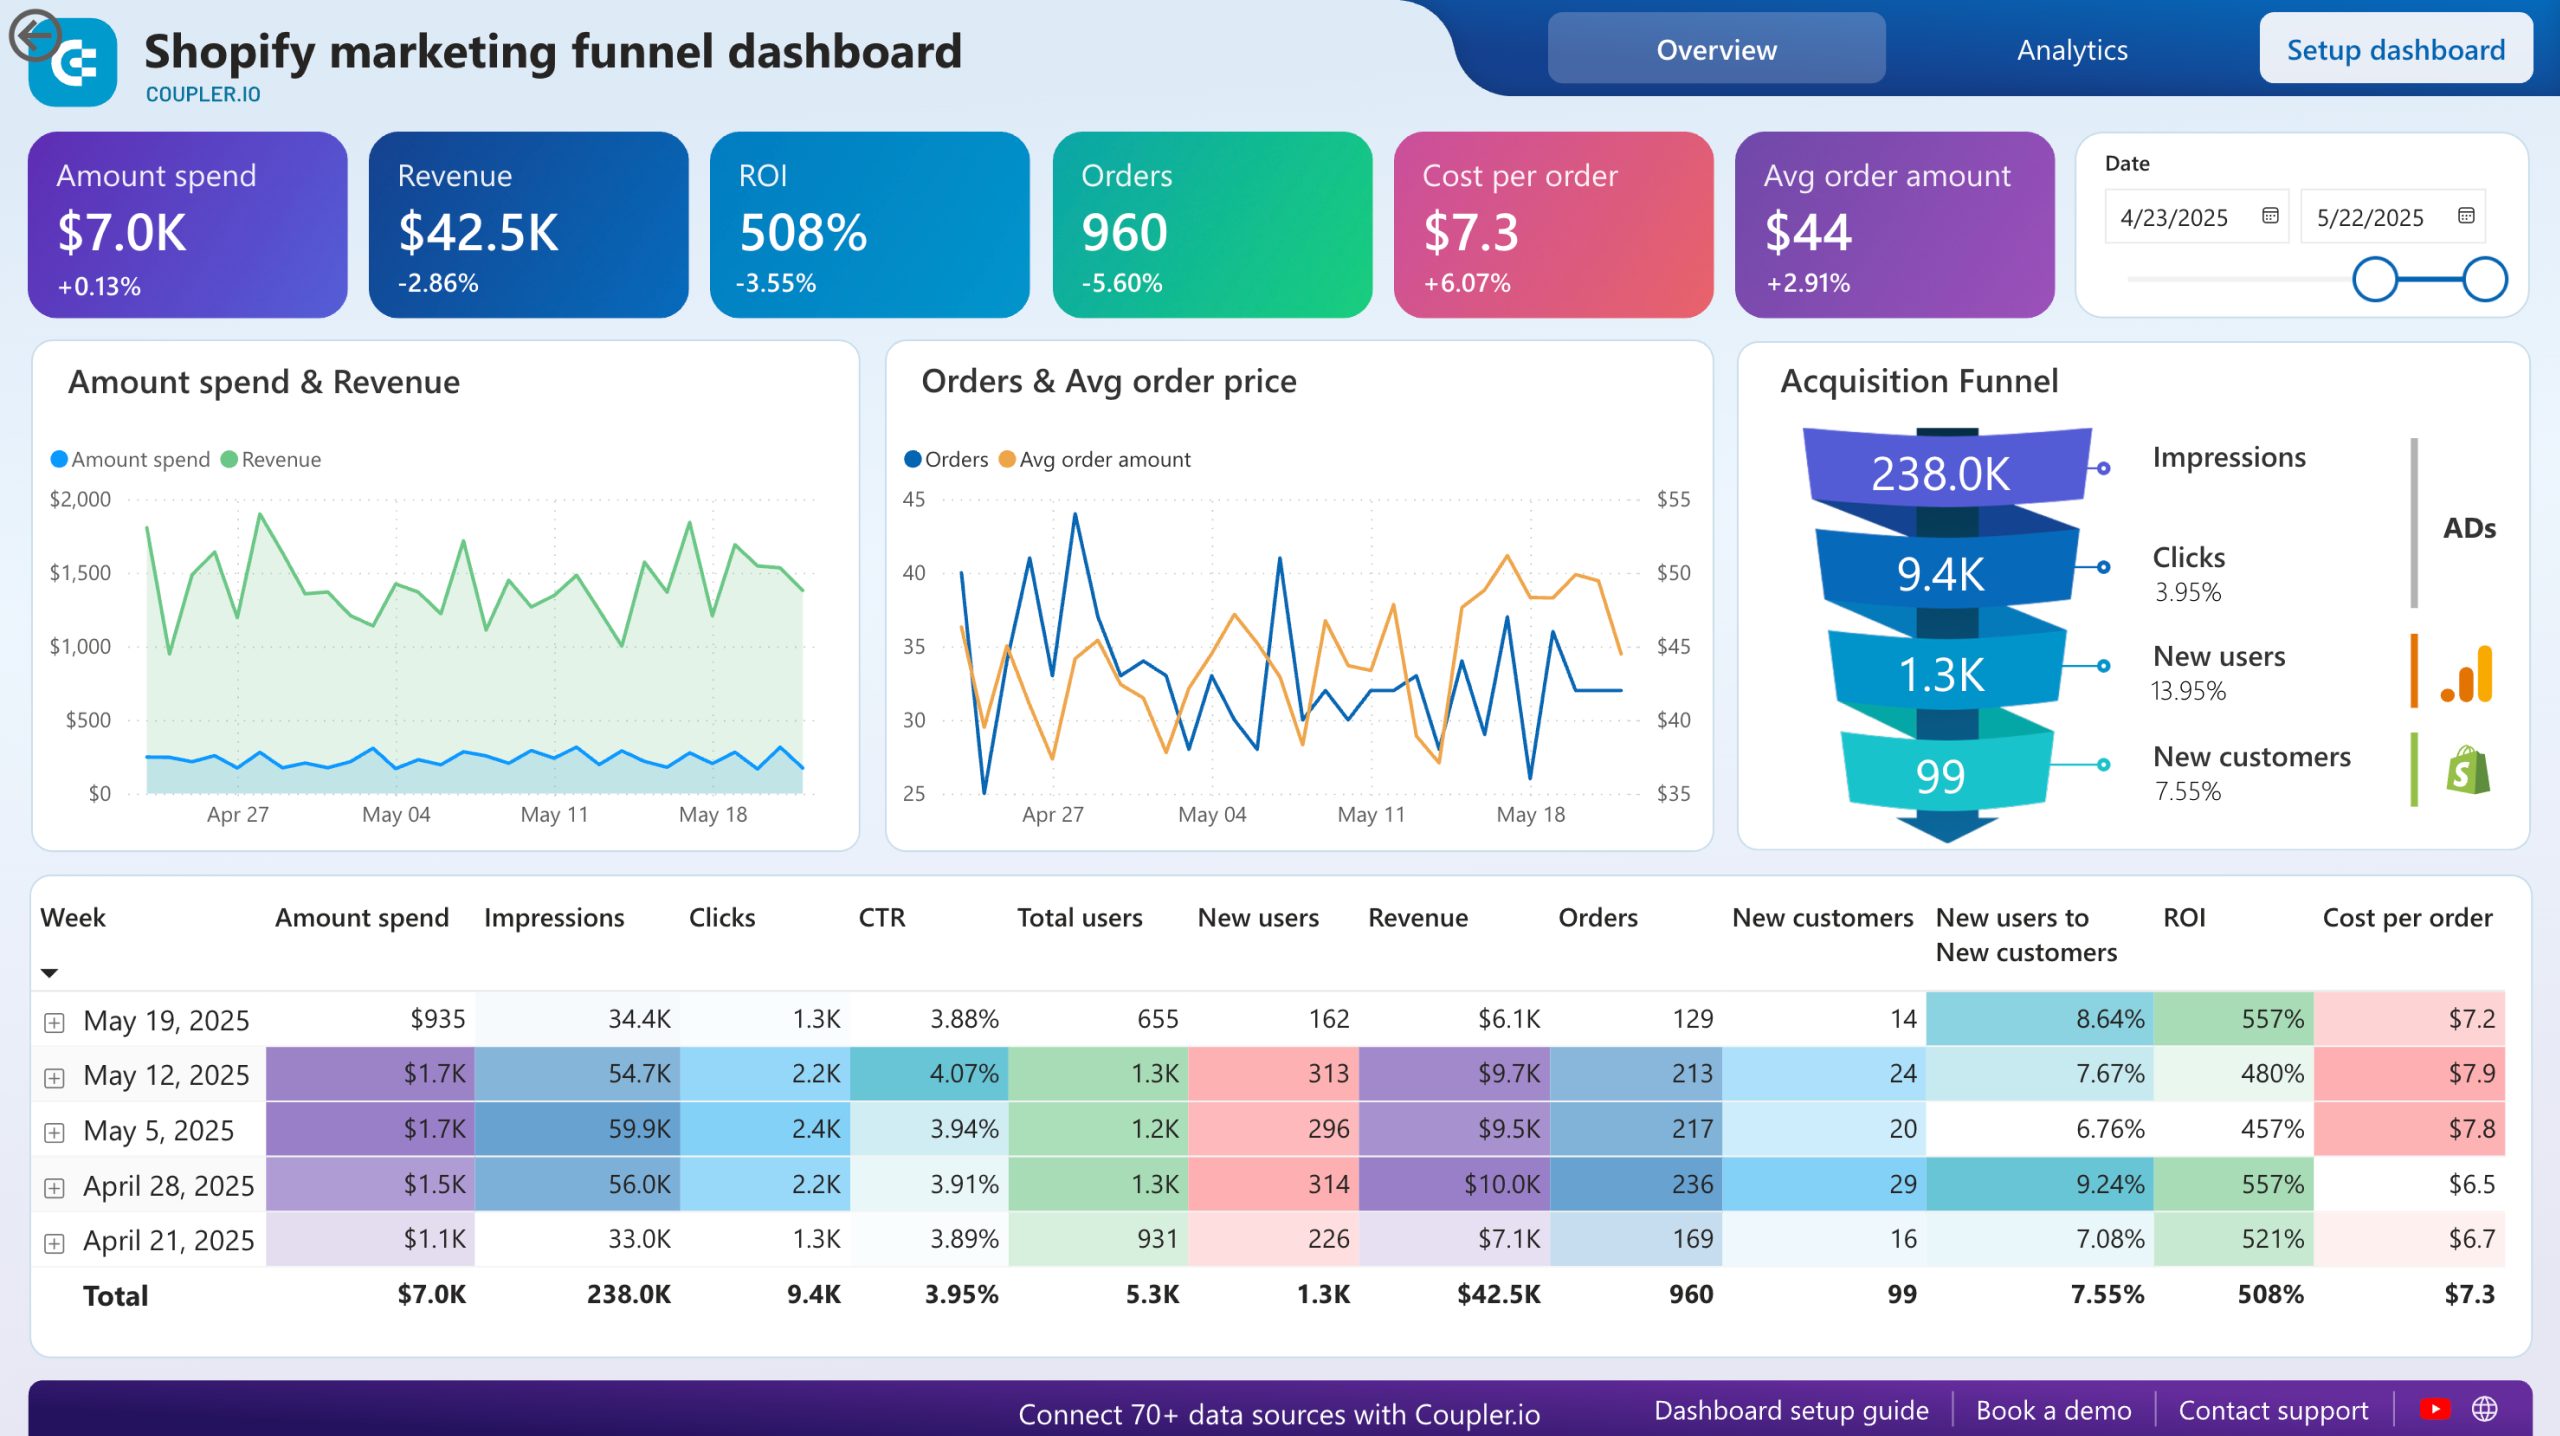
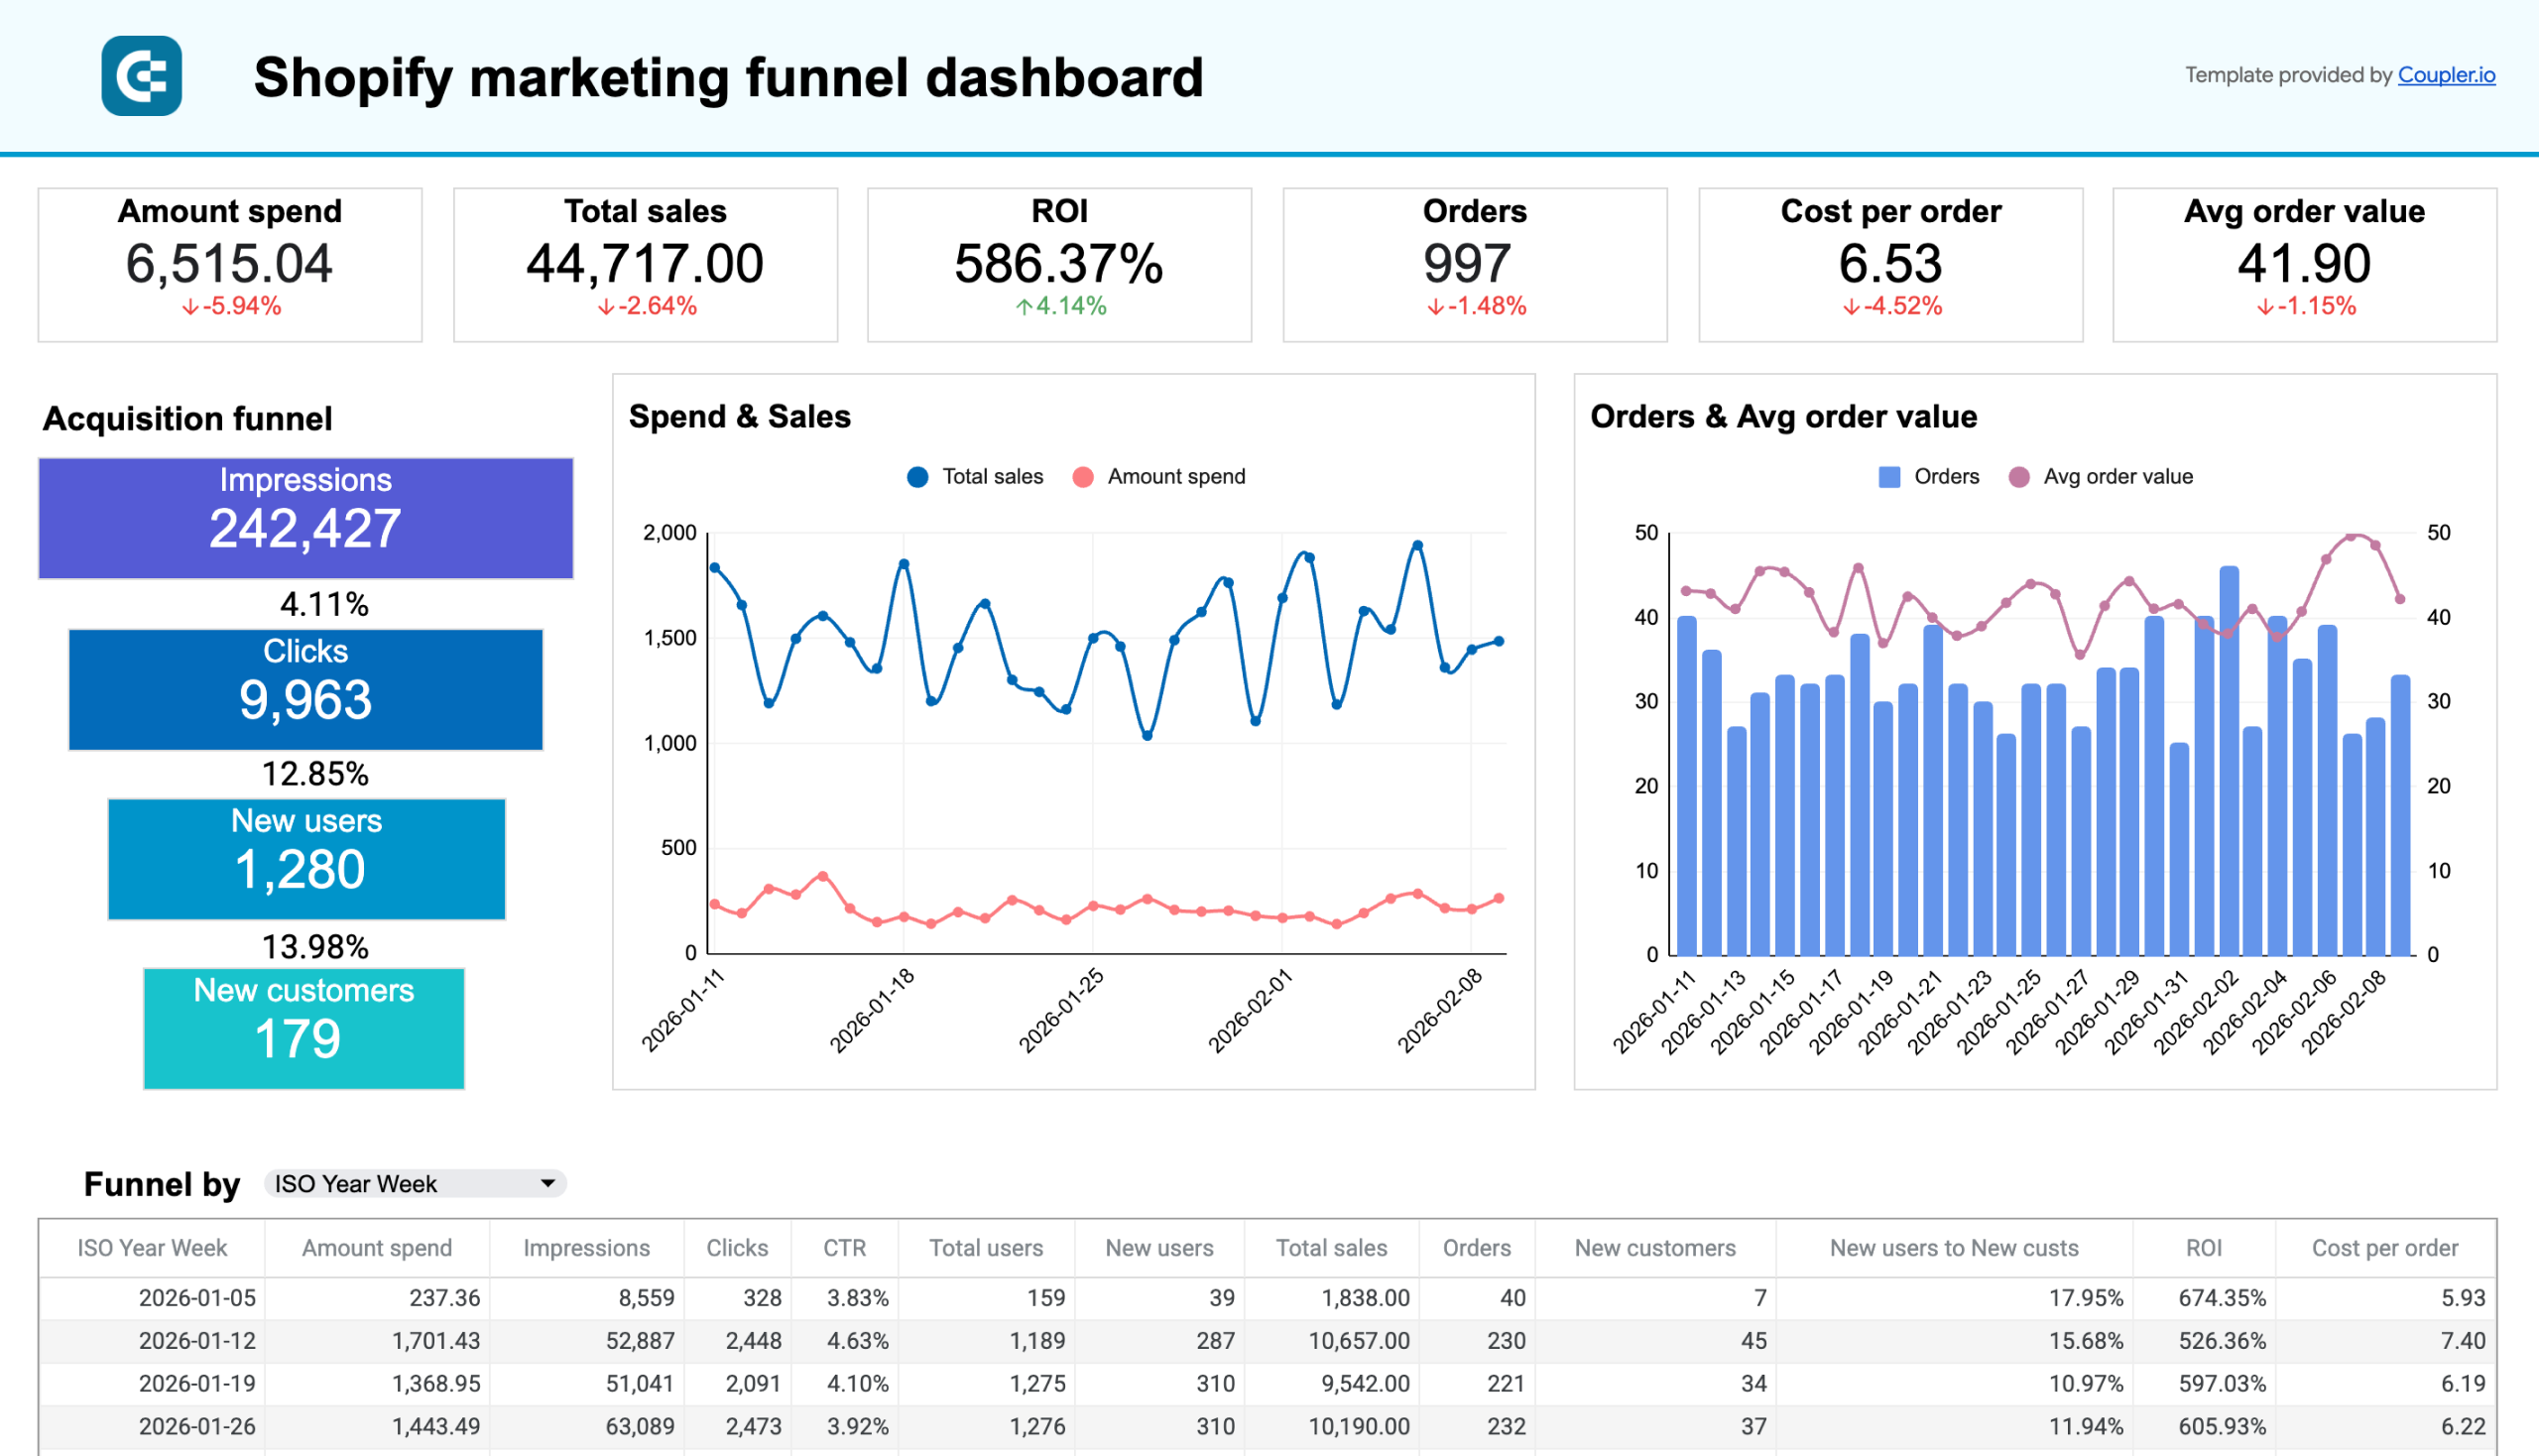
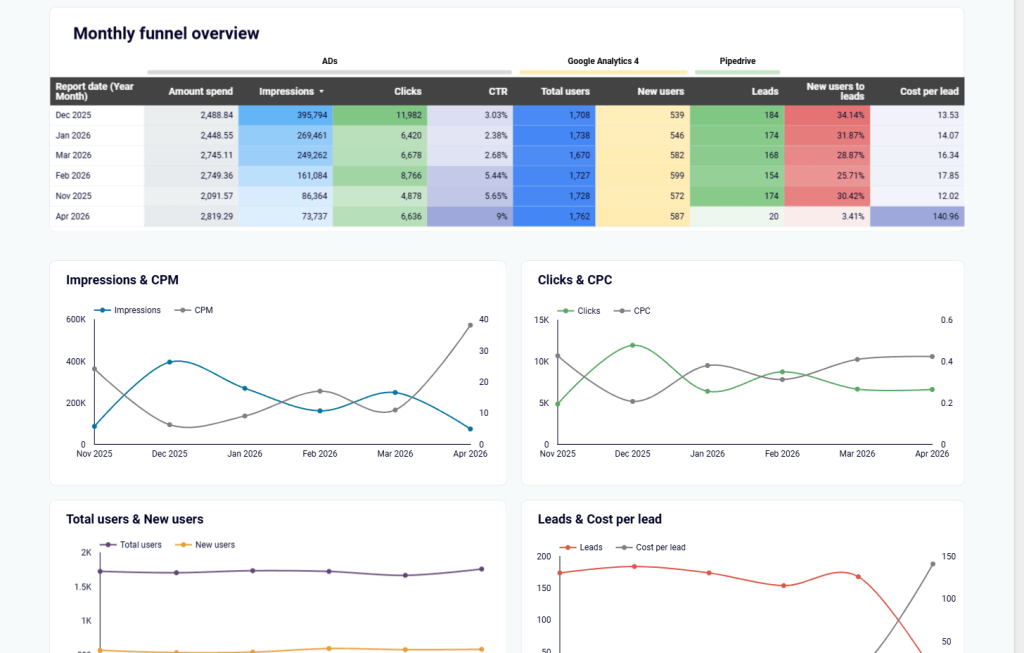
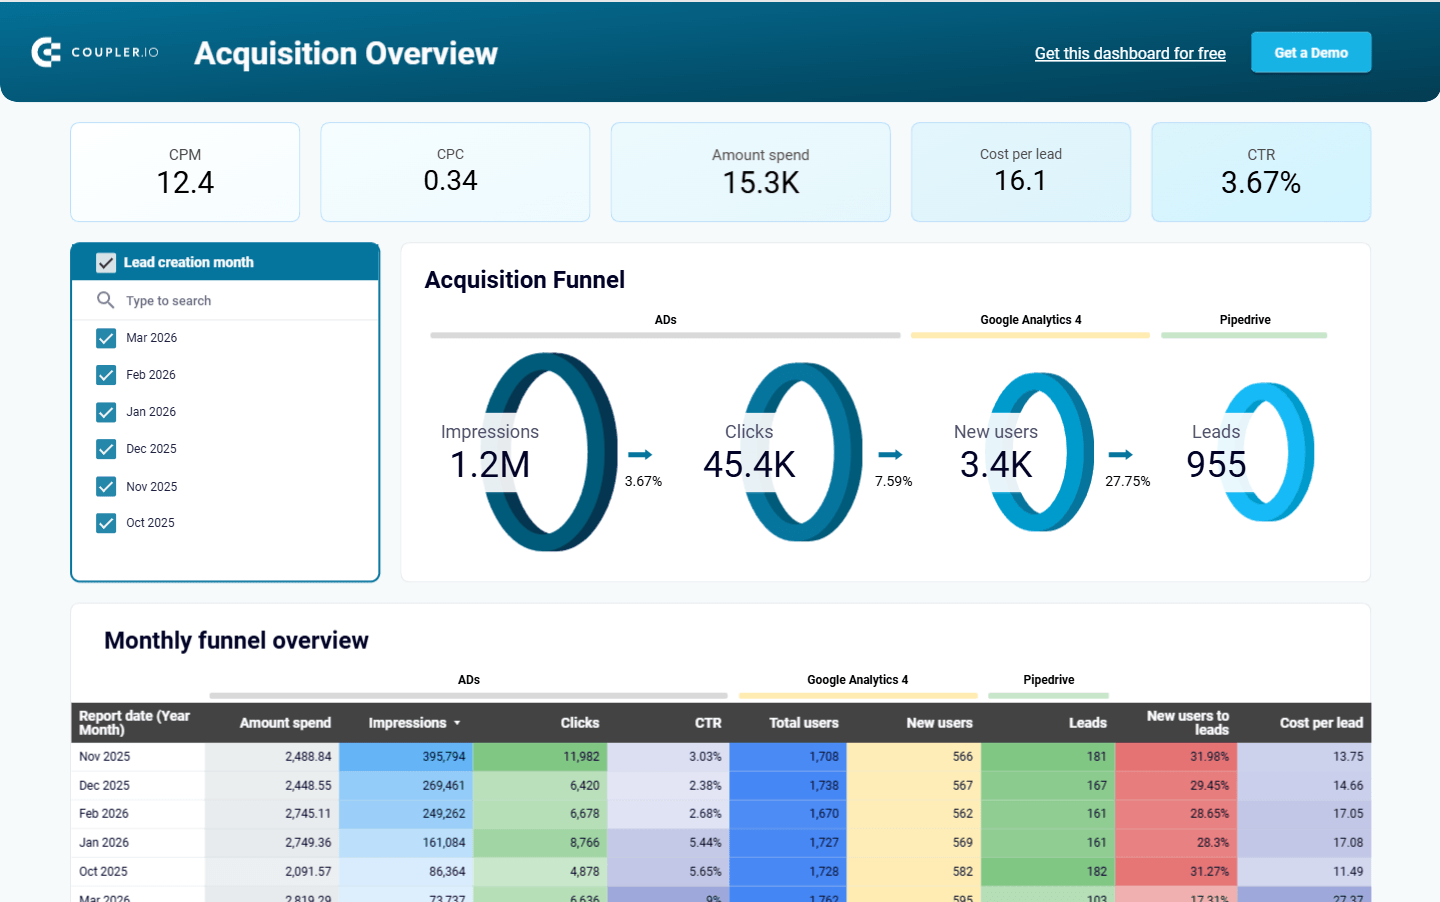
For a quick start on ecommerce analytics, Coupler.io’s Shopify marketing funnel dashboard tracks the full acquisition funnel from ad impressions through website visits to completed orders. You can replicate the same data flow with BigQuery as the destination for deeper analysis.


Full marketing data hub (10+ sources)
As marketing operations mature, many teams move beyond connecting a few datasets and begin building a central marketing data hub in BigQuery.
The goal at this stage is not to analyze one channel or ad campaign type. The warehouse becomes the place where the entire marketing stack is consolidated so teams can analyze marketing data in BigQuery across the full customer journey.
A typical marketing hub might combine data from more than ten systems, including:
- advertising platforms such as Google Ads, Meta Ads, TikTok Ads, and LinkedIn Ads
- web analytics tools like Google Analytics
- SEO performance data from Google Search Console
- organic social media metrics from multiple platforms
- CRM systems such as HubSpot or Salesforce
- ecommerce platforms like Shopify
- email marketing tools such as Klaviyo or Mailchimp
Coupler.io supports 400+ data sources, which means a single platform can handle the pipeline for all of these integrations, from ad platforms and analytics tools to CRM and ecommerce, without switching between multiple connector tools or building custom code for each source.
Once centralized, these datasets can be standardized and organized into reporting tables that serve dashboards, analyses, and operational reports across the company.
This allows marketing teams to answer questions that span multiple systems, such as:
- How marketing channels influence pipeline and revenue, not just traffic or conversions
- Which combinations of channels contribute most to multi-touch customer journeys
Instead of comparing isolated platform dashboards, teams can analyze data in BigQuery and monitor performance across the entire marketing ecosystem using one consistent dataset.
Another benefit of this approach is organizational alignment. Once marketing tools are connected to BigQuery, the warehouse often becomes a shared analytical resource for several teams, including marketing, revenue operations, product analytics, and leadership.
We saw this pattern with Fable Food. Their data from multiple systems was automatically loaded into BigQuery through Coupler.io, then organized into live dashboards for consolidated reporting. The result was better visibility across teams, faster decision-making, and significantly lower reporting effort.
When the hub is surfaced in a dashboard like Coupler.io’s CRM dashboard for HubSpot, that shared dataset becomes much easier to explore and act on.
Using AI for marketing analytics in BigQuery
BigQuery itself now includes natural-language query assistance and AI-generated summaries, allowing analysts to explore datasets without writing every query manually. A marketer can describe the analysis they want and let the system generate an initial query, retrieve the relevant tables, and return a summarized answer. That speeds up exploratory analysis, especially for teams that don’t work with SQL queries regularly.
There’s a real limitation, though. AI systems can interpret questions and generate queries, but they don’t guarantee that the underlying calculations are correct. Even Google’s documentation for AI-assisted querying notes that generated outputs can appear plausible while still containing errors.
Reliable marketing analytics still depends on a stable analytical layer where calculations are defined and validated. The architecture described throughout this guide exists to solve exactly that problem.
BigQuery provides the infrastructure for storing and querying large marketing datasets. Coupler.io adds two layers on top of that infrastructure that make AI analysis more reliable.
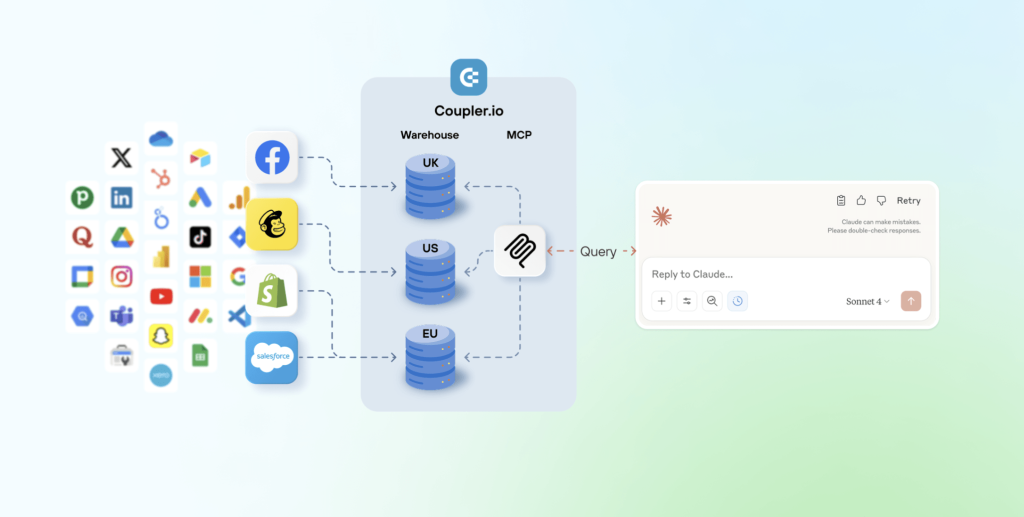
The first is the data integration layer. Coupler.io connects 400+ marketing, sales, and business apps to BigQuery (and to AI tools directly), keeping data refreshed, structured, and unified. Any AI tool querying the data starts with clean, fresh, consistent inputs rather than fragmented exports.
The second is the Analytical Engine. When you ask a question, whether through Coupler.io’s built-in AI Agent or through an external AI tool like Claude or ChatGPT connected via Coupler.io, the Analytical Engine handles all the math. It queries the dataset, performs calculations and aggregations, validates the results, and returns only verified numbers. The AI receives facts, not raw data. That eliminates the hallucination problem that plagues most AI analytics setups.
The workflow looks like this:
- The AI interprets your question.
- Coupler.io’s Analytical Engine queries the data, runs calculations, and validates results.
- The AI receives verified numbers and formats a readable answer with context.
The AI Agent functions directly inside Coupler.io. Ask questions in plain English like “Which campaigns performed best last month?” or “Why is our Facebook cost-per-lead 3x higher than Google Ads?” and get answers grounded in actual data, not AI approximations. You can also connect your Coupler.io data flows to Claude or ChatGPT for the same experience inside those tools.
The practical effect: teams can query marketing performance with BigQuery-backed data conversationally without worrying about whether the AI invented a number. BigQuery provides the warehouse foundation, and Coupler.io provides both the pipeline to keep that warehouse up to date and the analytical layer that makes AI trustworthy enough to act on.