
Building a Facebook Ads dashboard from scratch in Google Data Studio (formerly Looker Studio) takes time. You need to pick the right metrics, design the layout, connect data sources, and make it all refresh on schedule. Templates skip most of that work.
Below, I’ve collected over 20 Data Studio Facebook Ads templates. The first 10 are built by Coupler.io with automated data connections and scheduled refreshes. The remaining 11 come from third-party providers like Two-Minute Reports, Porter Metrics, DataBloo, and others.
Best Looker Studio Facebook Ads templates with Coupler.io connector
#1: Facebook Ads dashboard template by Coupler.io
A high-level overview of Facebook Ads campaign performance with automatic data refresh through Coupler.io’s Looker Studio connector. The dashboard covers core metrics across all your campaigns and breaks results down by country.

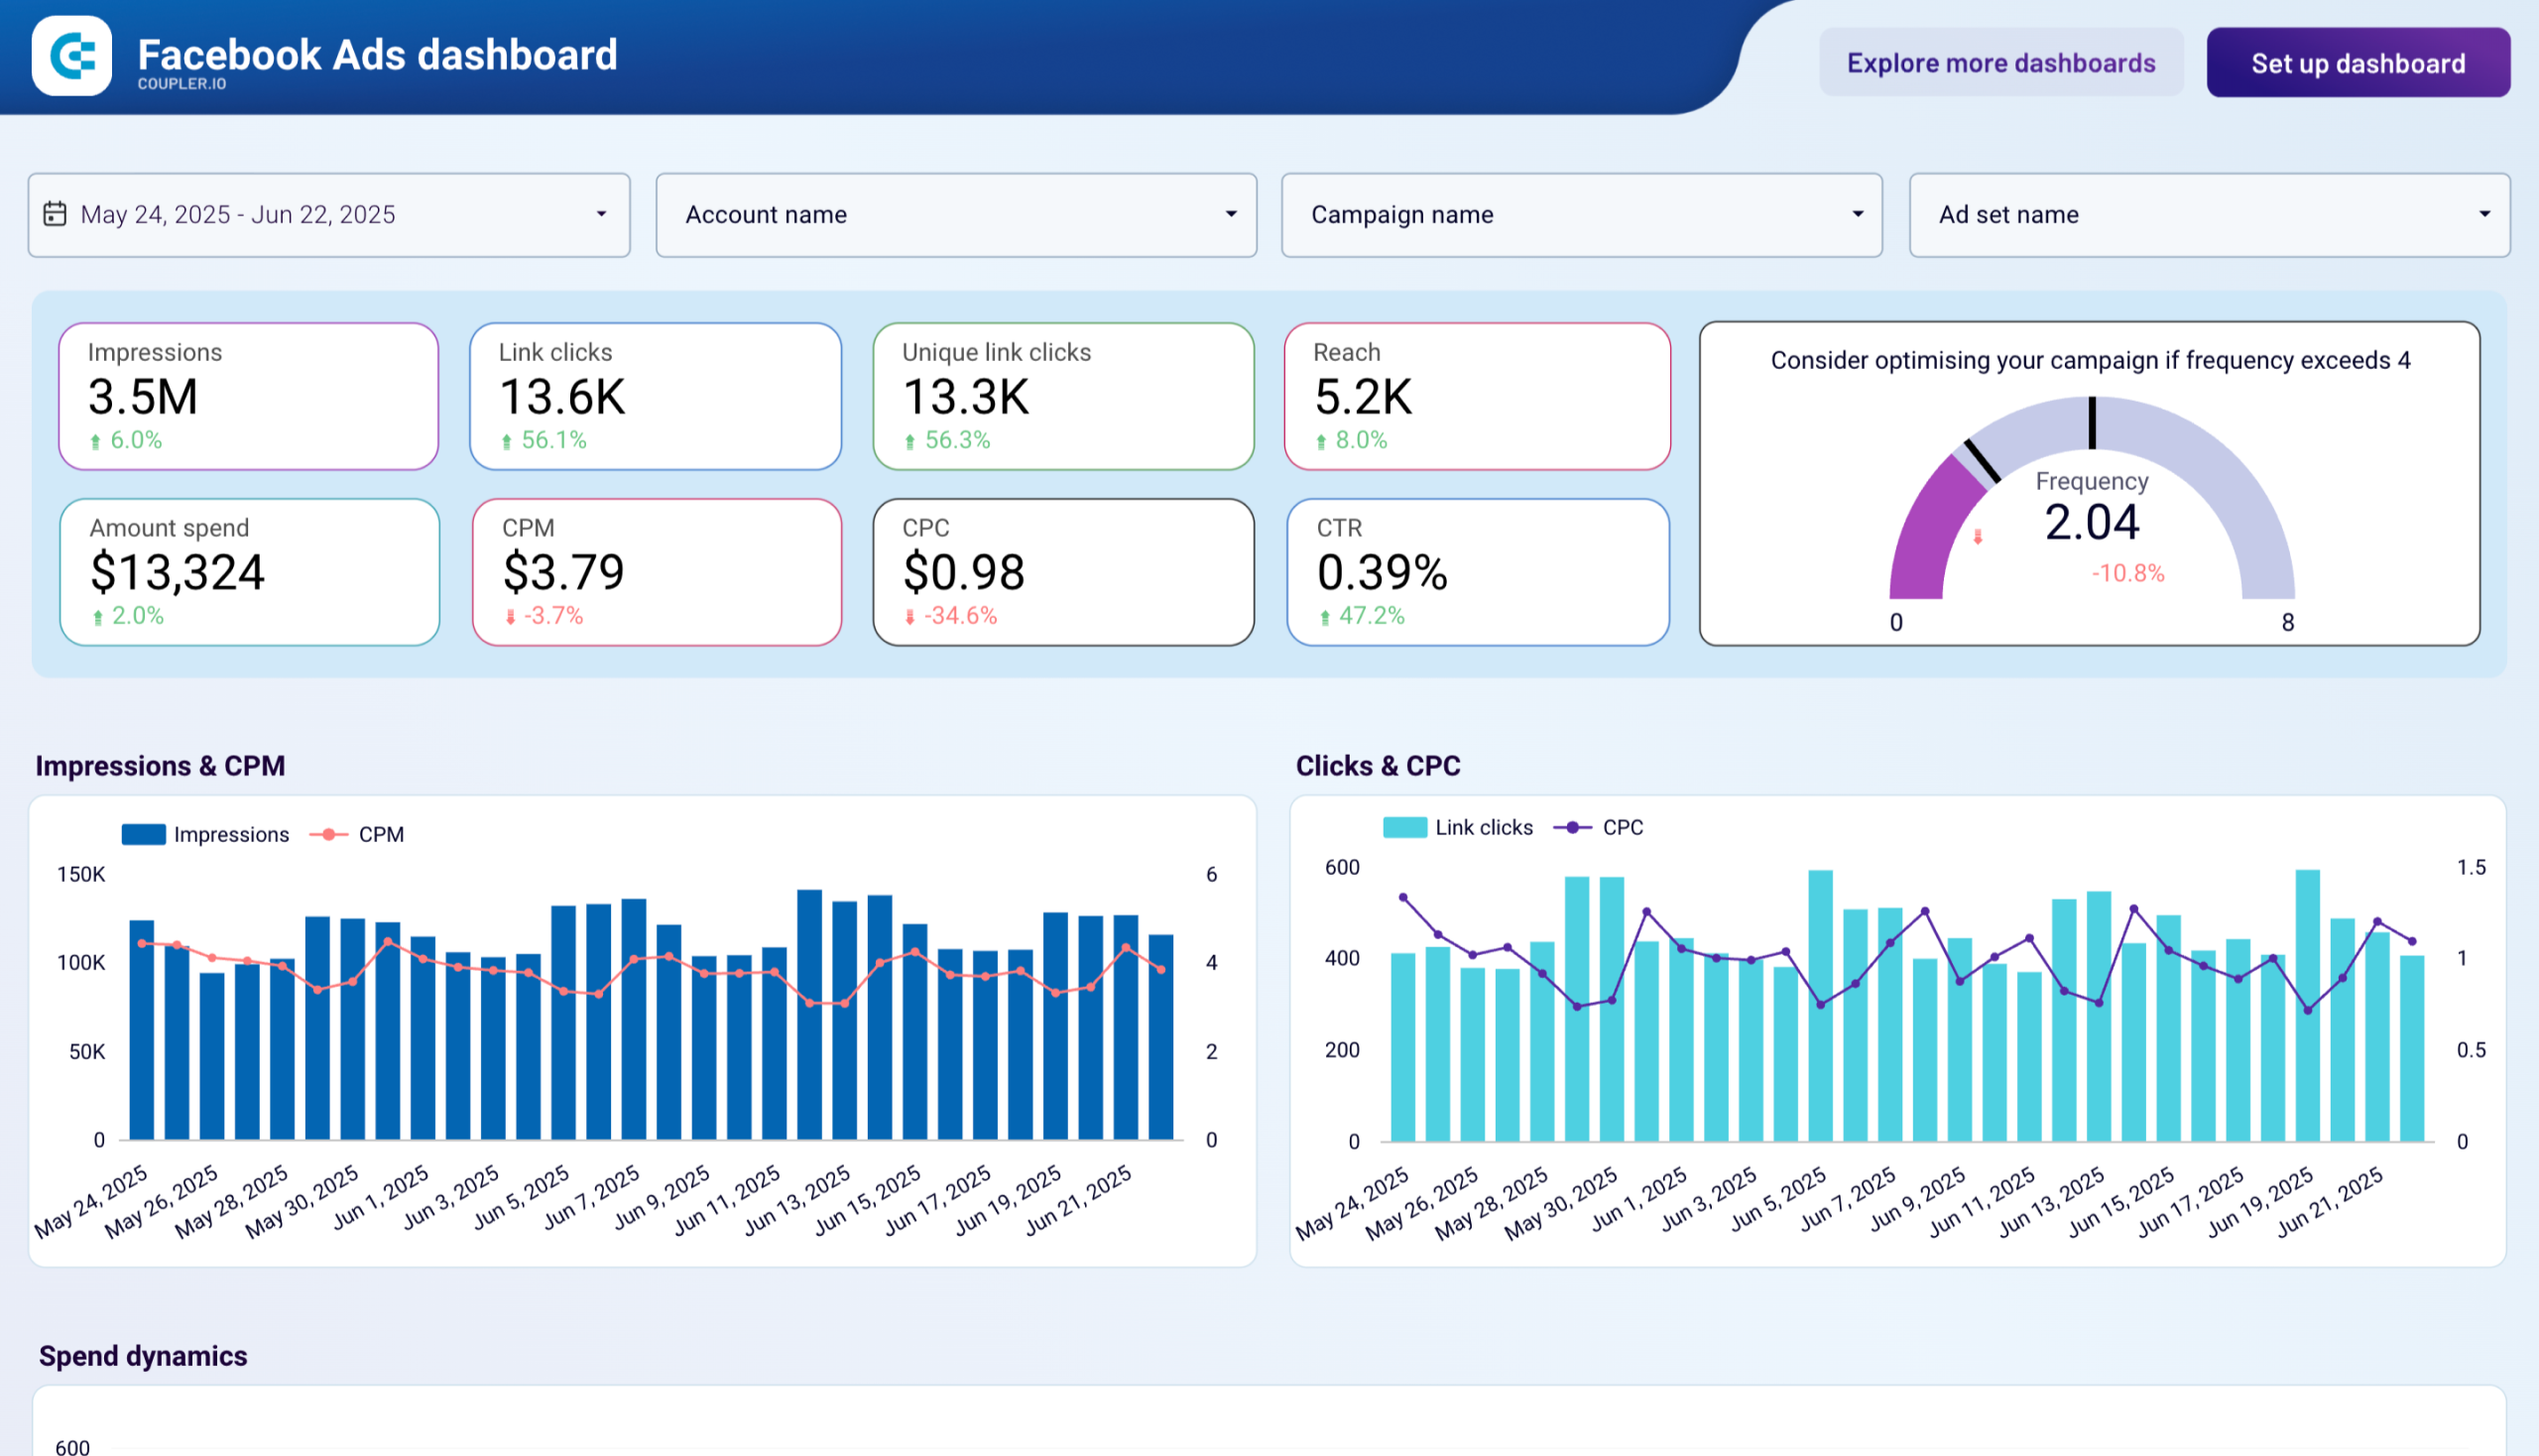
The dashboard template helps you compare campaign results across regions and find where your budget goes furthest. You can monitor how costs change alongside ad volume over time and catch budget pacing problems before they lead to overspending. Refresh frequency is configurable from every 15 minutes to monthly.
Metrics in the template
- Impressions
- Link clicks
- CPM
- CPC
- CTR
- Frequency
- Reach
- Amount spend
- Unique link clicks
Use this if: you need one dashboard that covers spend, clicks, CTR, CPC, CPM, and reach without extra complexity.
Coupler.io offers a range of other Looker Studio integrations for advertisers. By connecting various advertising platforms, CRMs, and marketing tools, businesses can access a comprehensive suite of tools to support data-driven decision-making processes. Coupler.io also provides expert services to assist advertisers in building bespoke data analytics dashboards and reporting templates.
#2. Facebook Ads leads breakdown dashboard template by Coupler.io
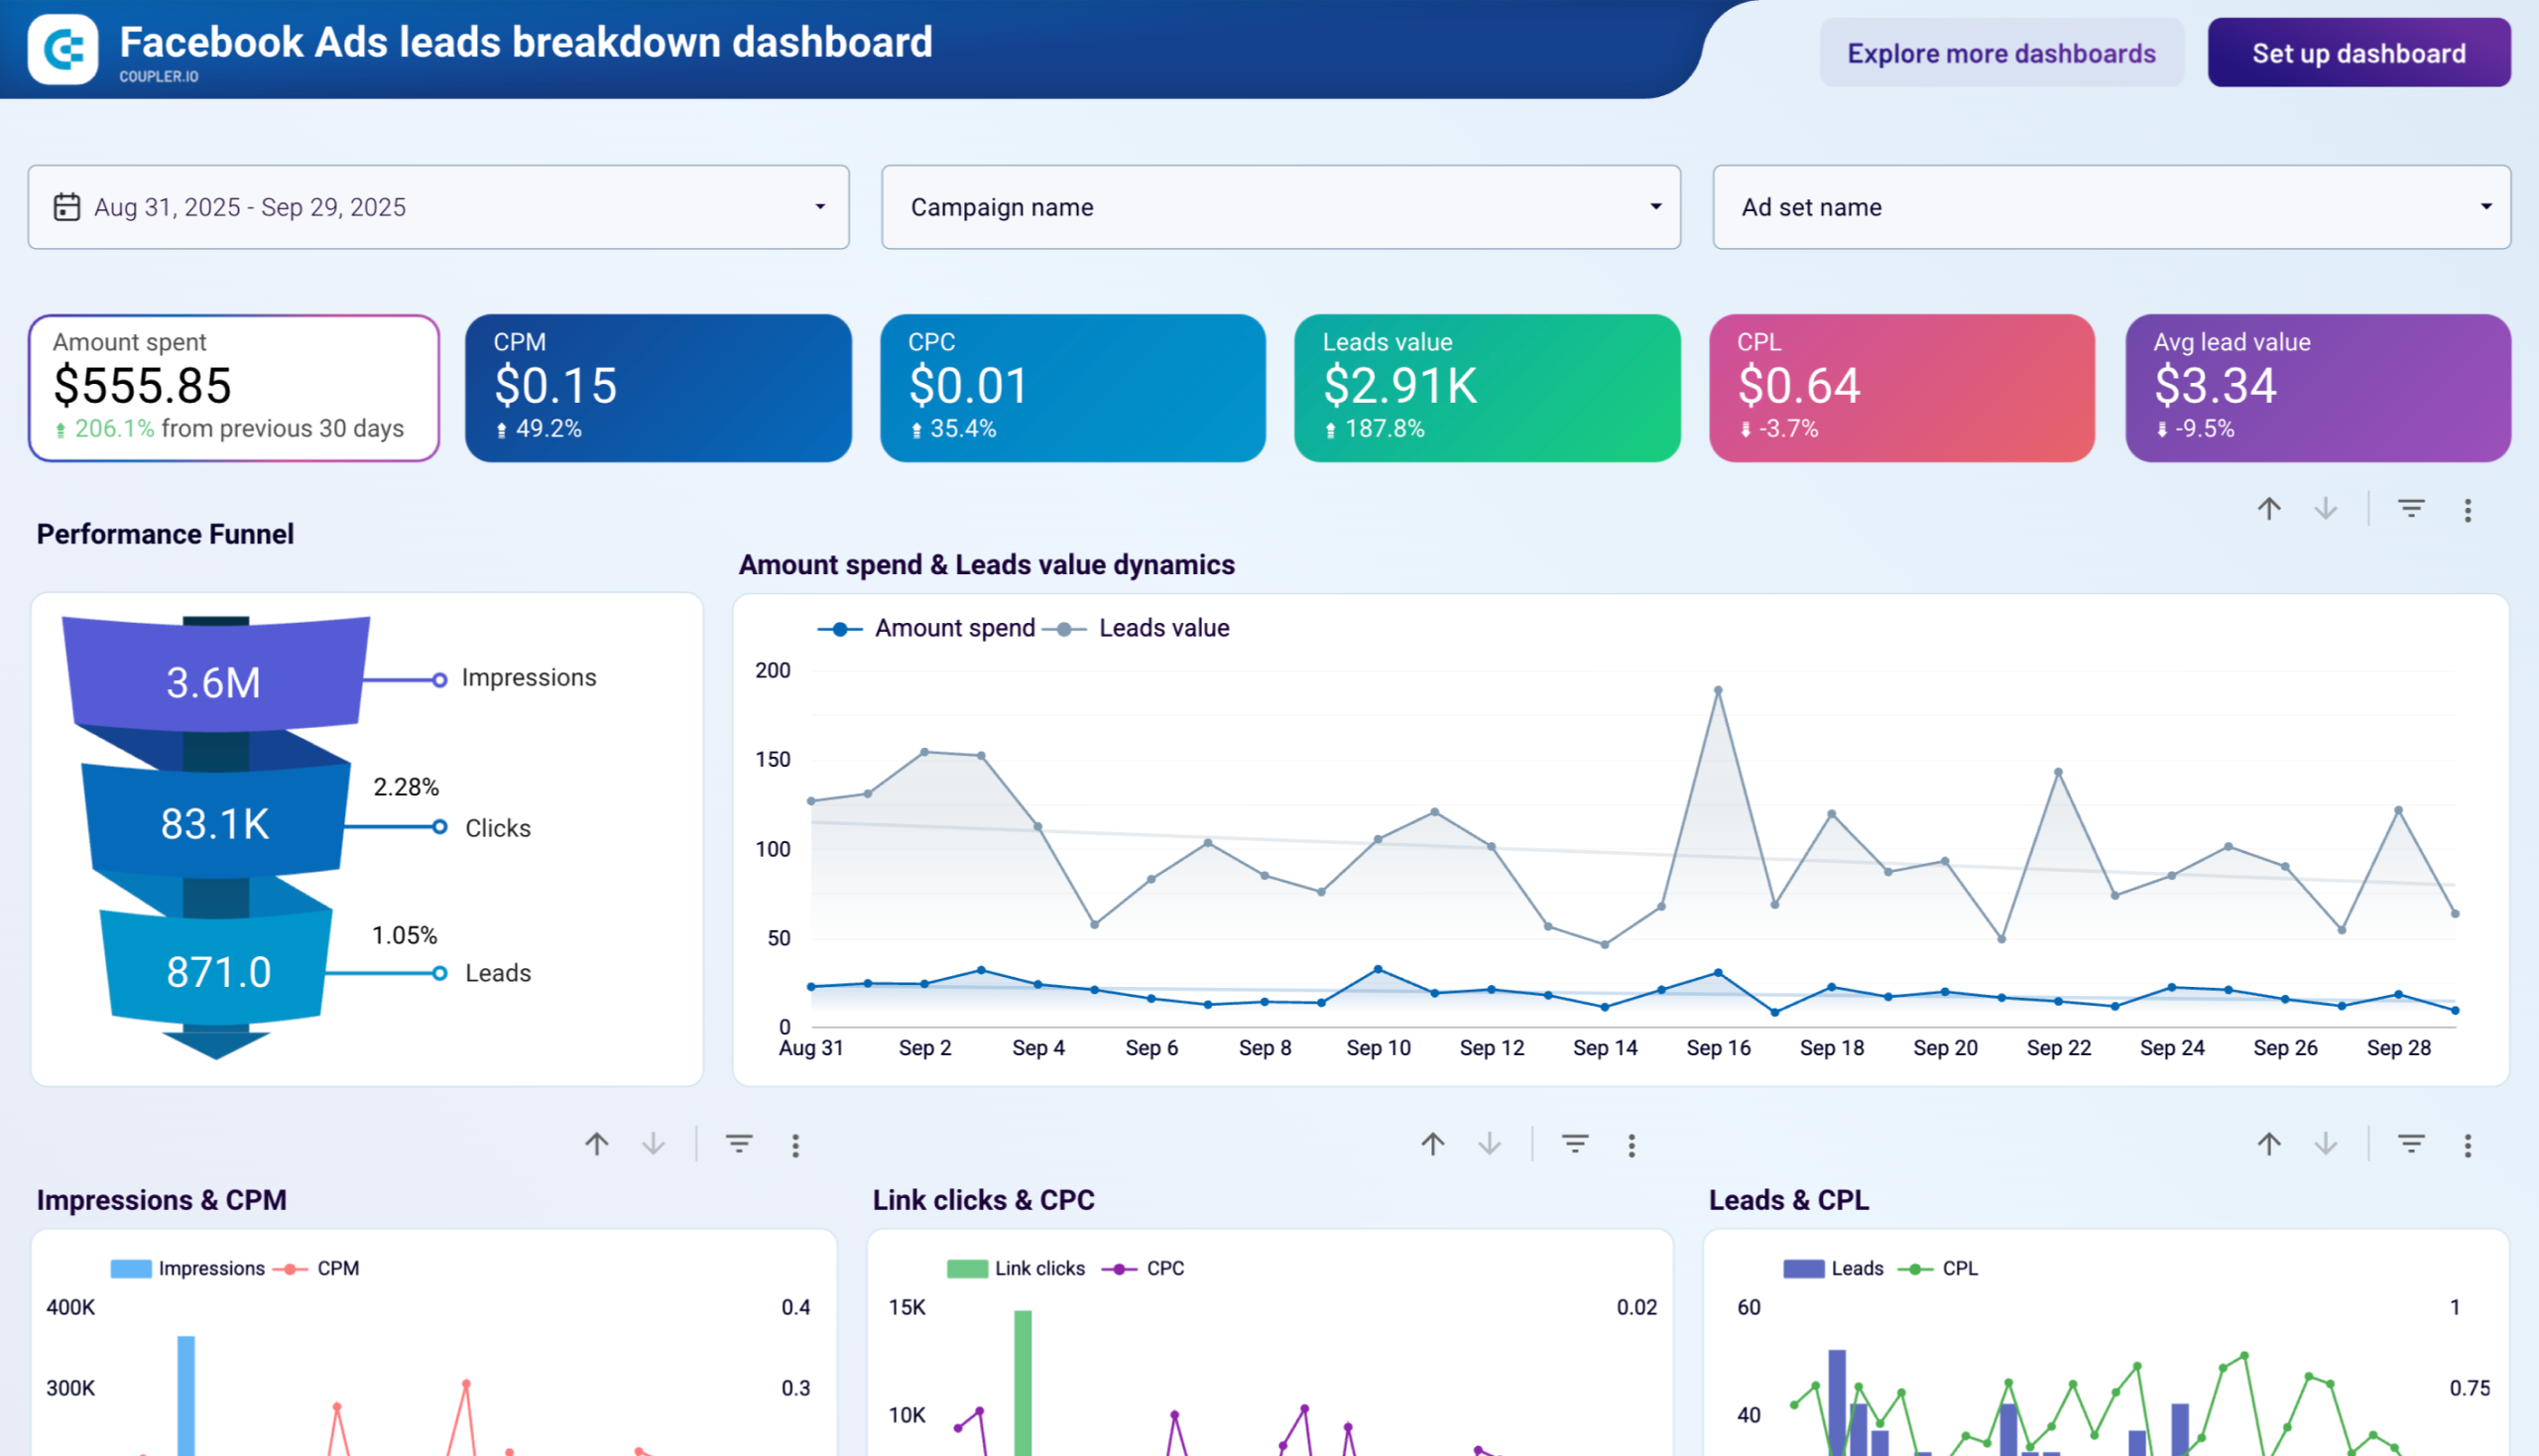
Built specifically for lead generation campaigns, this Facebook Ads Data Studio dashboard template tracks how impressions turn into clicks and then into leads. It includes month-over-month changes and demographic breakdowns by age, gender, and country.
Facebook Ads leads breakdown dashboard
Facebook Ads leads breakdown dashboard
Preview dashboardWith this dashboard, you can identify which demographic segments generate the most leads at the lowest cost. It’s also useful for spotting month-over-month shifts in lead volume and CPL, so you can reallocate budget toward the audiences that convert best. The template is fully automated with Coupler.io and populates within minutes after connecting your ad account.
Metrics in the template
- Amount spent
- Impressions
- Clicks
- Click-Through Rate (CTR)
- Cost-Per-Click (CPC)
- Cost per thousand impressions (CPM)
- Leads value
- Cost per lead (CPL)
- Average lead value
Use this if: you run lead gen campaigns and need to know exactly how much each lead costs by age group, gender, and country.
#3. Facebook Ads purchases breakdown dashboard template by Coupler.io
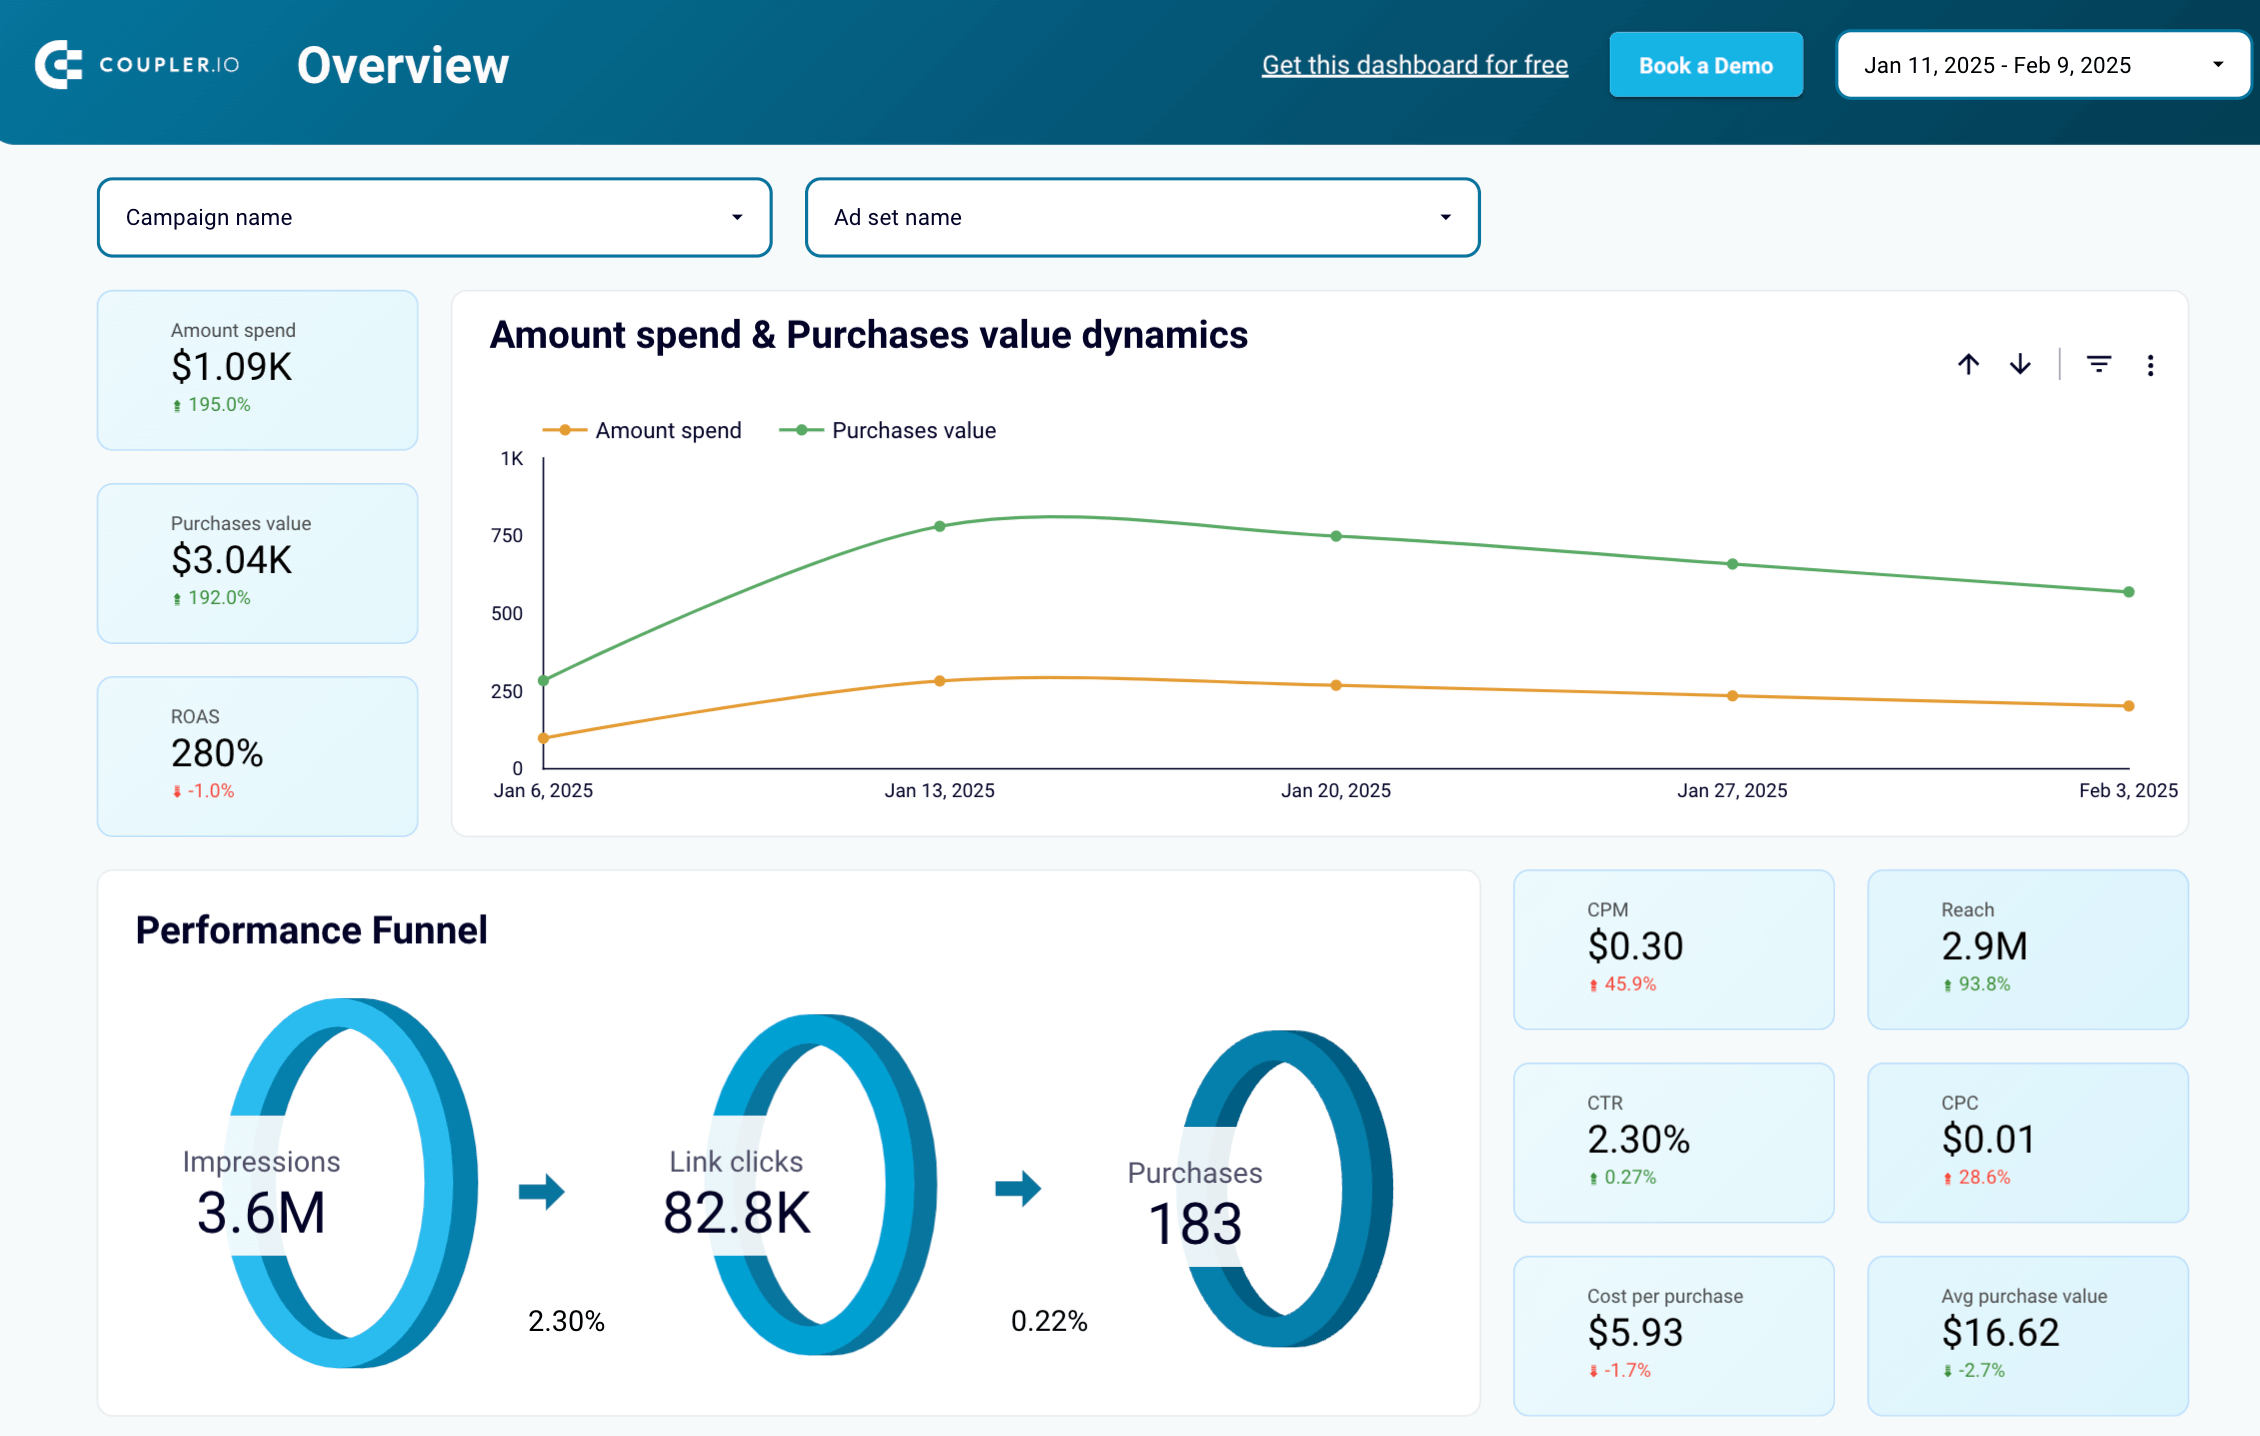
Where the leads dashboard focuses on form fills, this Facebook Ads template for Looker Studio tracks the full purchase funnel. It ties clicks and impressions to actual purchase value and ROAS with automated data collection through Coupler.io.
Facebook Ads purchase breakdown dashboard

Facebook Ads purchase breakdown dashboard
Preview dashboardYou can quickly tell which campaigns make money and which ones just burn budget. Monthly breakdowns for clicks, purchases, and ROAS help spot trends over quarters, not just day-to-day. The demographic and geographic sections show which audience segments drive the most revenue, which is useful for reallocating budget toward high-value markets.
Metrics in the template
- Amount spent
- Impressions
- Clicks
- Click-Through Rate (CTR)
- Cost-Per-Click (CPC)
- Cost per thousand impressions (CPM)
- Purchases value
- Cost per purchase
- Average purchase value
- Return on ads spend
Use this if: you sell products and want to see purchases, ROAS, and cost per purchase broken down by campaign, age, gender, and region.
#4 PPC multi-channel report template for Facebook Ads, Google Ads, and other ad platforms by Coupler.io
I’ve included this template in my selection since it’s a great solution for any PPC expert. In most cases, PPC advertising is not limited to a single platform, and PPC managers run campaigns across several platforms at once. This Looker Studio template puts Facebook Ads, Google Ads, LinkedIn Ads, Instagram Ads, and TikTok Ads side by side in one report.
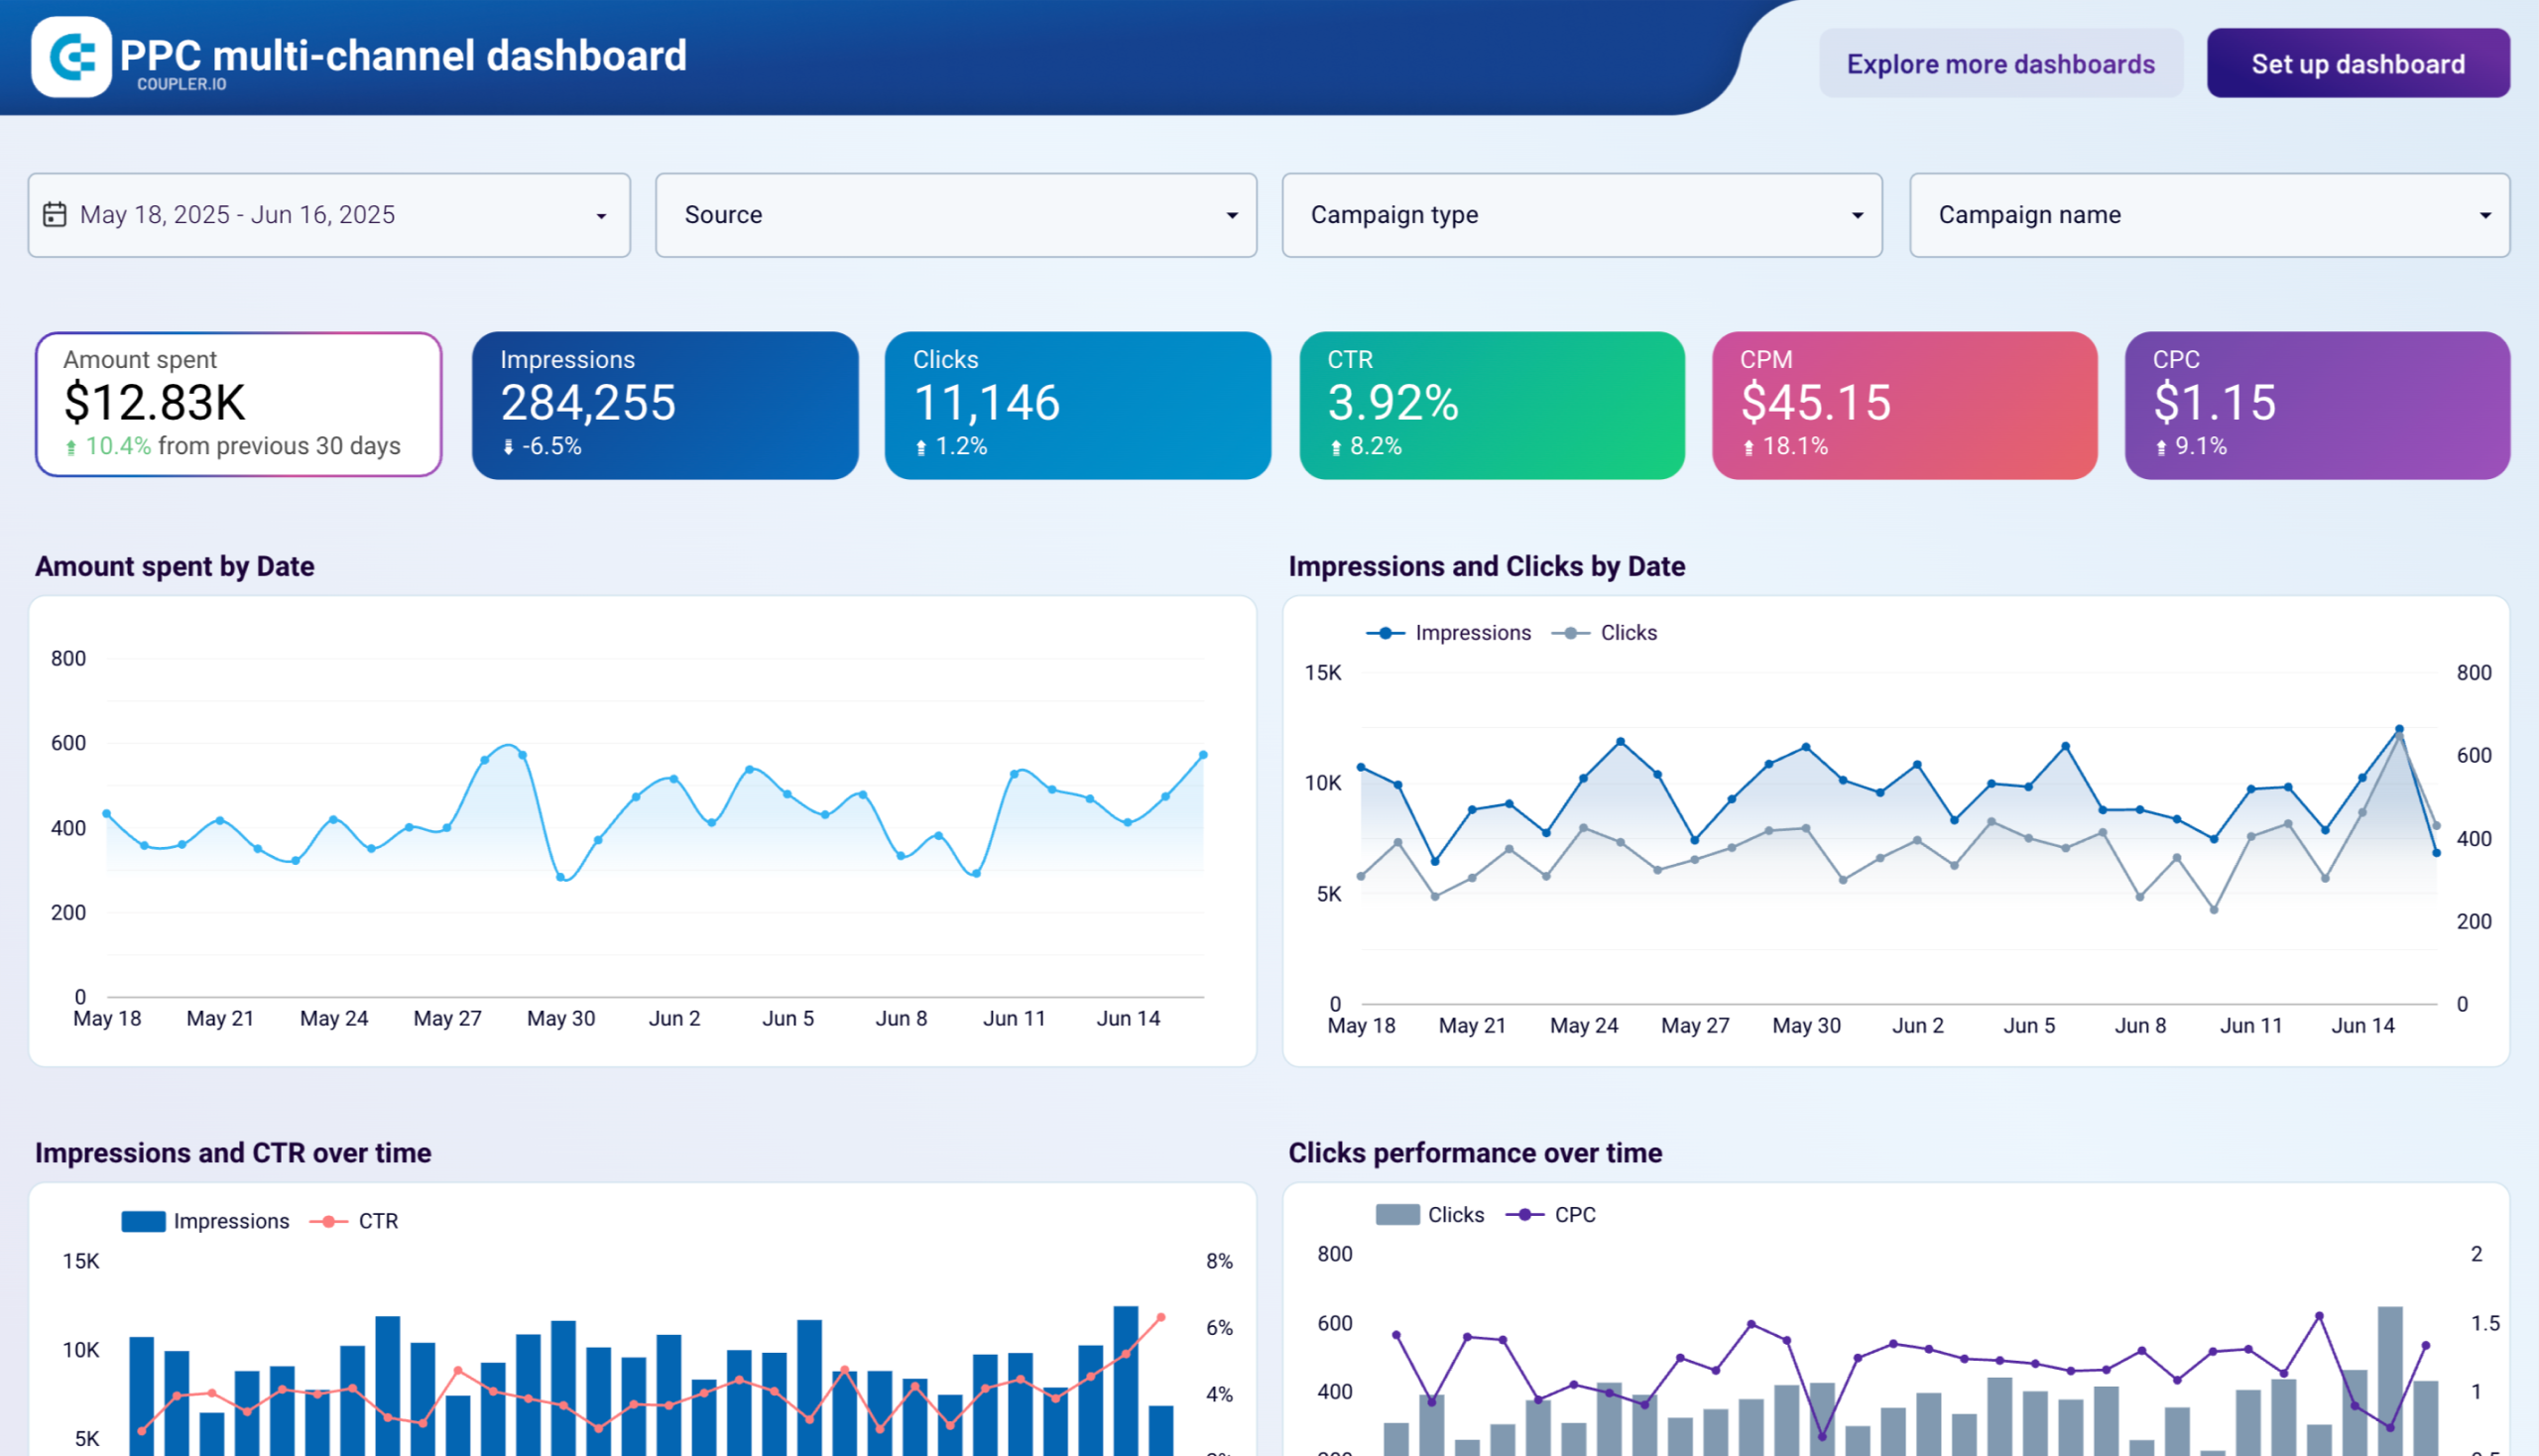
You can compare spend, impressions, clicks, and CPC across all channels or filter to just Facebook Ads when you need a focused view. The Looker Studio template is especially useful for answering “where should I shift budget this month?” without jumping between platform dashboards.
Metrics in the template
- Amount spent
- Impressions
- Clicks
- Click-Through Rate (CTR)
- Cost-Per-Click (CPC)
- Cost per thousand impressions (CPM), etc.
Use this if: you manage campaigns across multiple ad platforms and need one dashboard to compare them all.
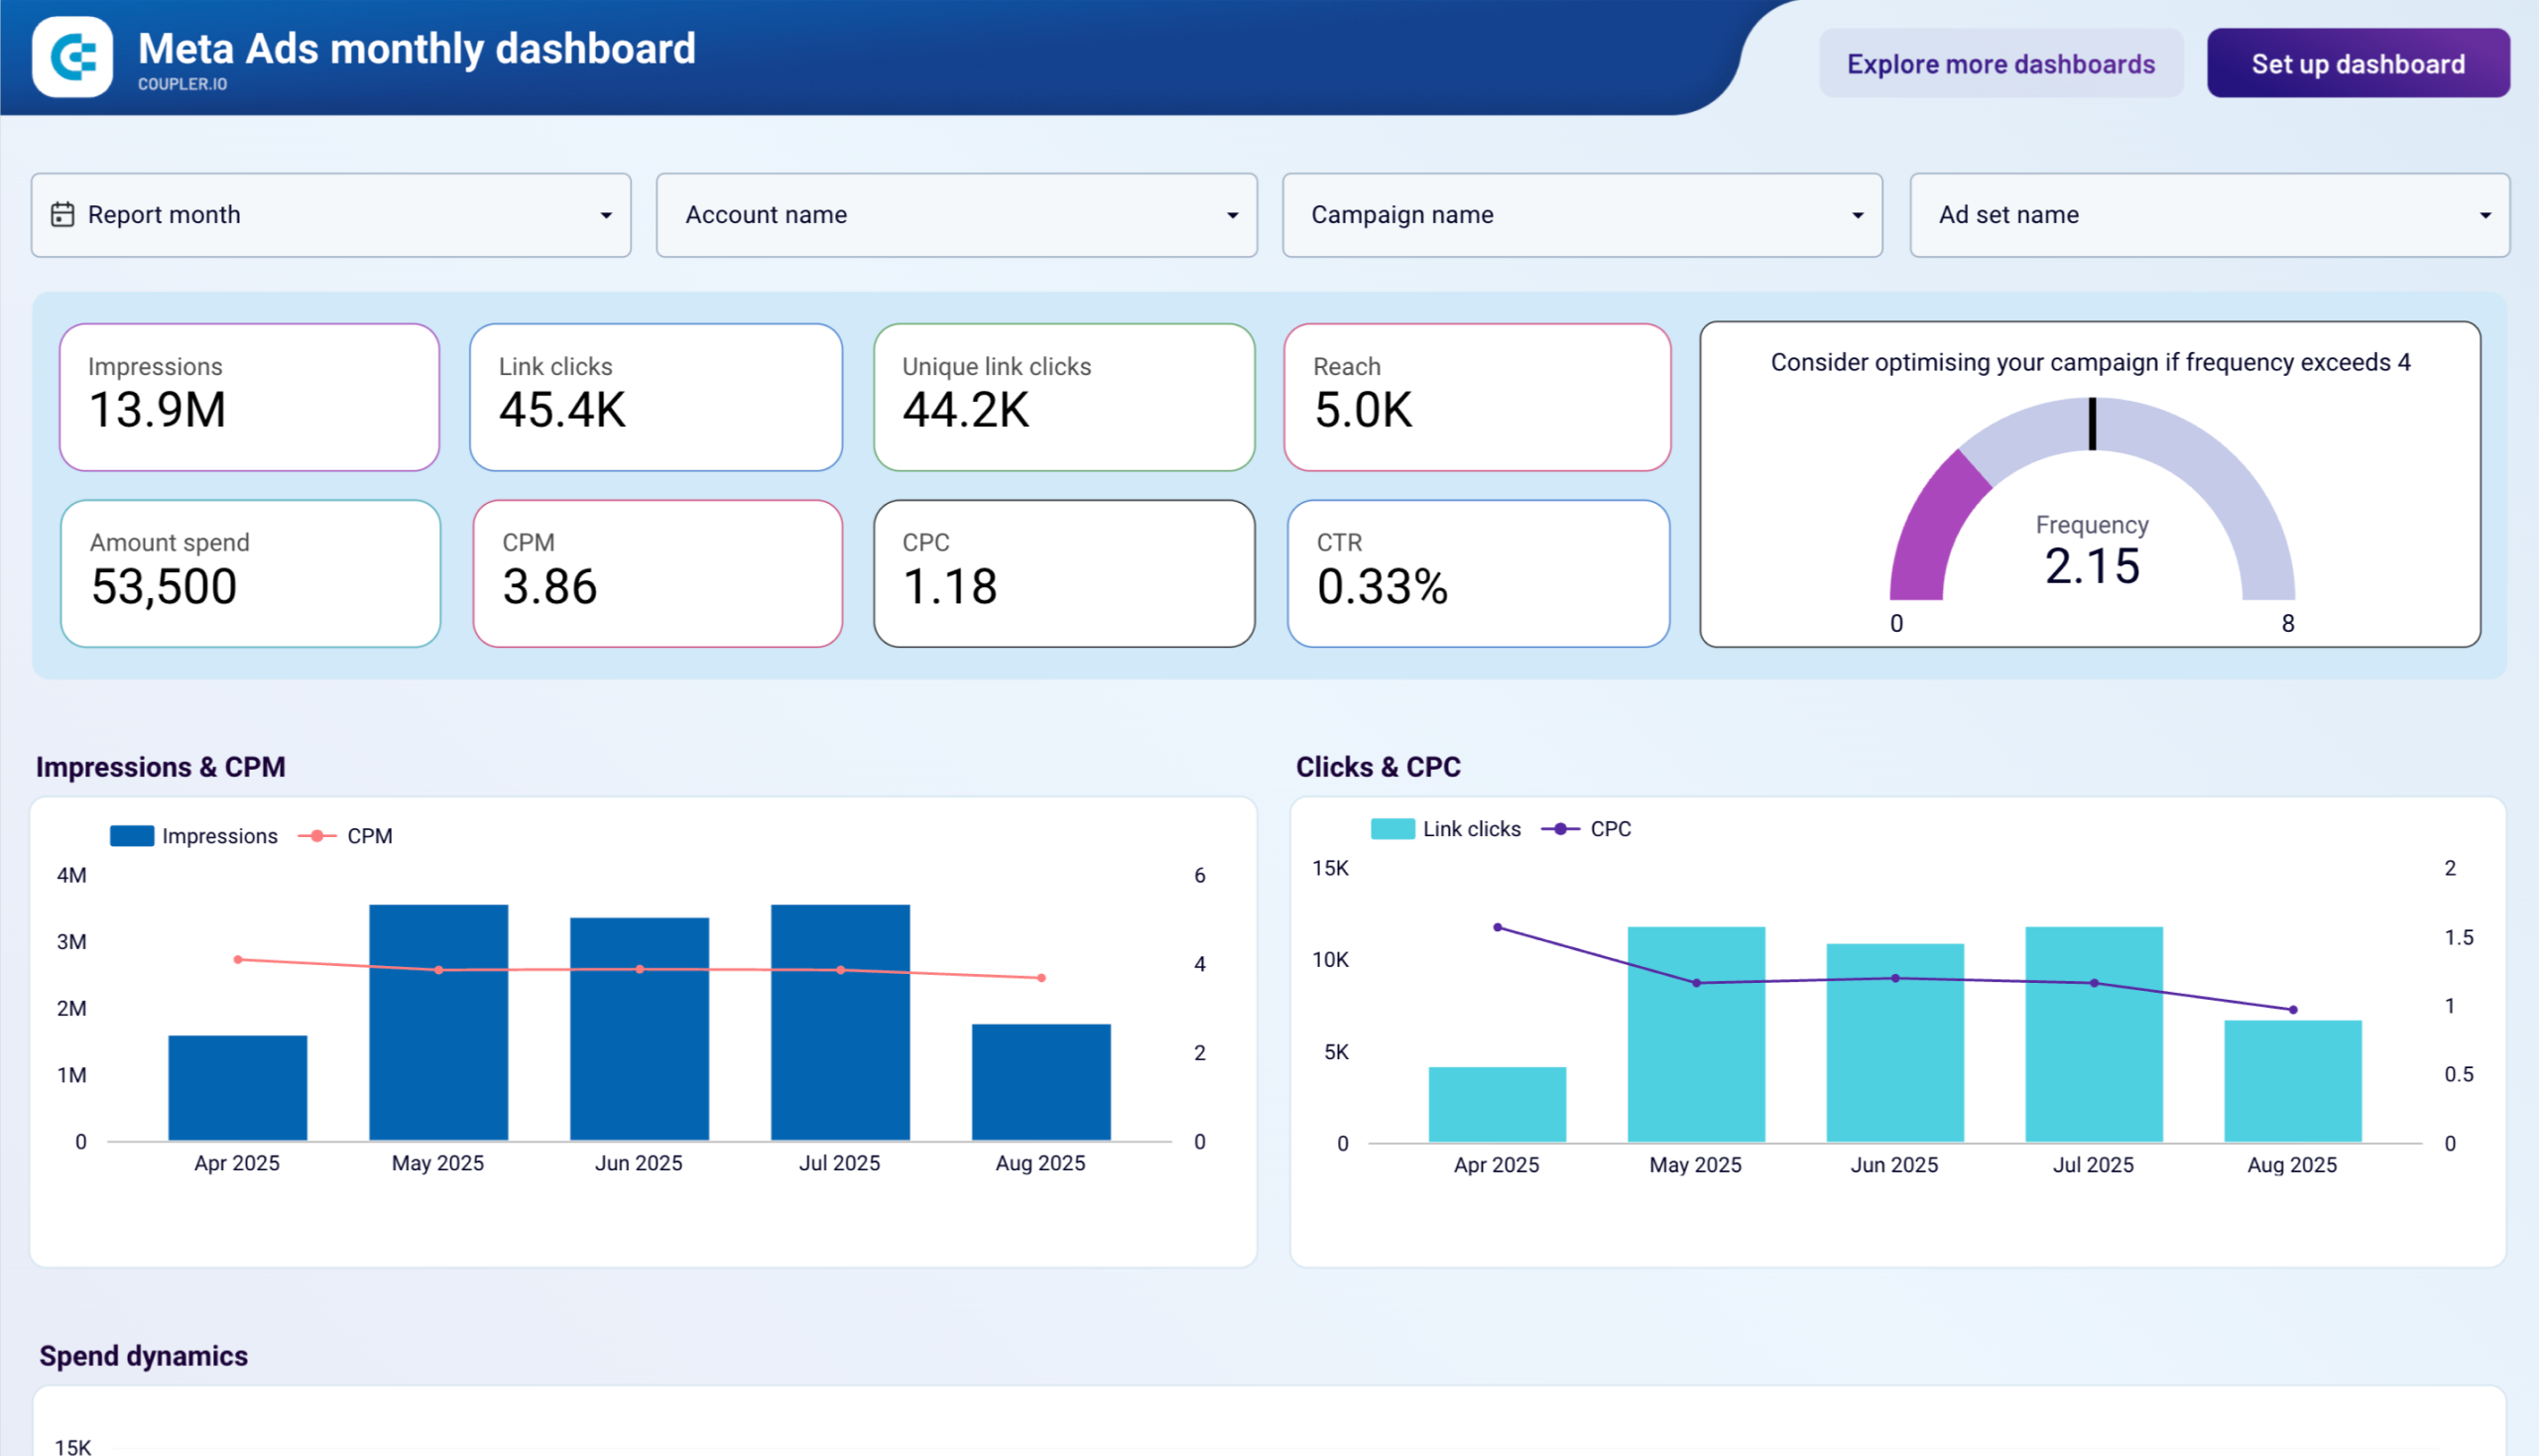
#5: Meta Ads monthly performance dashboard template by Coupler.io
Designed for executive reporting rather than daily monitoring, this Meta Ads dashboard focuses on month-over-month comparisons for Facebook and Instagram advertising. Data updates automatically on your preferred schedule through Coupler.io’s connector.
Meta Ads monthly performance dashboard
Meta Ads monthly performance dashboard
Preview dashboardThe dashboard template for FB Ads helps you compare this month’s impressions, clicks, spend, and CTR against last month. It also includes demographic engagement by age and gender, device performance across iPhone, Android, desktop, and tablet, and country-level breakdowns for geographic expansion decisions. An ad frequency section helps you spot audience fatigue before it affects results.
Metrics in the template
- Monthly impressions and reach trends
- Demographic engagement by age and gender
- Device performance breakdown
- Geographic click distribution
- Ad frequency management
- Campaign and ad set monthly comparisons
- Spend efficiency and CPM trends
Use this if: you need monthly executive reports that break down Facebook and Instagram ad performance by demographics, device, and geography.
#6: Meta Ads creatives dashboard template by Coupler.io
Instead of looking at campaigns as a whole, this dashboard breaks Facebook and Instagram ad performance down by individual creatives. It syncs automatically through Coupler.io’s built-in connector with customizable refresh schedules.
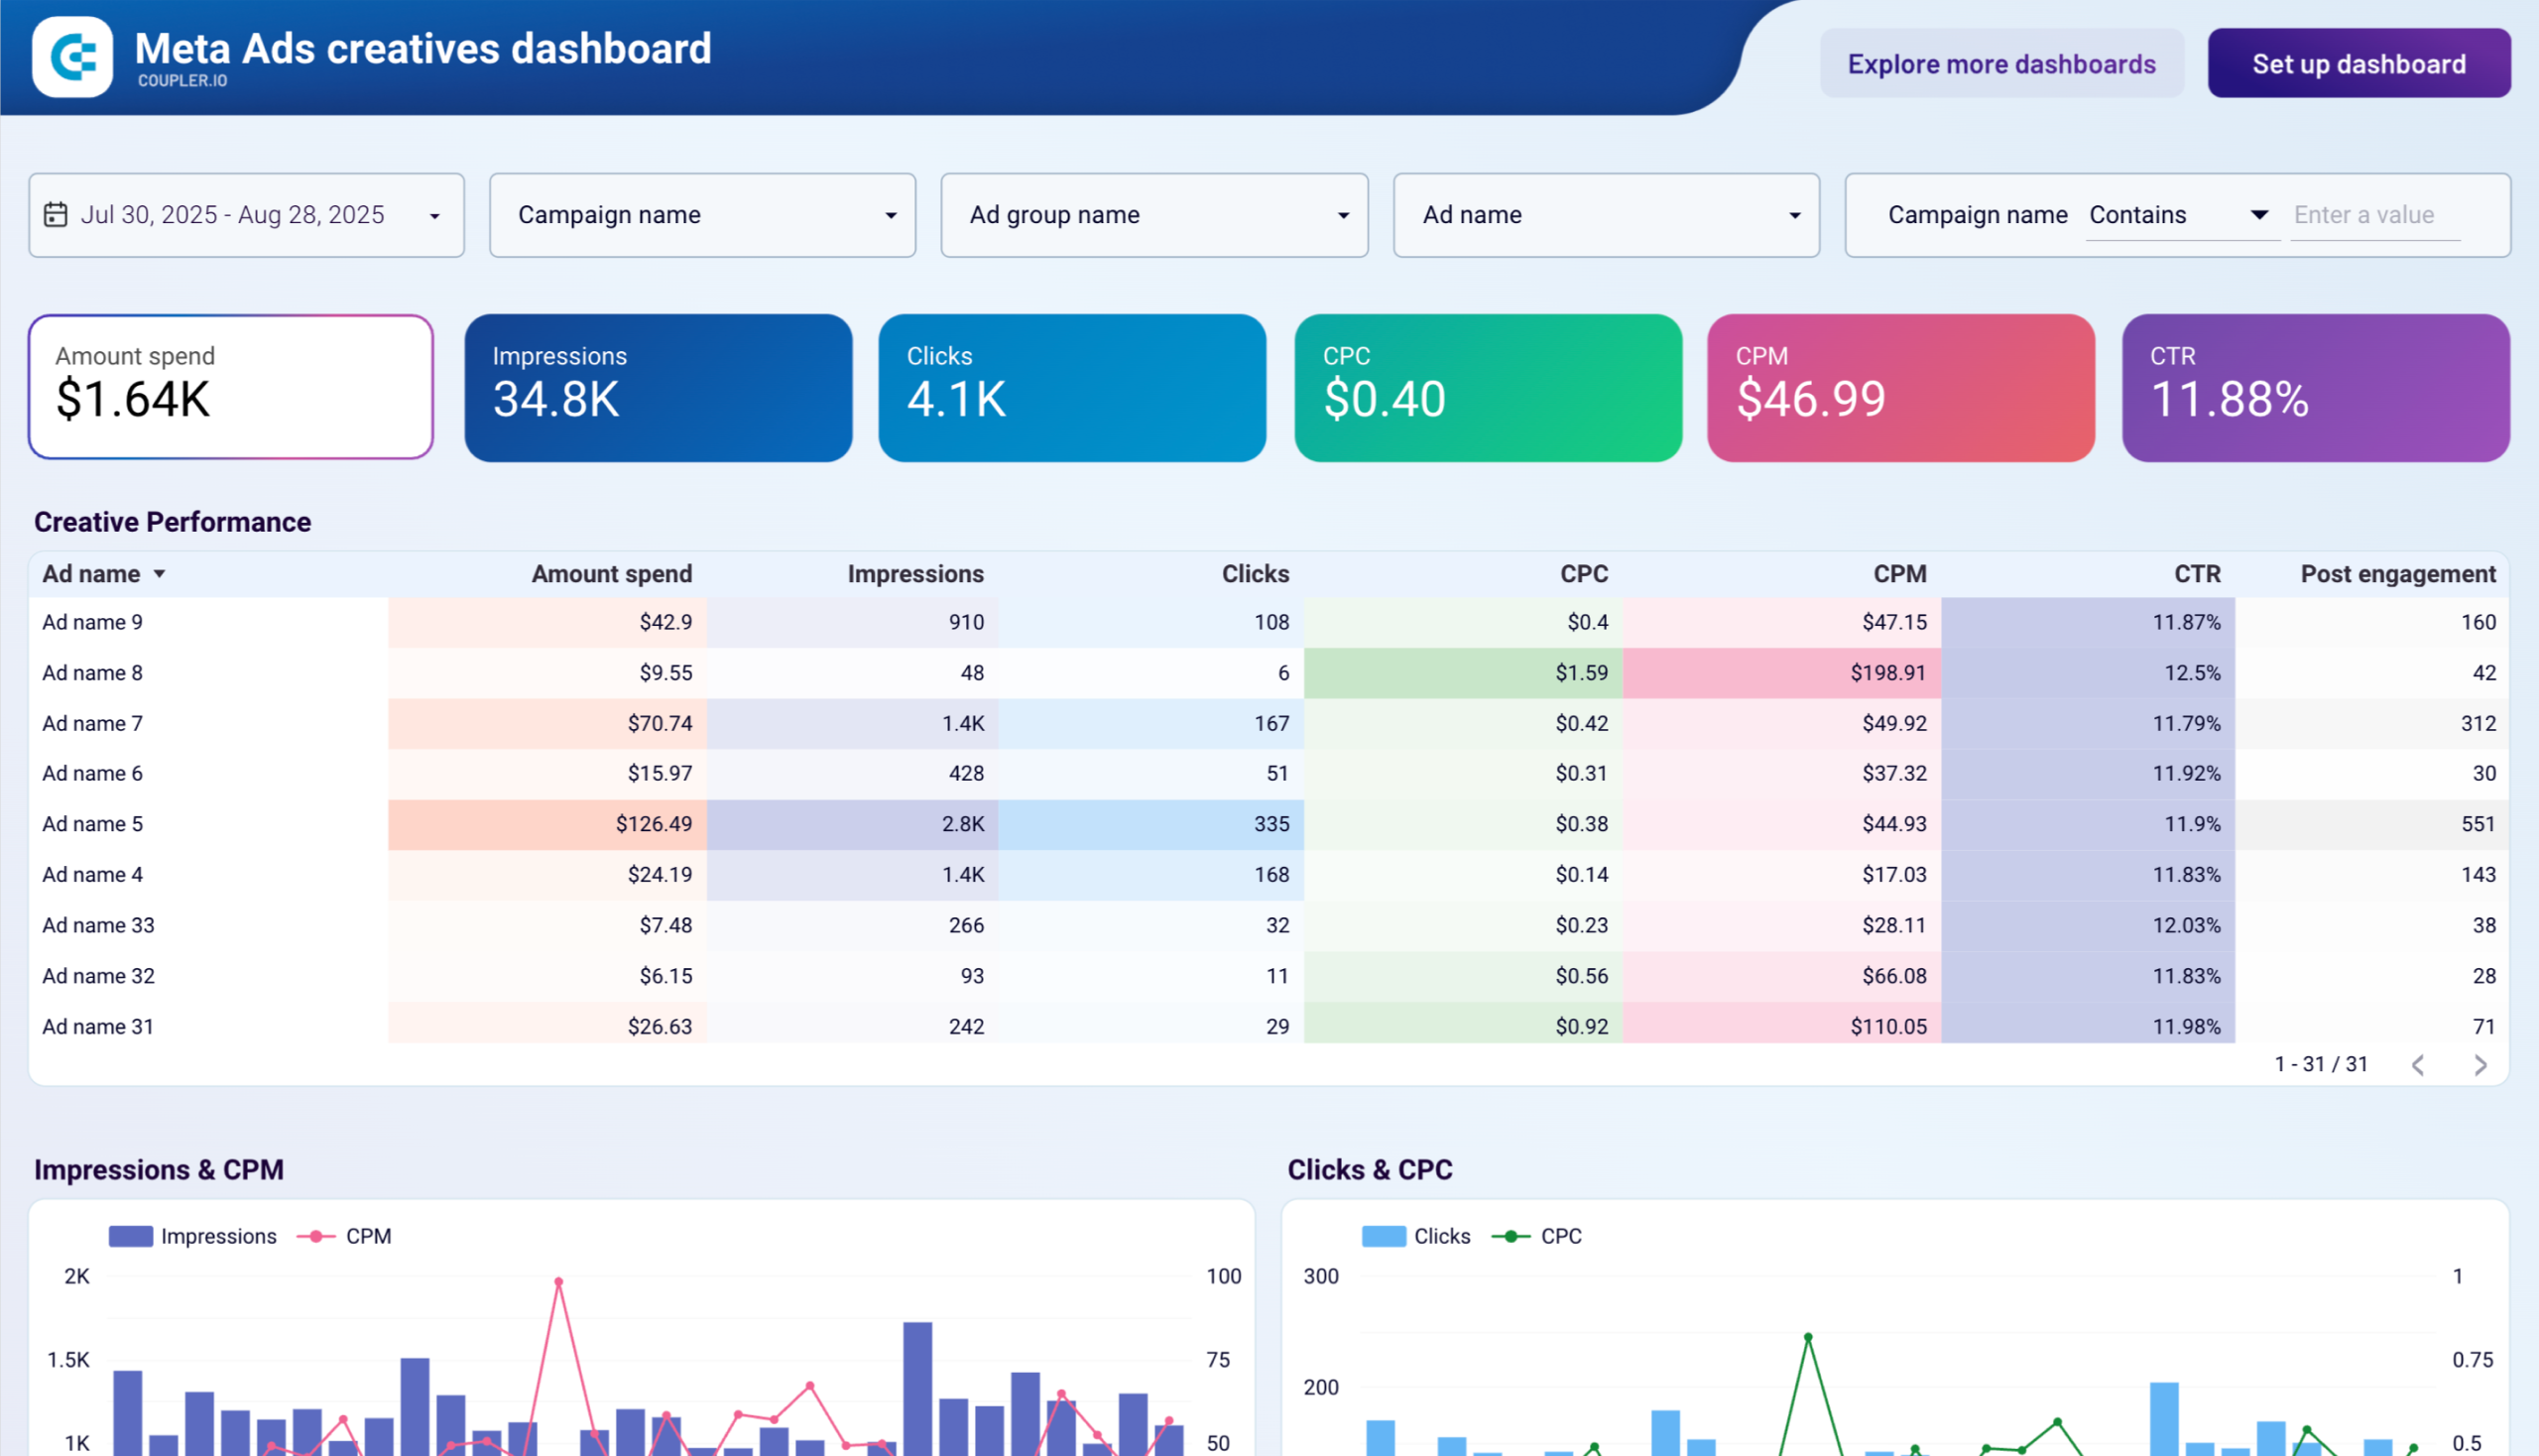
You can compare engagements, clicks, spend, and CPM across different ad images and videos to figure out what’s resonating with your audience. The creative-level breakdown tells you not just which creative gets the most clicks, but which one gets them cheapest, so you can double down on what works and cut what doesn’t.
Metrics in the template
- Impressions and CPM tracking
- Clicks and CPC analysis
- Creative engagement metrics
- Spend dynamics over time
- CTR and conversion performance
- Cost efficiency comparisons
Use this if: you want to compare how different ad creatives perform, specifically which images or videos get cheaper clicks and better engagement.
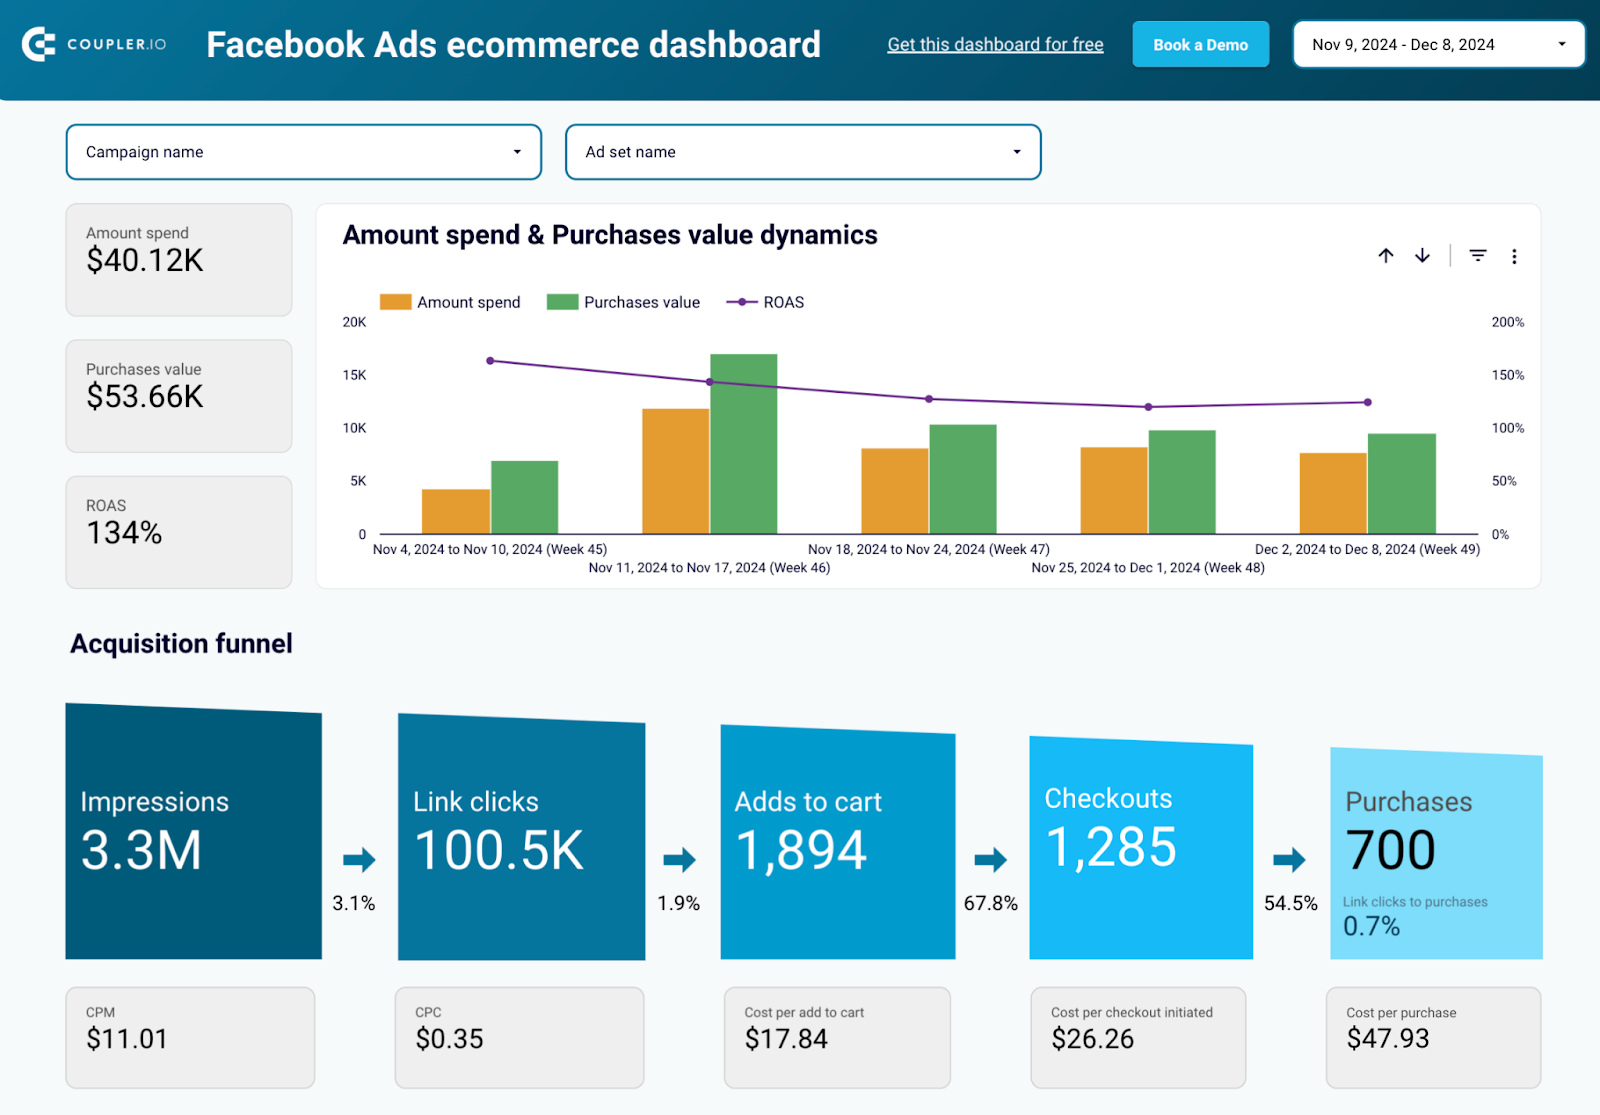
#7: Facebook Ads ecommerce performance dashboard template by Coupler.io
An e-commerce conversion funnel for Facebook Ads, mapping add-to-cart events, checkouts, and purchases against ad spend. The Data Studio template connects through Coupler.io’s automated Facebook Ads data connector for consistent updates.
Facebook Ads ecommerce performance dashboard

Facebook Ads ecommerce performance dashboard
Preview dashboardThe funnel visualization shows exactly where people drop off between stages. A high add-to-cart rate paired with a low checkout rate, for example, points to a different problem than low clicks overall. You can also compare campaign performance with flexible filtering and monitor conversion rates at each funnel stage
Metrics in the template
- Add to cart events and rates
- Checkout completion tracking
- Purchase events and values
- ROAS calculations
- Conversion funnel metrics
- Campaign comparison data
- Demographic performance breakdowns
Use this if: you run an online store and want funnel metrics (add to cart, checkout, purchase) alongside ROAS in one view.
#8: Facebook Ads performance for mobile apps dashboard template by Coupler.io
This is the only template on this list that is built specifically for mobile app advertisers. It compares ad spend against app installs and in-app purchases through a performance funnel that covers the full journey from impression to purchase.
Facebook Ads performance for mobile apps dashboard

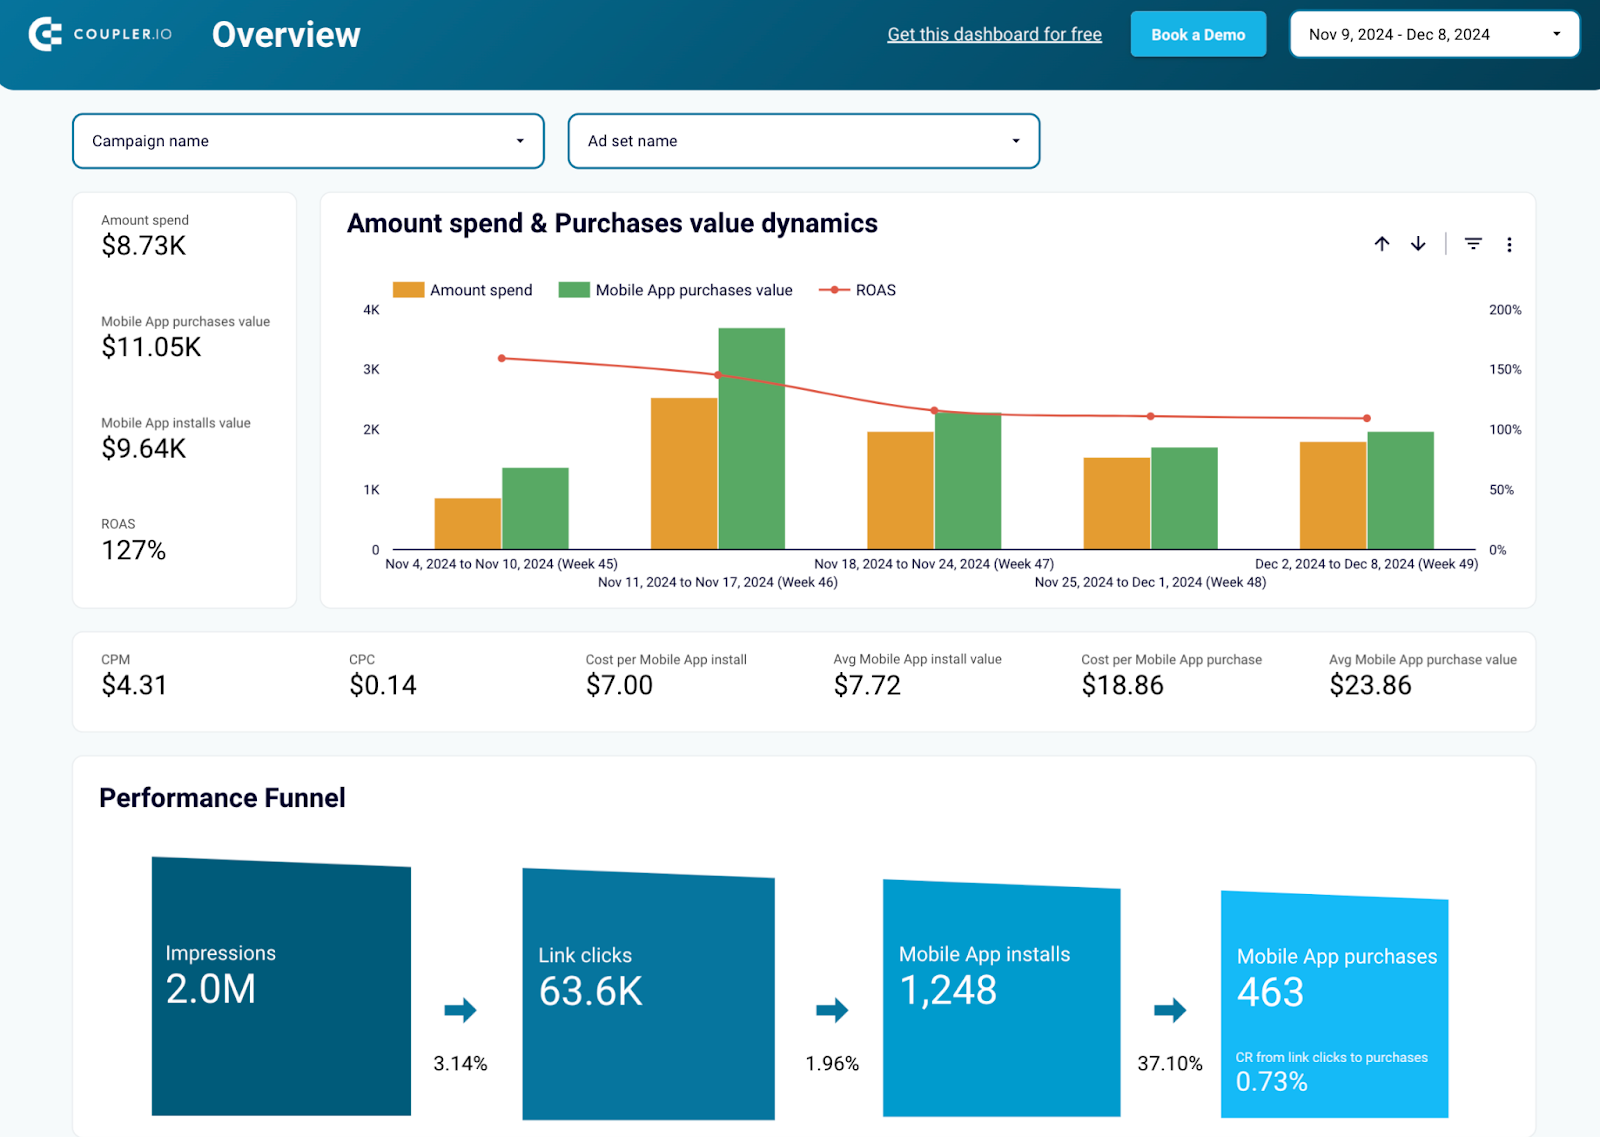
Facebook Ads performance for mobile apps dashboard
Preview dashboardYou can see drop-off rates at each funnel stage and identify which campaigns drive the most installs per dollar. The Looker Studio template also tracks CPI (cost per install), CPC, and CPP (cost per purchase), which is essential for keeping mobile acquisition costs under control. Data syncs from your Facebook Ads account through Coupler.io with minimal setup.
Metrics in the template
- App install tracking and CPI
- In-app purchase events
- ROAS for mobile campaigns
- User acquisition funnels
- App usage dynamics
- Cost efficiency metrics
- Campaign performance comparisons
Use this if: you run mobile app install campaigns and need to track app installs, in-app purchases, and mobile ROAS.
#9: Facebook Ads & brand awareness dashboard template by Coupler.io
Most Facebook Ads dashboards only show you what happens on Facebook. This one adds Google Search Console data, so you can see whether ad impressions correlate with increases in branded keyword searches.
Facebook Ads & brand awareness dashboard

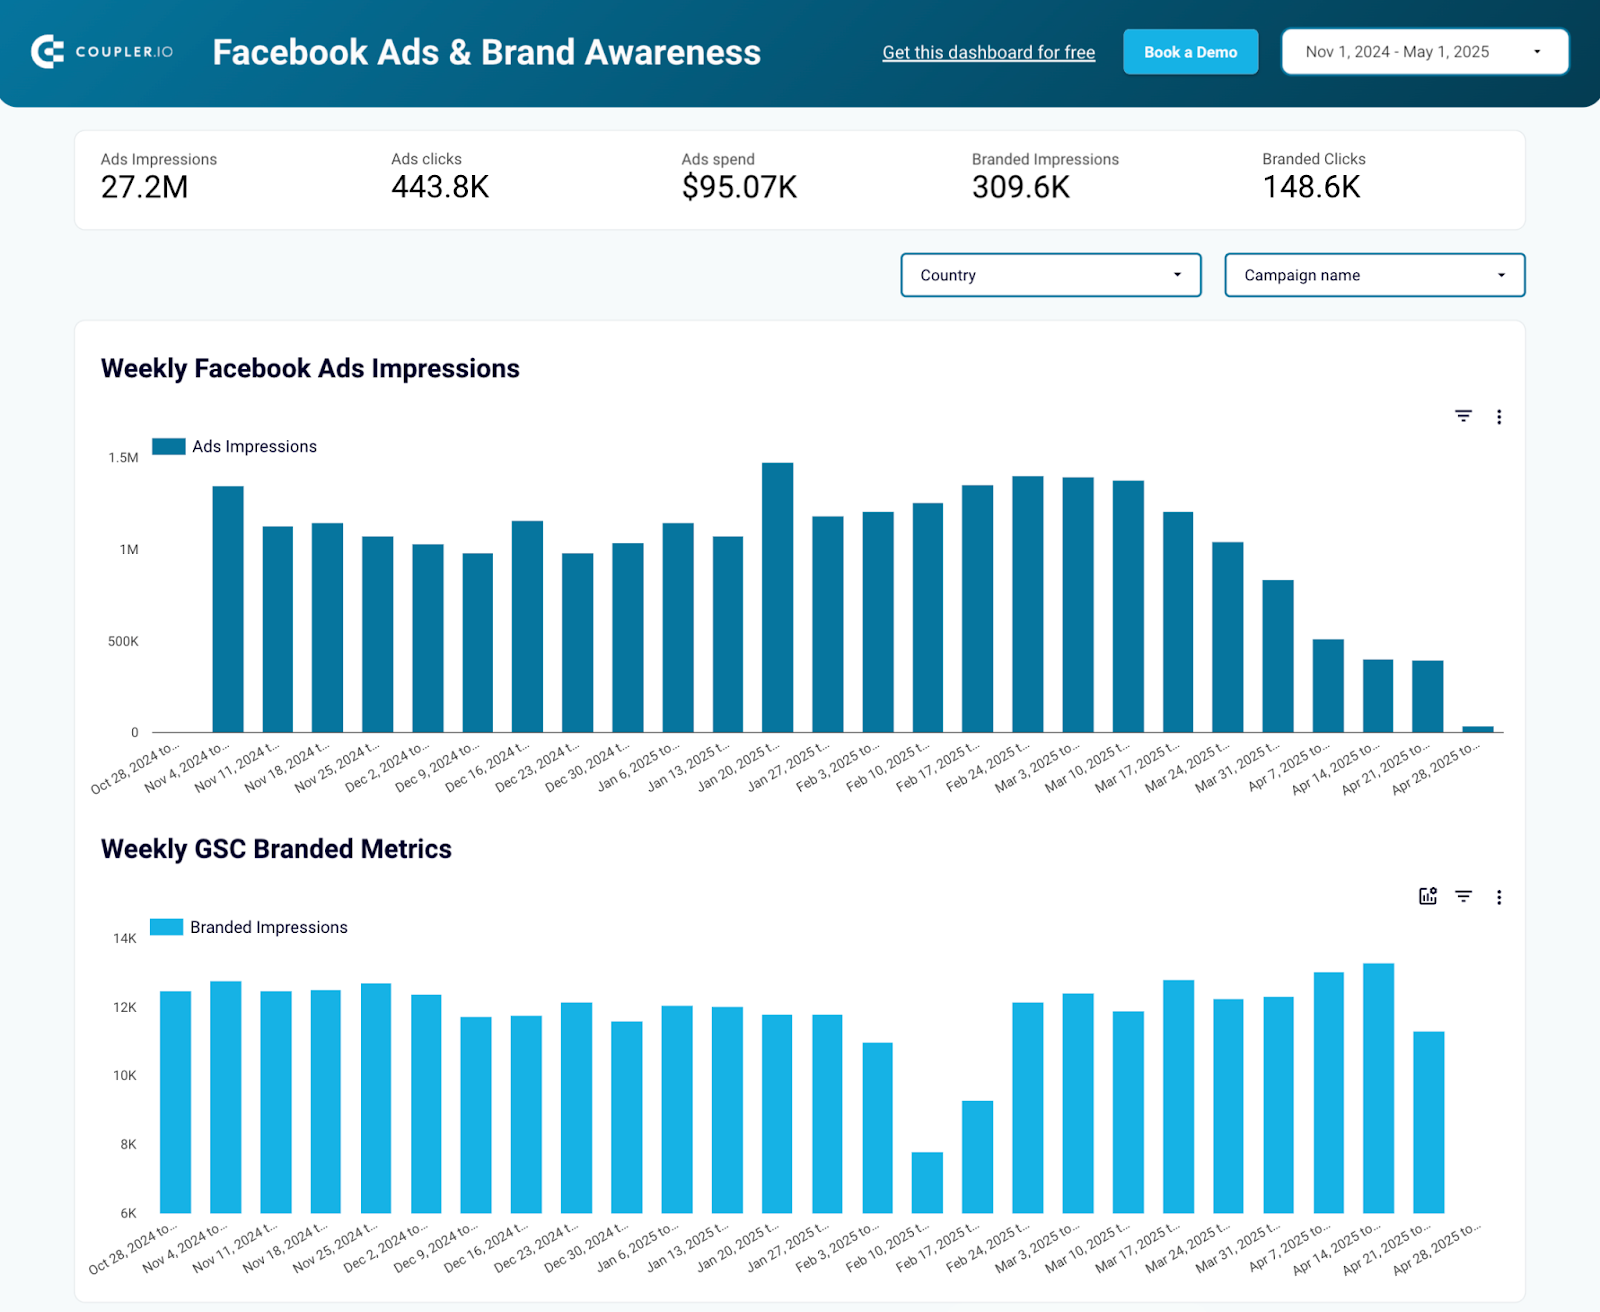
Facebook Ads & brand awareness dashboard
Preview dashboardThe Data Studio dashboard template helps you understand how paid campaigns affect organic brand interest. It tracks weekly Facebook Ads impressions, ad spend, branded search impressions, and branded clicks in one view. You select the region where you run ads, and the automated data integration through Coupler.io keeps the numbers up to date.
Metrics in the template
- Facebook ad impressions tracking
- Branded search impressions
- Correlation analysis charts
- Campaign impact on brand searches
- Geographic performance data
- Time-based brand awareness trends
Use this if: you want to measure whether your Facebook Ads are actually driving branded searches by connecting ad impressions to Google Search Console data.
#10: Google Ads and Meta Ads campaign performance dashboard by Coupler.io
This template provides a side-by-side comparison of Google Ads and Meta Ads in one Data Studio report. Built-in Coupler.io connectors for both platforms mean you just connect your ad accounts, and the data starts flowing to the dashboard.
Meta Ads and Google Ads campaign performance dashboard

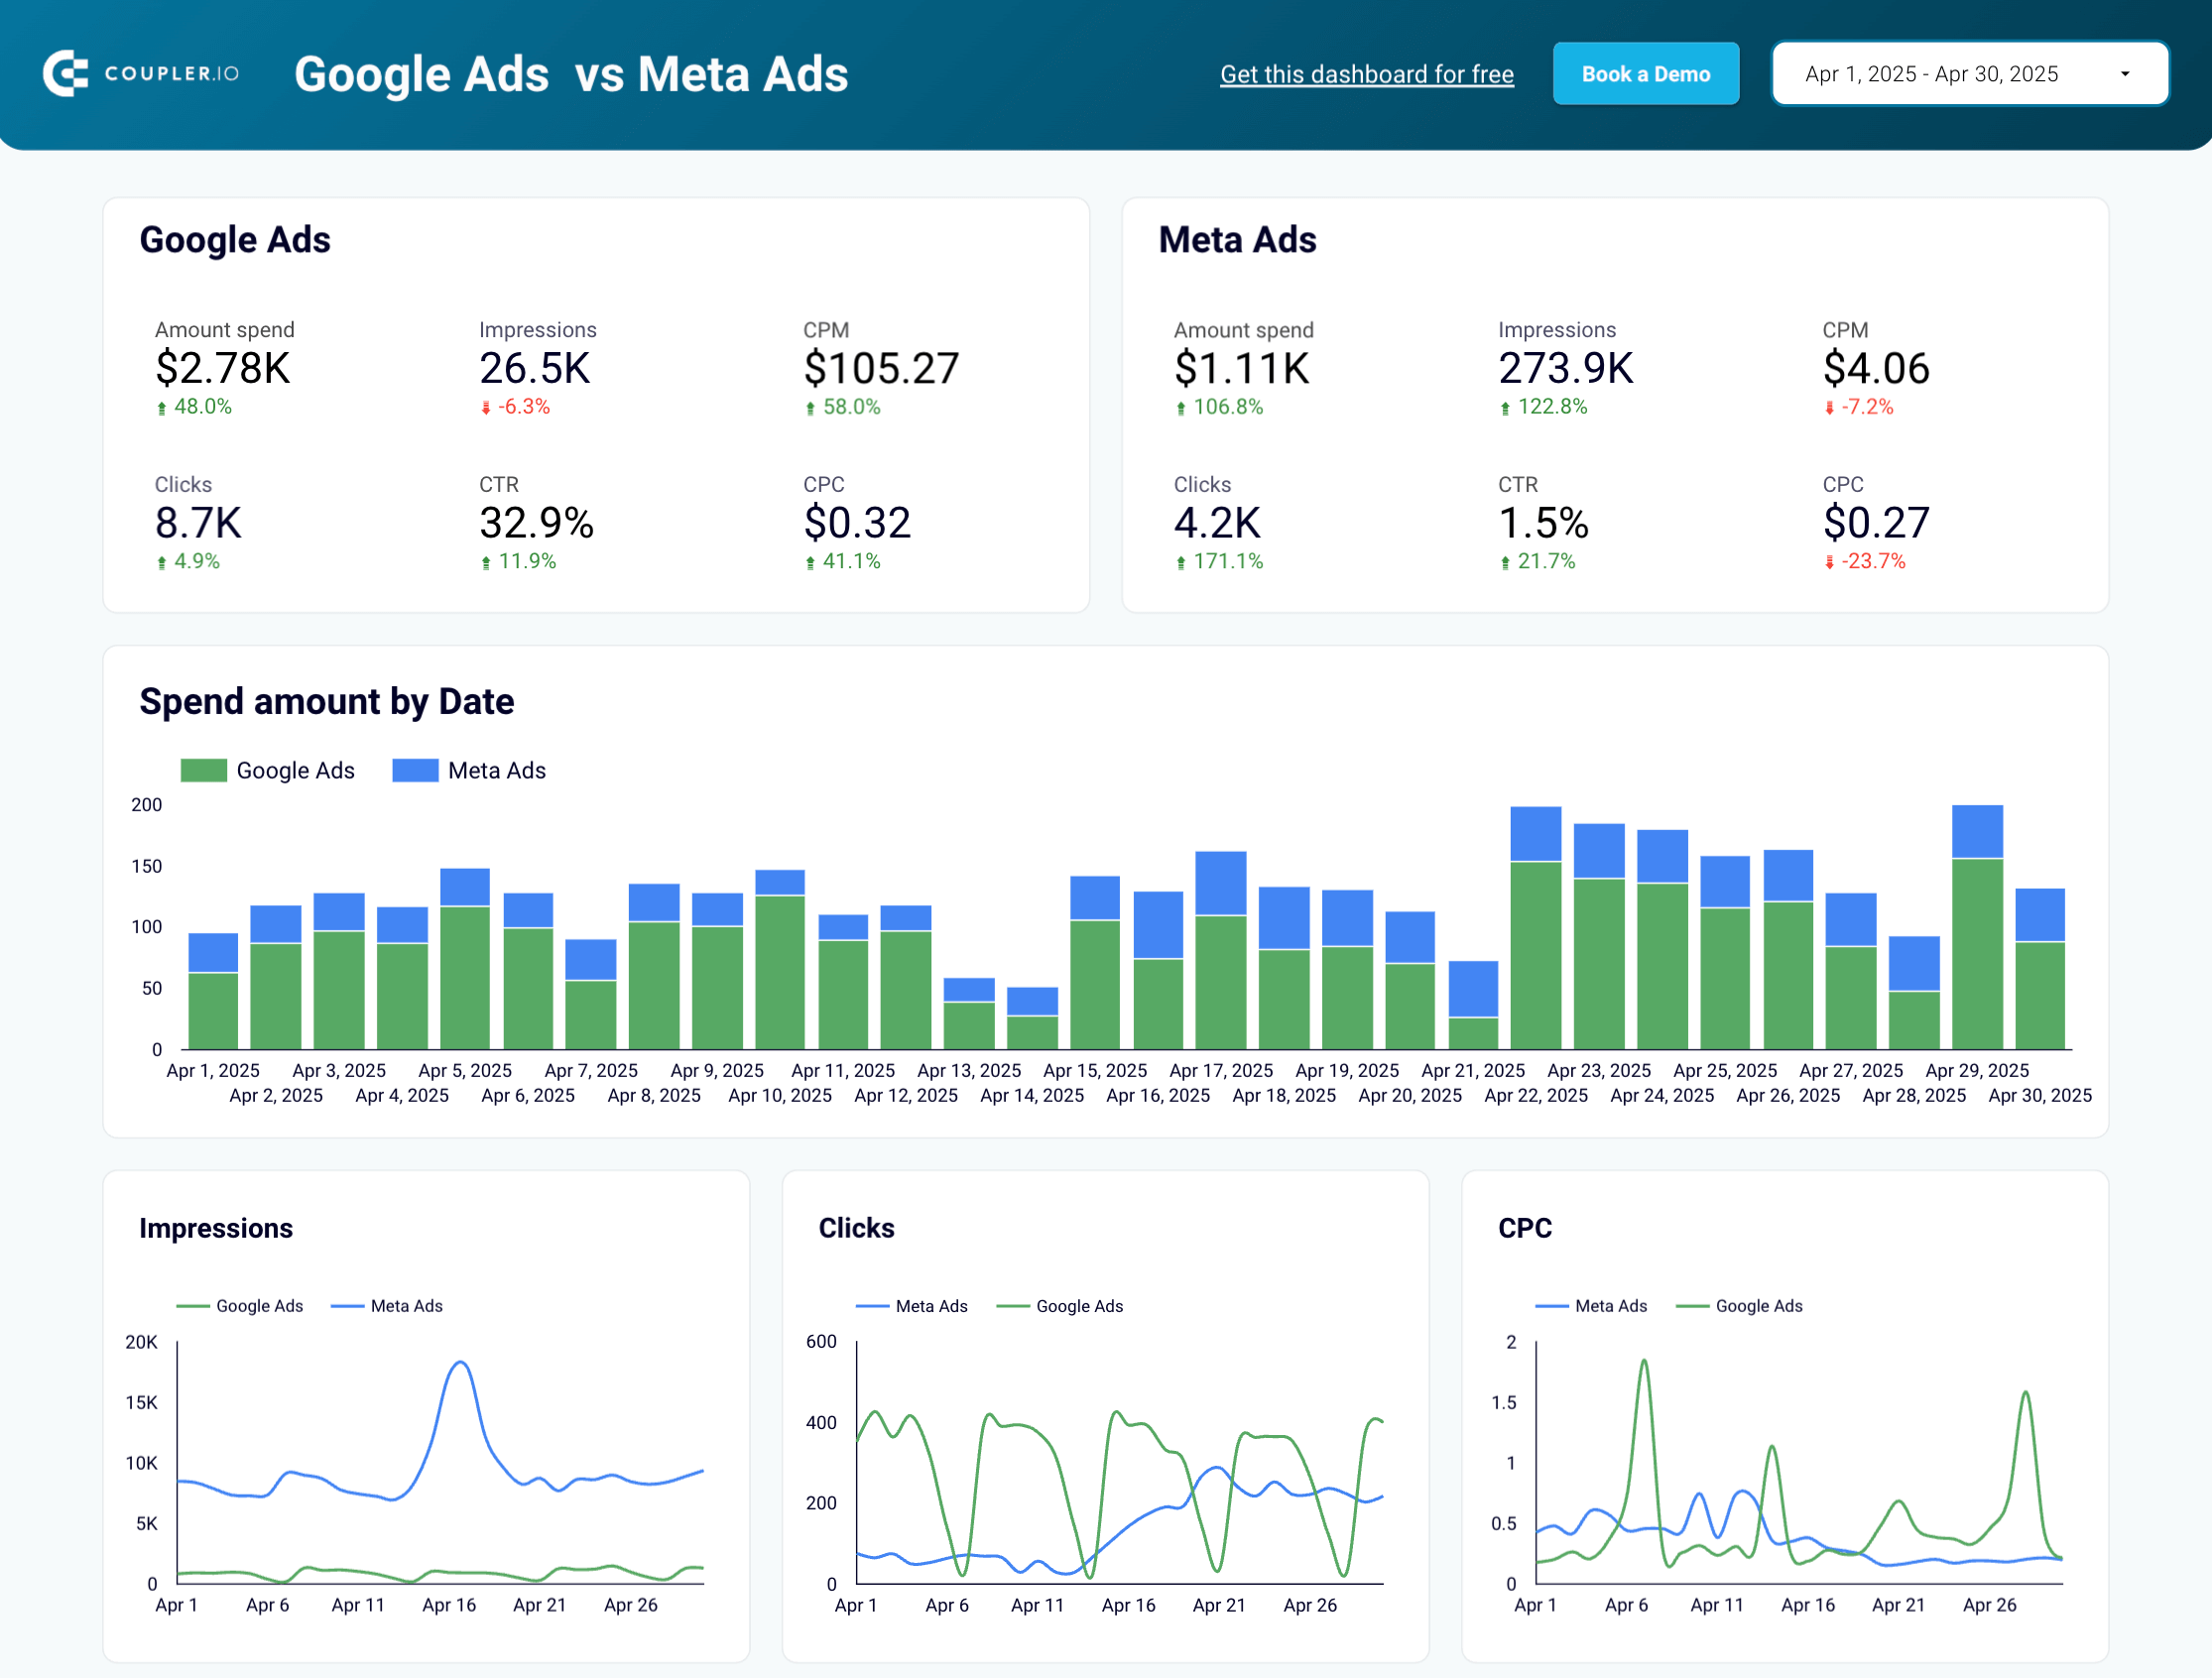
Meta Ads and Google Ads campaign performance dashboard
Preview dashboardThe comparative layout makes it easy to see which platform delivers better CPC, more clicks, or cheaper impressions for the same budget. Daily spend and impression trends are charted for both, along with monthly dynamics for long-term comparisons.
Metrics in the template
- Cross-platform performance comparison
- Daily spend and impression trends
- Campaign-level metrics for both platforms
- Monthly performance dynamics
- CPC and CTR comparative analysis
- Budget allocation insights
Use this if: you specifically want to compare Facebook/Meta Ads against Google Ads (the two biggest ad platforms) side by side.
More Data Studio Facebook Ads templates for PPC analytics
The following 11 templates come from third-party providers. They don’t include Coupler.io’s automated data connections, but each one covers a specific use case worth considering.
#11: Facebook Ads E-Commerce template by DataBloo
DataBloo’s template pulls in Google Analytics data alongside Facebook Ads costs, combining session and conversion metrics in one report. ROAS is calculated as Facebook Ads revenue divided by cost.

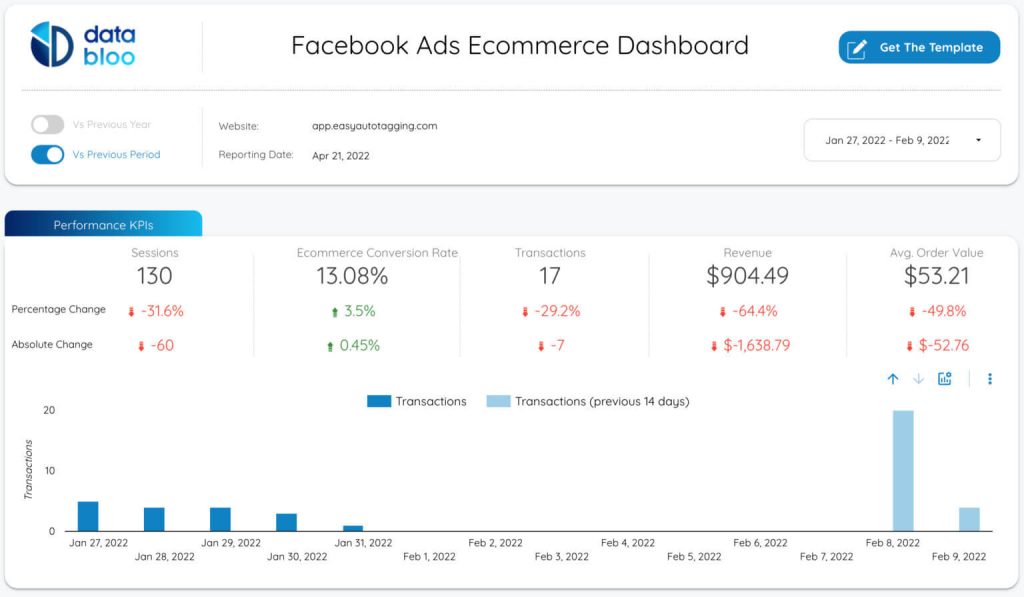
You can see whether your ads perform better in Feed, Stories, or Reels using the placement-level breakdowns. The template also shows cost per conversion and conversion rates, which helps with budget allocation decisions across placements and campaigns.
The template is not free and will cost you €79 to use.
Metrics in the template
- Cost
- Conversion
- E-commerce ROAS (Revenue from Facebook Ads / Cost of Facebook Ads)
- Transactions
- Revenue
- Sessions, etc.
Use this if: you want to combine Facebook Ad cost data with Google Analytics session and conversion data in one report.
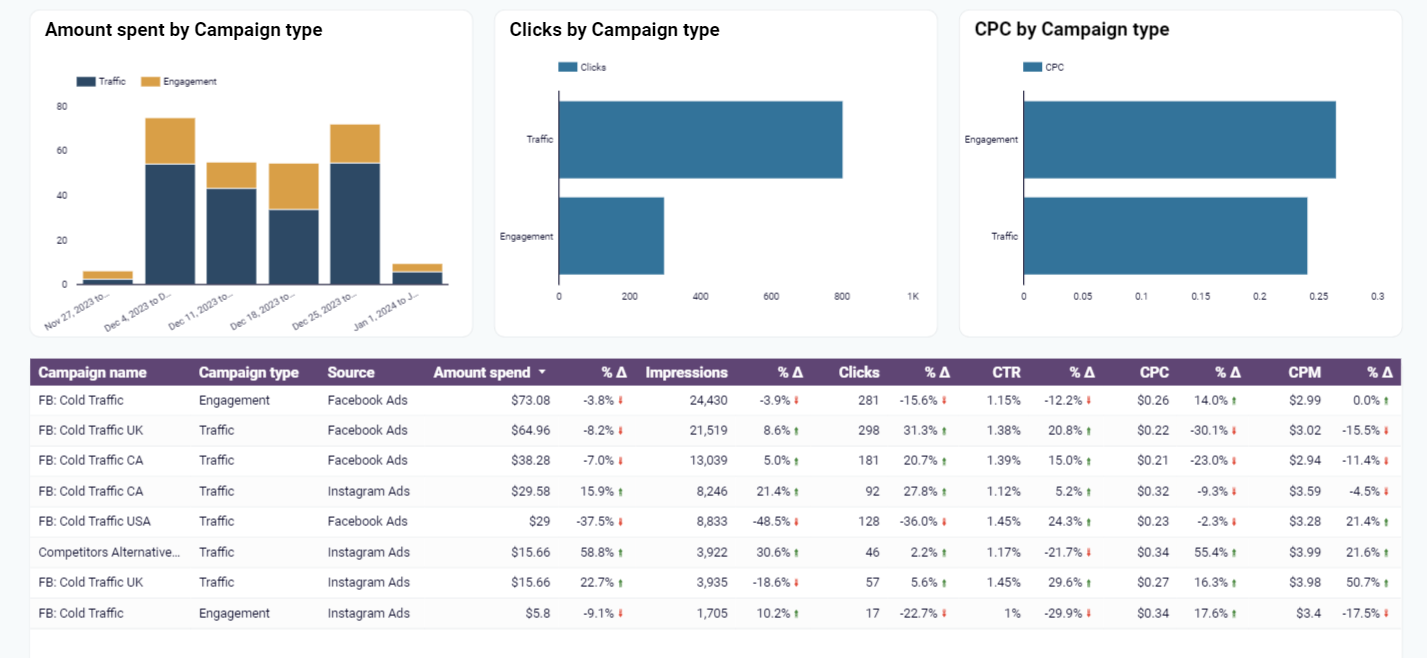
#12: Facebook Ads overall performance by Two-Minute Reports
A dense KPI dashboard that covers amount spent, impressions, conversions, clicks, and cost per conversion. The Ads Performance section drills into individual campaigns and ads with visual representations for side-by-side creative comparison.

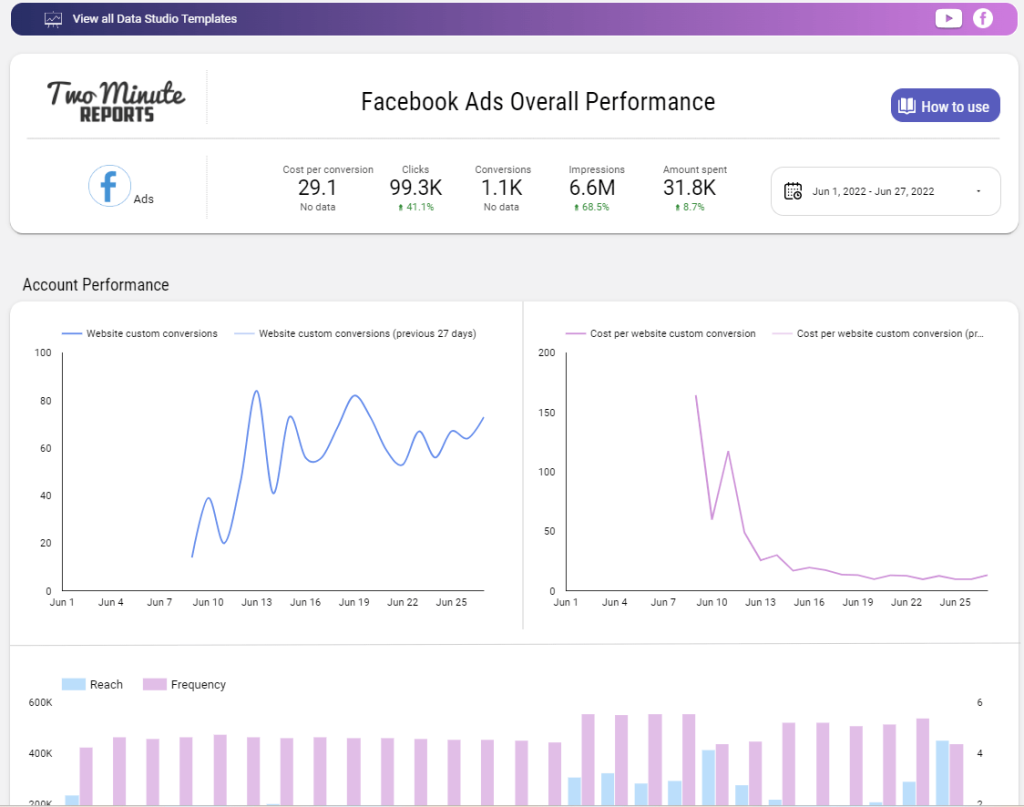
The Reach vs. Frequency bar chart helps you check whether you’re oversaturating your audience with too many impressions. You can also use the Account Performance section to monitor website conversions over time and spot performance shifts across campaigns.
Metrics in the template
- Amount spent
- Impressions
- Conversions
- Clicks
- Cost per conversion, etc.
Use this if: you want a full KPI set with campaign-level drilldowns and reach vs. frequency charts, and you don’t use Coupler.io for data connections.
#13: Google Ads vs. Facebook Ads comparison by Gox.ai
Gox.ai’s template answers one question: where do my clicks come from, and how do they differ between Google Ads and Facebook Ads? Geo charts show click distribution by country for each platform, and a device-split bar graph breaks clicks down by desktop, mobile, and tablet.

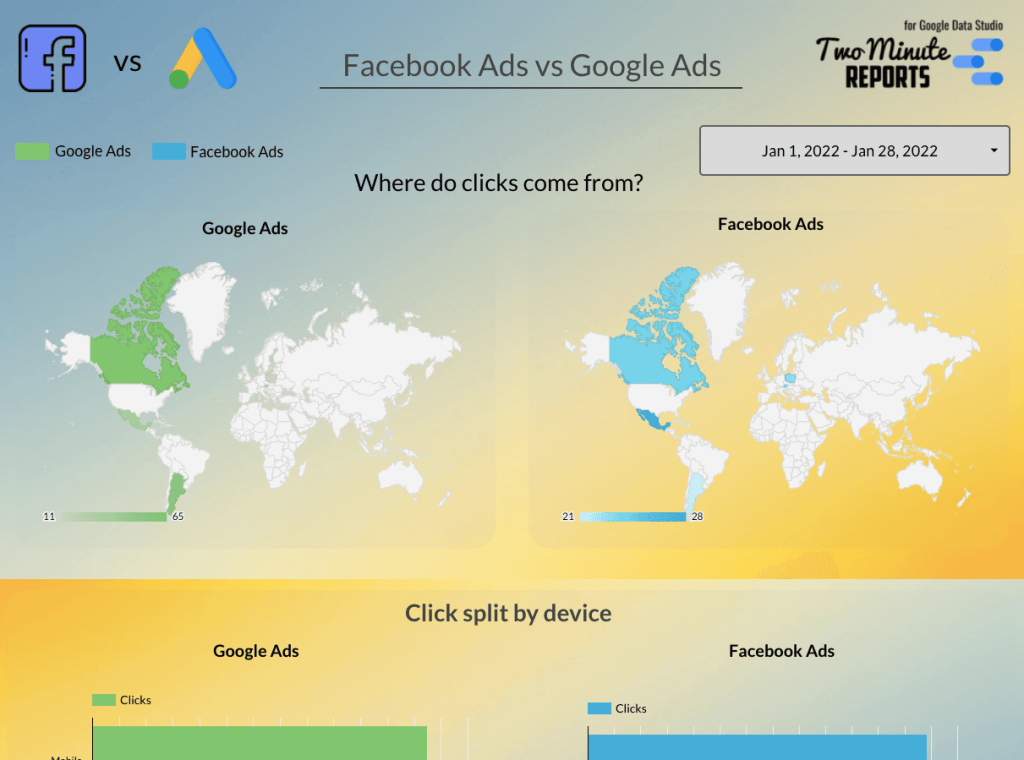
The campaign KPI table lets you compare spend, impressions, link clicks, CTR, conversions, and CPC across both platforms at the campaign level. Conversion ranking scores help you quickly identify which campaigns perform best regardless of platform.
Metrics in the template
- Lead field
- The amounts spent
- Impressions
- Link clicks
- CTR
- Conversions
- CPC
- Conversion ranking scores, etc.
Use this if: you want a head-to-head comparison of Google Ads and Facebook Ads with geo charts and device-level breakdowns.
#14: Facebook Ads reporting template from AnalyticsHelp.io
Unlike most templates that connect to the Facebook Ads API directly, this one works with data stored in a CSV or Google Sheet. You duplicate the report, map your metrics, and the dashboard populates.

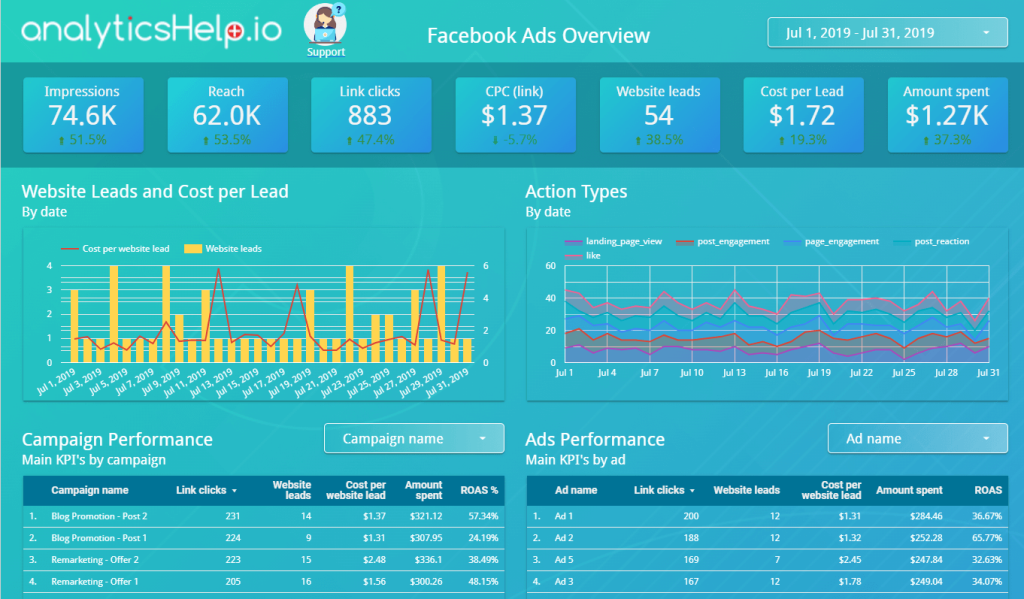
Setup takes roughly 2-3 hours because of the metric mapping process, but the template pulls from multiple data sources. That makes it practical if your data pipeline doesn’t go through a standard connector. It covers campaign KPIs, geographic data, and demographic breakdowns.
Metrics in the template
- Impressions
- CPC (link)
- Website leads
- Cost per Lead
- Amount spent
- Main KPIs by campaign
- Geographic Data
- Demographic & Time Data, etc.
Use this if: your Facebook Ads data lives in a CSV or Google Sheet and you need a template that connects to those rather than the API directly.
#15: Facebook Campaign dashboard by Next Ad
Built for agencies managing multiple client campaigns, this template includes a Funnel Overview tab that tracks cost & impressions, clicks (CTR and CPC), and purchases (revenue and ROAS) in a three-column layout.
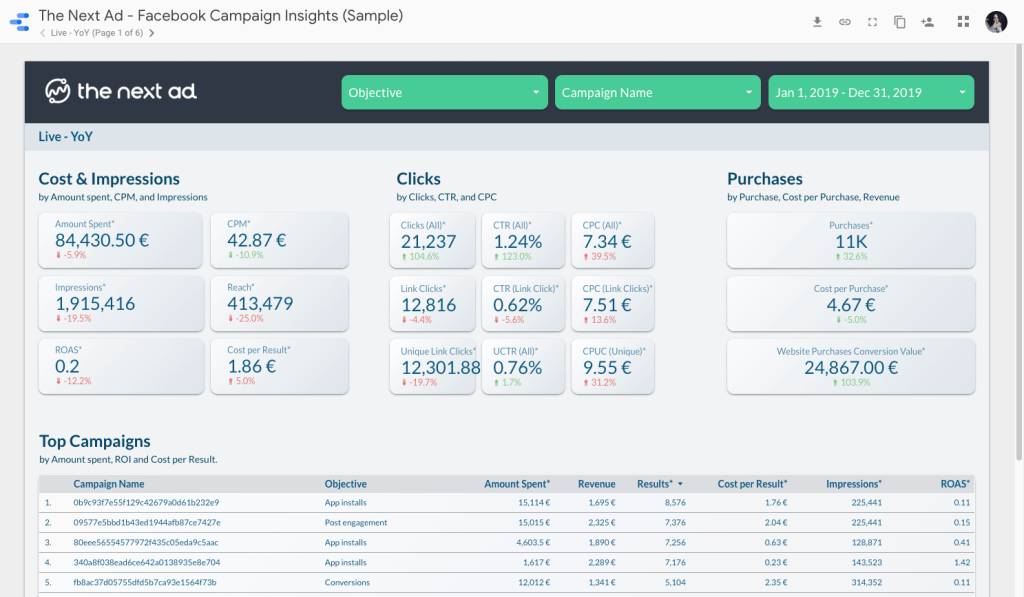
The template is designed for customization. You can adapt it to match each client’s preferred metrics and reporting cadence, which makes it practical for agencies that need to deliver branded or client-specific reports.
Metrics in the template
- CPM
- CTR
- Reach
- Cost per result
- CPUC (cost per unique click)
- ROAS
Use this if: you’re an agency that needs a cross-channel report with a Funnel Overview tab to analyze client campaigns.
#16: Looker Studio Facebook Ads template from Catchr
Catchr’s template gives a clean, straightforward overview of your Facebook Ad campaigns. The Catchr connector in Data Studio also supports Google Ads and Instagram Ads, so you can expand the report to other channels later.

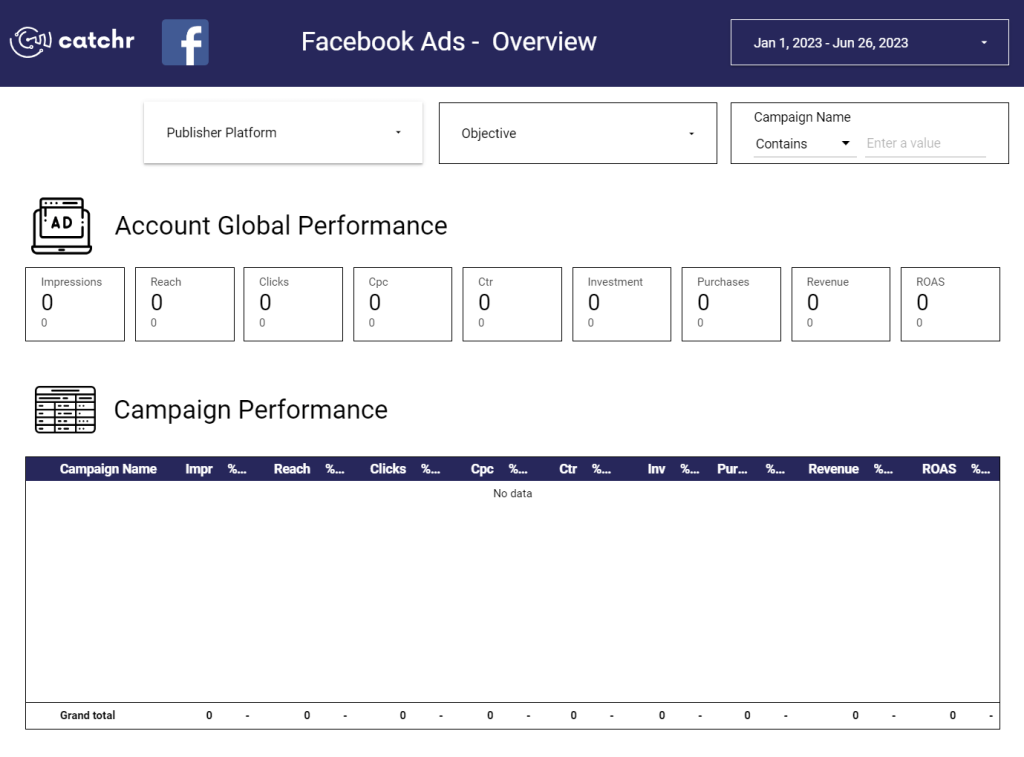
The dashboard helps you compare outbound clicks by country and review campaign-specific metrics in one view. If you already use Catchr as your data connector, setup is minimal.
Metrics in the template
- Spend
- Impressions
- Reach
- Cost per Mille
- Outbound clicks
- Click-through rate
- Adds to cart
- Purchases
- Conversion rate
- Purchases value, etc.
Use this if: you use Catchr as your connector and want a clean overview with outbound clicks by country and campaign-specific metrics.
#17: Facebook Ads e-commerce funnel report by Portermetrics.com
One of the more detailed funnel visualizations on this list, mapping every step from first impression to final purchase. Cost-per-action figures are included at every stage, and data sources come pre-configured, which cuts setup time.

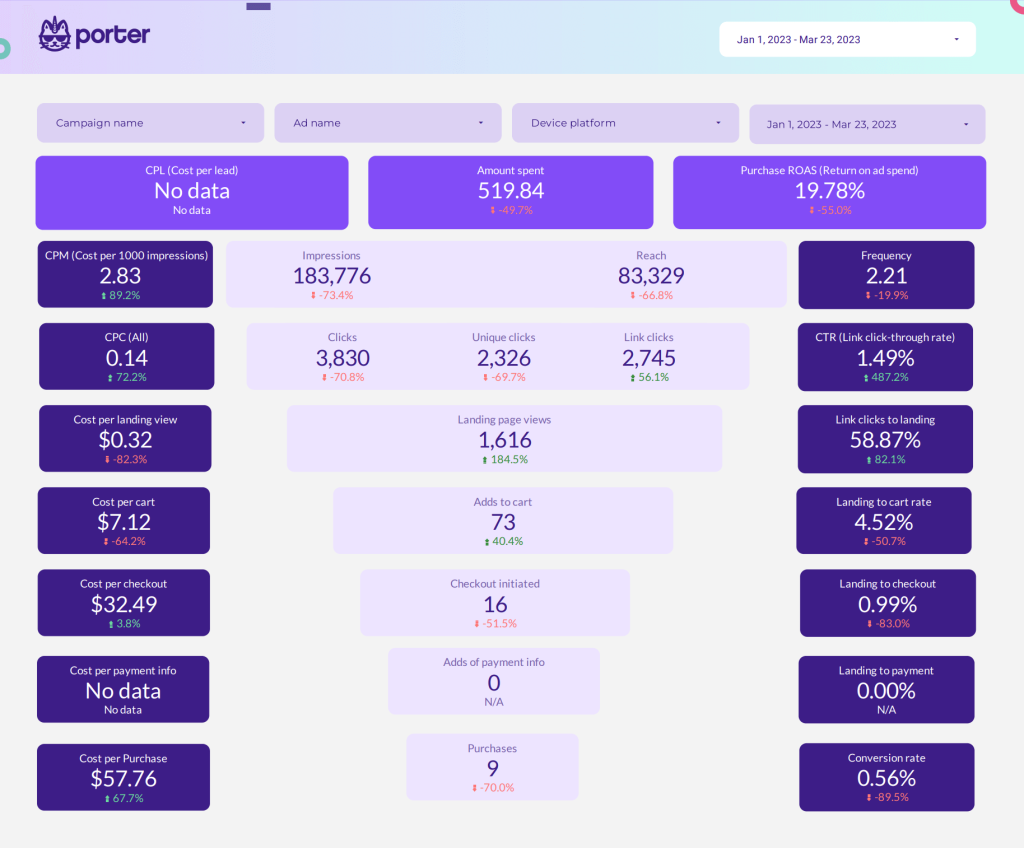
This template for Google Data Studio provides the full-funnel view to pinpoint where the customer journey breaks down, whether that’s at the landing page, the add-to-cart step, or checkout. You can also monitor ad frequency and cost per acquisition to keep spending efficient.
Metrics in the template
- Impressions
- Reach
- CPM
- Frequency
- Clicks
- CTR
- Landing page views
- Add-to-cart actions
- ROAS
- Cost per acquisition, etc.
Use this if: you want a full-funnel visual that maps every step from first impression to final purchase, with cost metrics at each stage.
#18: Multi-channel attribution dashboard by Windsor.ai
Windsor.ai’s template goes beyond raw clicks and spend by showing how each ad channel contributes to conversions. It pulls top-level data from Google Ads, Facebook Ads, LinkedIn Ads, and Bing Ads with an attribution-focused layout.

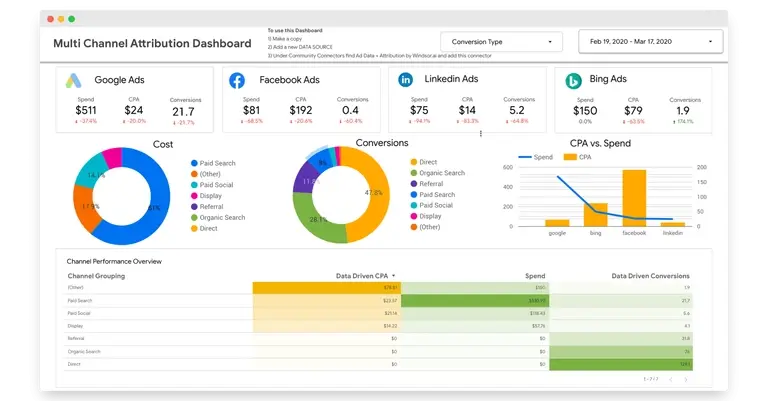
The dashboard helps you understand how Facebook fits into your broader marketing mix, not just how Facebook performs in isolation. The layout is clean enough for non-technical stakeholders, and you can add data sources beyond the default ones.
Metrics in the template
- Amount spent (Google, Fb, Bing, LinkedIn Ads)
- Goal completions (Conversions)
- Channel performance overview, etc.
Use this if: you need attribution data across paid and organic channels, not just Facebook Ads metrics but how Facebook fits into your broader marketing mix.
#19: Facebook Ads template for Looker Studio by Avian
Avian’s report splits campaign performance into separate tabs (Overview, Campaigns, Demographics, and Trends) instead of cramming everything onto one page. It also supports multiple ad accounts, which makes it practical for agencies managing different brands or regions.

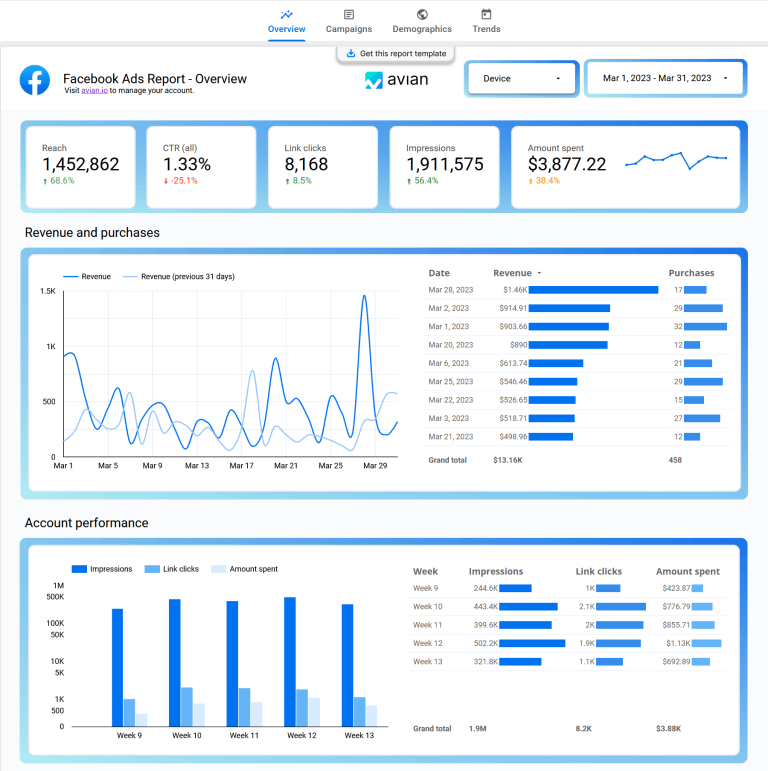
You can view long-term performance trends, segment by device, country, and age range, and aggregate results across all your accounts in one place. The template is free to access, but connecting to data sources requires a monthly subscription at $29/month.
Metrics in the template
- Reach
- CTR
- Clicks
- Impressions
- Amount spent
- Campaign performance, etc.
Use this if: you manage multiple ad accounts and need to aggregate results across all of them in one report.
#20: Facebook Ads Data Studio template by OnePPC
OnePPC built this template specifically for Facebook Lead Ads. The report uses a navigation-based layout with a left menu for switching between Overview, Campaigns, and Ad Sets views, plus a filtering bar for campaign name, objective, ad placement, age, and gender.

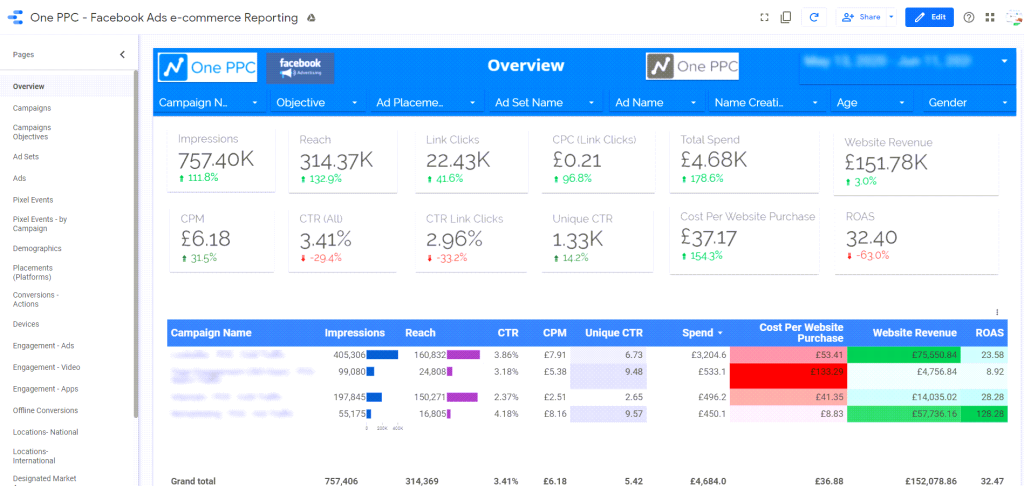
The filtering options make it easy to narrow down to specific audience segments or campaign types. The Overview section shows key stats using scorecards, and the table can be resized and rearranged to fit your preferred layout.
Metrics in the template
- Campaign objectives
- Conversions
- Spend
- Revenue
- ROAS
- Lead Ads.
Use this if: you run Facebook Lead Ads specifically and want a template built for lead gen and e-commerce reporting from that angle.
#21: Facebook Ads vs. Google Ads vs. LinkedIn Ads by Two-Minute Reports
A scorecard-style comparison for businesses running ads across Facebook, Google, and LinkedIn simultaneously. Each platform’s metrics sit in one row, making it easy to scan horizontally and spot the best performer.

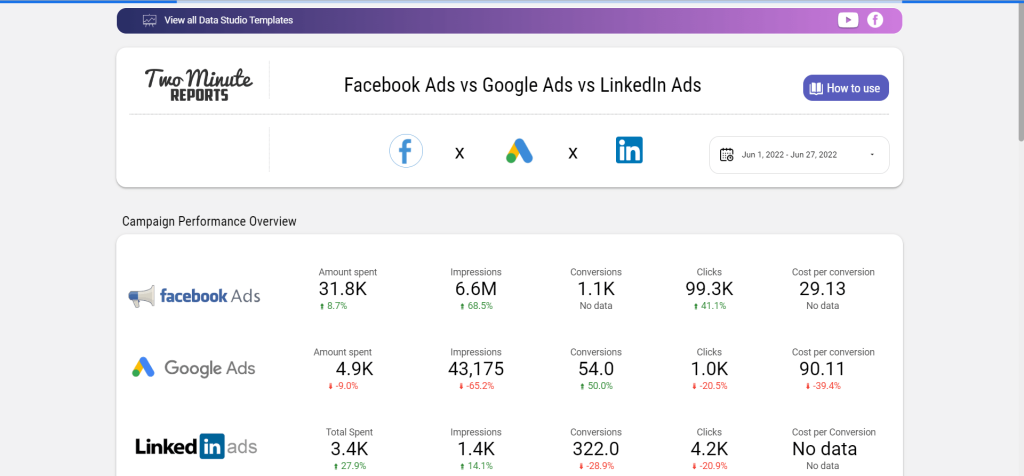
An impressions graph shows trends over time, and a geo chart maps clicks by country. The scorecard format is useful for quick cross-platform reporting without digging into separate dashboards for each channel.
Metrics in the template
- Amount spent
- Impressions
- Conversions
- Clicks
- Cost per conversion, etc.
Use this if: you advertise across all three major B2B and B2C platforms and want a single scorecard-style comparison.
How Looker Studio Facebook Ads templates help advertisers
A Facebook Ads reporting template is a tool for tracking ad performance and user actions. It shows customer behavior like Facebook page visits, cart additions, and actions taken after viewing ads, which matters for retargeting decisions.
Compared to native Facebook analytics, a Looker Studio reporting template gives you one centralized dashboard for all your Facebook Ads data. It goes beyond the built-in analytics by letting you combine data sources, customize layouts, and share interactive reports with your team.

Data Studio is a strong choice for Facebook Ads templates because it’s free, handles large datasets well, and integrates with dozens of data sources. Exporting data from Facebook Ads to Looker Studio gives you a full picture of your campaigns. That makes it easier to optimize your ad strategy.
How to choose the best Facebook Ads template in Looker Studio
There are templates from providers like Porter Metrics, Coupler.io, and Avian. They work with Facebook Ads and other social media platforms. Setting up a report is straightforward: pick the template, connect your data source, and customize the layout.
Service providers offer templates in various types, from free to paid, with different levels of detail. Some give a general overview, others go deep on specific metrics.
Here are the main factors to consider when picking a template:
- Metrics. Look for reports that track the metrics most relevant to your goals. If you care about ROAS, don’t pick a template that only shows clicks and impressions.
- Integrability. Check for built-in connectors to smoothly integrate the template with Facebook Ads.
- Visual appearance. Consider the layout options and chart types included in the template.
- Actionability. Pick templates where you can quickly find the information you need. A template that highlights problem areas is more useful than one that just presents raw numbers.
- Customizability. Check whether you can add or remove metrics, change date ranges, and rearrange sections.
- Accessibility. Decide between paid and free templates. Some providers don’t have trials, and pricing plans may include monthly subscriptions.
- Interactivity. Check for filters, date pickers, and drill-down options.
- Scalability. Check whether you can add multiple Facebook Ads accounts or scale the report with other advertising platforms.
- Usability. Pick Facebook Ads reports that are easy to navigate and quick to set up.
Get peace of mind for reporting with a Facebook Ads Looker Studio template
Google Looker Studio is a solid tool for Facebook Ads reporting. You can connect your Facebook Ads using free or paid connectors. With the templates above, you’re a few clicks away from a working dashboard.
Not sure which template to start with? Pick #1 (Coupler.io’s Facebook Ads dashboard) for a general overview. Go with #3 if you sell products and care about ROAS, or #4 if you run ads across multiple platforms. All three are free, connect automatically through Coupler.io, and refresh on a schedule you control.
Track your campaign KPIs: audience reach, product sales, and core performance metrics. That’s how you make faster decisions about where to spend and what to cut.


Automate data export with Coupler.io
Get started for free