Marketing ROI in 2026 is becoming harder to measure due to new AI channels and campaign types. The benchmarks still matter, but teams are focusing more on brand investments to build long-term trust than on immediate returns.
The important benchmarks in 2026 will be ROI driven by brand-building metrics with coherent, cross-channel ideas 2.5x more important to campaign success than a decade ago.
This article rounds up the marketing ROI benchmarks worth knowing for 2026, by company size, channel, and by trend. You can find used sources at the end of this compilation.
Top marketing ROI statistics for 2026
If you only read one section, these are the initiatives and marketing performance metrics benchmarks in 2026:
- Only 33% of enterprises set KPI targets for marketing ROI, even though marketing now sits under CFO-level scrutiny, according to Deloitte’s 2026 Digital Marketing Trends report.
- Average short-term profit ROI is £1.87 per £1. Measuring the sustained effects and the same spend returns £4.11 per £1, based on Google and WARC’s Effectiveness Equation work.
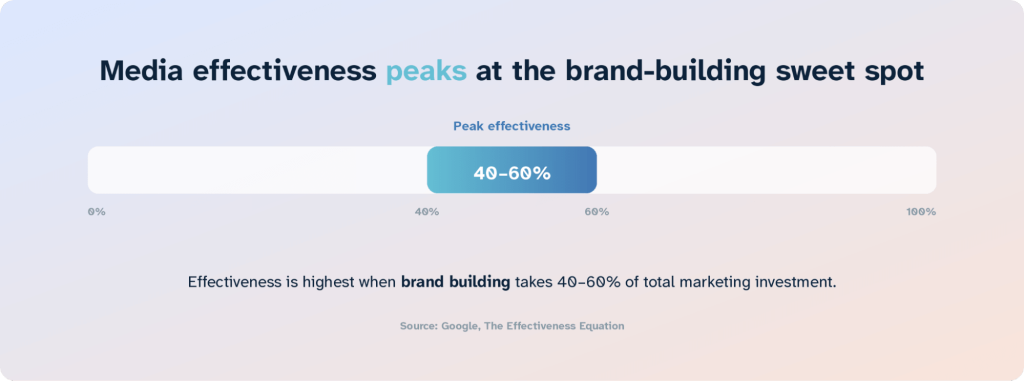
- Media effectiveness peaks when brand building takes 40% to 60% of total marketing investment. One European retailer that pivoted hard to performance lost 44% of its ROI in two quarters, per Google’s Effectiveness Equation data.
- 85% of marketers say they’re confident they can measure holistic ROI. Nielsen’s 2025 Marketing ROI Blueprint found only 32% actually do it.
- Just 41% of marketers can demonstrate ROI on their AI investments in 2026, down from 49% a year earlier, per Benchmarkit’s State of AI in Marketing 2026.
- When marketers can prove AI ROI, the returns hold up. 60% report at least 2x returns, rising to 79% at enterprises above $10B in revenue, per Benchmarkit.
- 64% of CMOs say proving marketing’s value to the business is their single biggest challenge, and budgets are now treated as investment portfolios under CFO-level scrutiny, per Deloitte.
- No single channel owns ROI anymore. LinkedIn‘s 121% ROAS is the only major B2B paid social return above breakeven, while marketers name website, blog, and SEO their #1 ROI channel overall, per Dreamdata and HubSpot.
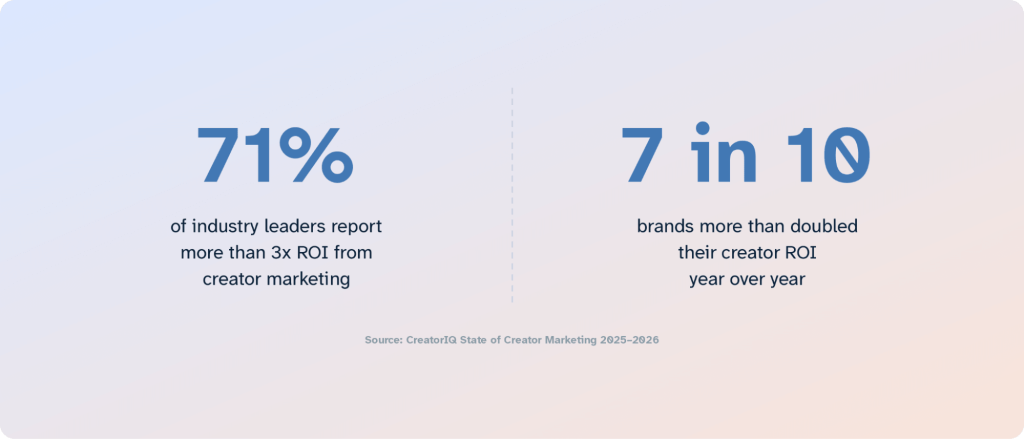
- 71% of industry leaders say creator marketing delivered more than 3x ROI last year, according to CreatorIQ.
- Companies that put more into marketing technology than into working media see an 18% bigger sales lift and 7% more revenue growth, Deloitte found.

Sources:
- https://www.deloittedigital.com/content/dam/digital/nl/pdfs/2026/deloitte-nl-deloitte-digital-marketing-trends-2026.pdf
- https://services.google.com/fh/files/misc/google_report_the_effectiveness_equation.pdf
- https://s3.amazonaws.com/media.mediapost.com/uploads/NIELSEN_roi-report-2025-english.pdf
- https://www.benchmarkit.ai/widget/state-of-ai-in-marketing-26/cy-26
- https://dreamdata.io/linkedin-ads-b2b-benchmarks
- https://blog.hubspot.com/marketing/hubspot-blog-marketing-industry-trends-report
- https://www.creatoriq.com/hubfs/2025-26%20State%20of%20Creator%20Marketing/CreatorIQ-StateofCreatorMarketing2025-2026.pdf
Pro tip
Most of these benchmarks are harder to act on than they look, because the data behind them lives in separate platforms. Pulling ROI figures from Google Ads, Meta, your CRM, and other marketing analytics tools into one view is still a manual job for most teams. Coupler.io collects data from Google Ads, Meta, HubSpot, GA4, and 400+ other sources into a single marketing dashboard, so you can compare channel ROI in one place instead of stitching exports together.
Marketing ROI benchmarks
- Before we get into channels, here’s the cross-channel picture. A 1% lift in brand awareness drives a 0.6% long-term and 0.4% short-term sales lift, based on a Nielsen study for Google.
- Retail media networks deliver 1.8x better results than digital ads, and nearly 3x better for purchase intent, according to Kantar.
- 81% of the B2B buying journey now happens before a lead reaches the sales pipeline, up from 70% a year ago, in Dreamdata’s 2026 data.
- Across marketing, short-term profit ROI averages £1.87 per £1 and rises to £4.11 per £1 once sustained effects are counted. That’s the cleanest cross-channel read on what “good” looks like, from Google and WARC.
- For B2B paid channels, 2025 ROAS lands at LinkedIn 121%, Google Search 67%, and Meta 51%. Among top performers, LinkedIn reaches 279%, per Dreamdata.
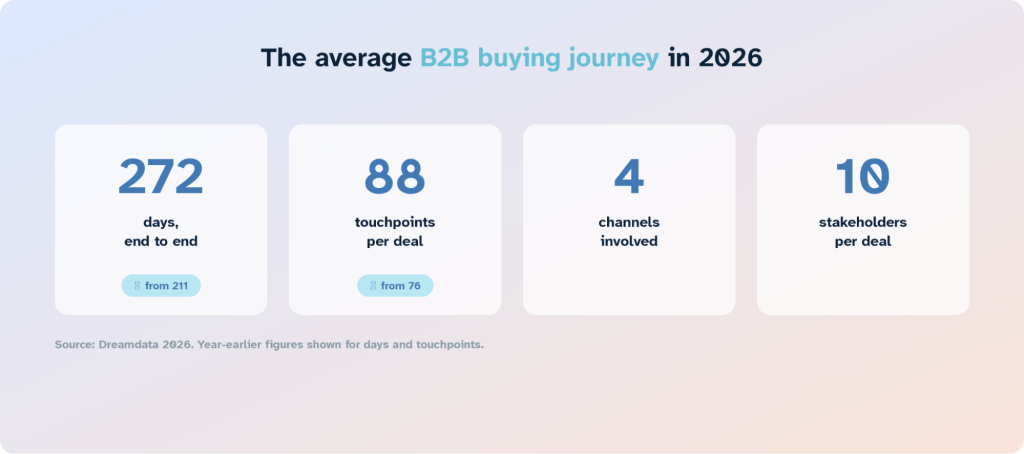
- The average B2B journey runs 272 days and 88 touchpoints across four channels, with 10 stakeholders per deal. A year earlier it was 211 days and 76 touchpoints.
Two things stand out: full measurement uncovers far more ROI than short-term attribution shows due to the extended buying journey.

Marketing ROI by company size
Blended marketing ROI isn’t reported cleanly by industry vertical. The cut the data does support is company size, and the pattern there is consistent: smaller brands spend to build awareness, larger brands spend to defend efficiency.
Media reinvestment by company size
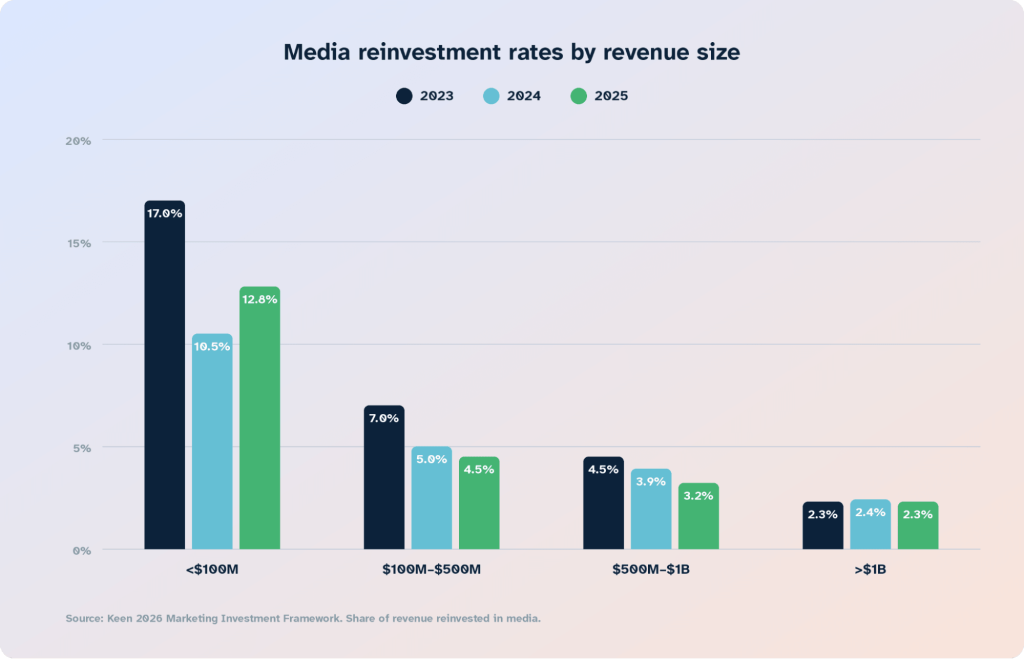
Reinvestment rate is the share of revenue a brand puts back into media, and it’s per company size.
- Smaller brands (<$100M) maintained the highest Media reinvestment at 12.8%, using Media to build awareness.
- Mid-market brands ($100M to $500M) reduced Media to 4.5% as they began accessing more Trade leverage.
| Annual revenue | 2025 media reinvestment rate | 2024 media reinvestment rate | 2023 media reinvestment rate |
| Under $100M | 12.8% | 10.5% | 17% |
| $100M to $500M | 4.5% | 5% | 7% |
| $500M to $1B | 3.2% | 3.9% | 4.5% |
| Over $1B | 2.3% | 2.4% | 2.3% |
- Across every size band, media reinvestment slipped to 2.5% of revenue in 2025 from 2.8%, yet modeled media ROI still climbed from 1.8 to 1.9 per $1. Sharper allocation, not bigger budgets, drove the gain.

Funnel budget allocation by company size
- Enterprise brands ($500M+ in revenue) put 52% to 64% of budget into top-of-funnel brand building. Mid-market brands run a near-even top and bottom split.
- Larger brands ($100M+) moved from 43% to 58% top-of-funnel allocation between 2022 and 2025, which indicates a shift toward demand creation.
This pattern is visible across the data; the smaller and earlier-stage the brand, the harder it leans on media to build awareness it doesn’t have yet. Larger brands, with awareness established, shift toward conversion efficiency and protect their return on investment with better budget allocation instead of an increase in spend.
Marketing ROI by channel in 2026
Each marketing channel below pairs its ROI benchmark with what’s actually driving that return in 2026.
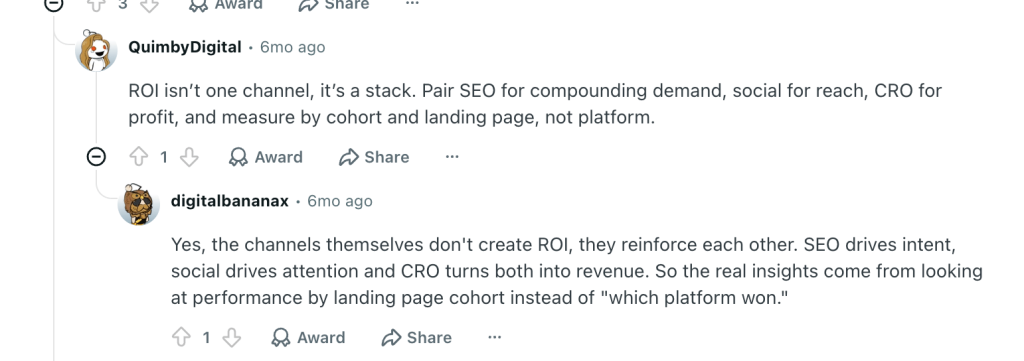
ROI isn’t one channel, it’s a stack. Pair SEO for compounding demand, social for reach, CRO for profit, and measure by cohort and landing page, not platform.

Channel ROI at a glance: a media-mix view
Here’s the wide-angle view from marketing-mix modeling. Keen’s 2026 Marketing Investment Framework measures channel ROI as incremental return per dollar of media spend. These are modeled multiples, not the percentage ROI and ROAS, so read them as a directional comparison of media channels rather than a like-for-like ranking when informing your marketing strategy.
| Media channel | 2025 investment share | Modeled ROI per $1 |
| Search | 25% | About $1.70 |
| Linear TV | 19% | Declined in 2025 |
| Streaming video | 17% | About $1.90 to $2.00 |
| Social | 17% | Increasing YoY |
| Display | 15% | About $2.00 |
| Audio | Small share | About $2.50 |
- Search decreased from 65% to 60% of bottom-of-funnel investment in 2025 as Display increased from 18% to 27%, and Social moved out of bottom-funnel conversion toward top-funnel awareness.
PPC ROI statistics
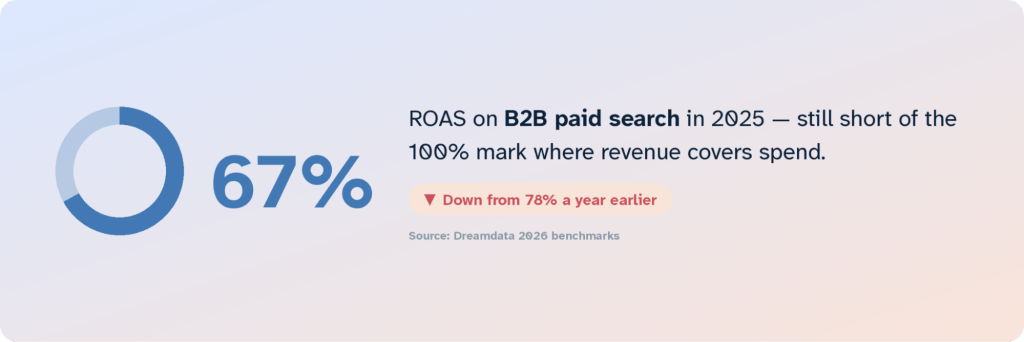
- For B2B, paid search returned a 67% ROAS in 2025, down from 78% a year earlier and still short of the 1:1 mark where revenue covers spend, in Dreamdata’s benchmarks.
- Average paid search performance in 2026 sits at a 6.64% CTR, $5.42 CPC, 8.18% conversion rate, and $66.69 cost per lead, blended across Google and Microsoft Ads, in WordStream by LocaliQ’s benchmarks.
- 89% of global digital ad spend in 2025 flowed to just three platforms: Google, Meta, and Amazon, according to The State of PPC 2026.
- 53% of PPC practitioners say managing campaigns is harder than two years ago, blaming black-box campaign tech and signal loss from privacy changes. Only 16% say it’s easier.
B2B paid-channel ROAS varies a lot by platform, and the spread between average and top performers is wide. The table below is from Dreamdata’s 2026 LinkedIn Ads Benchmarks Report, built on 66 million sessions across millions of B2B customer journeys.
| Platform | 2025 ROAS (all advertisers) | 2025 ROAS (top performers) |
| LinkedIn Ads | 121% | 279% |
| Google Search Ads | 67% | 138% |
| Meta Ads | 51% | 133% |

Speed is PPC’s structural advantage: it plugs short-term revenue gaps faster than channels that need months to compound. The catch is that returns only last as long as you keep paying.
AI ad placements
A new placement channel opened up in 2025: sponsored results inside AI assistants. It’s early, and it behaves more like brand advertising than direct response.
- 460 million people discover products inside AI assistants every month, and ChatGPT is growing 39% year over year, per Similarweb.
- The AI ad landscape spans three platforms: ChatGPT (around 1,000 brands, sponsored links in chat, $50K minimum entry), Google AI Mode (thousands of brands), and AI Overview (100,000+ brands, product cards from existing Shopping feeds).
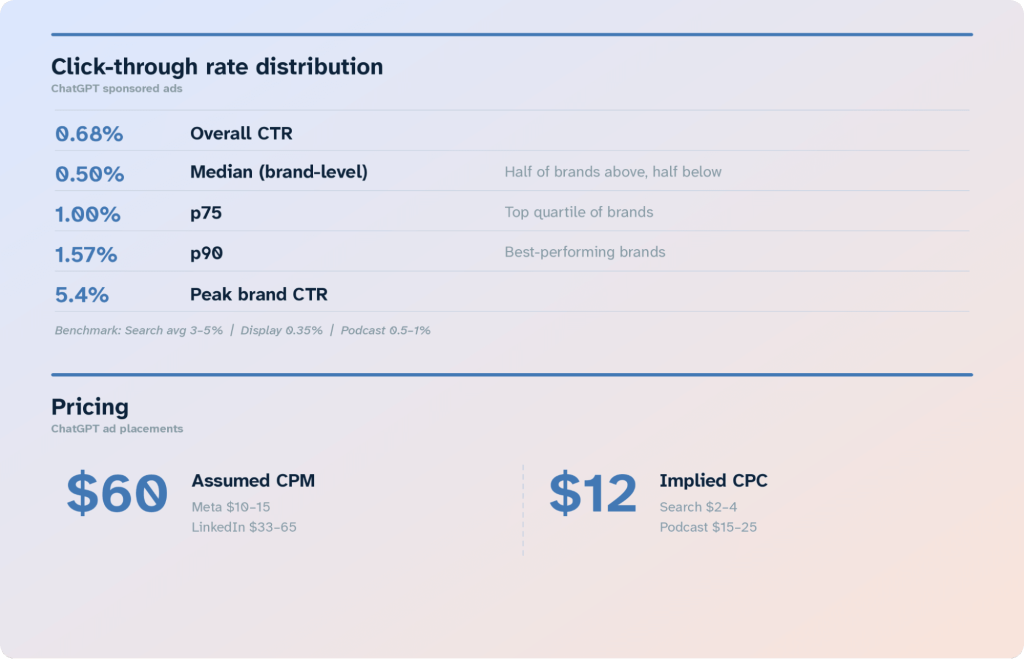
- ChatGPT assumed CPM is $60 (compared to $10-$15 for Meta or $33-$65 for LinkedIn, according to SimilarWeb report.
- ChatGPT ad click-through rate is 0.68% overall and 0.50% at the median brand, rising to 1.57% for the best performers. Paid search runs 3% to 5% by comparison.
- 83% of ChatGPT ad-triggering queries would never have triggered a Google Shopping ad, and only 2% of ChatGPT ad headlines say “buy now”. These are research moments, not direct response.
Paid social ROI
- LinkedIn is the only major B2B paid social platform above breakeven, at a 121% ROAS, where Meta sits at 51%, per Dreamdata. These are B2B figures; B2C campaigns, especially on Meta, typically clear a far higher return.
- LinkedIn now takes 41% of B2B paid social budget share and is the single largest individual ad-spend line item among Dreamdata customers.
- At small-business level, Facebook Lead Ads average $27.66 cost per lead against $70.11 for Google Ads, a roughly 2.5x cost advantage, per LocaliQ.
- 75% of Dreamdata customers running LinkedIn Ads have integrated the LinkedIn Conversions API, which LinkedIn says cuts cost per action 20% and lifts attributed conversions 31%.
- 87% of marketing leaders plan to increase paid social spend in 2026, and a net 38% plan to put more into retail media networks, per Sprout Social and Kantar.
LinkedIn dominates B2B paid social on lead quality, even with higher absolute costs per lead.
SEO ROI statistics
- Website, blog, and SEO is the #1 ROI-driving channel overall in 2026, cited by 27% of marketers in HubSpot’s report.Most SEO campaigns don’t see real returns until four to six months in, with a full payback window of one to three years.
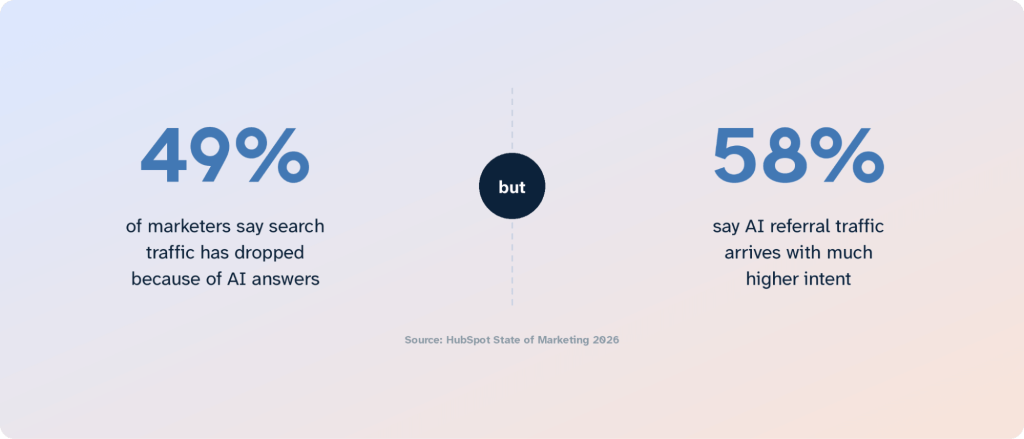
- 49% of marketers say search traffic has dropped because of AI answers, but 58% say AI referral traffic arrives with much higher intent, per HubSpot.
- Around 60% of AI Overview citations come from URLs not ranking in the top 20 organic results, which decouples ranking position from AI-answer visibility, according to AirOps.
- Google searches ending without a click have risen 2.5x since AI Overviews rolled out, per Kevin Indig’s analysis in the AirOps report.
- Pages not refreshed quarterly are over 3x more likely to lose AI citations, and more than 70% of AI-cited pages were updated within the past year.
SEO ROI still compounds over multi-year horizons, but AI referrals convert at much higher intent. Lead quality from organic search engines is still higher than most paid channels.

Social media marketing ROI statistics
- Marketing leaders say social drives full-funnel value: awareness 67%, customer acquisition 60%, customer loyalty 58%, and revenue 56%, per Sprout Social.
- Only 44% of marketing leaders rate their social team as expert-level at measuring social’s business impact.
- The highest-ROI social platforms in 2026 are Instagram 48%, Facebook 43%, and YouTube 42%, then TikTok 32% and X 31%, in HubSpot’s ranking. Facebook fell from 54%; TikTok rose from 19%.
- Brands using knowledge-sharing micro-community platforms in China saw 25% higher marketing ROI, and nearly 40% of consumers trust micro-community recommendations as much as personal ones, according to Kantar.
- About 48% of AI search citations come from user-generated and community sources like Reddit, LinkedIn, YouTube, and Wikipedia, per AirOps.
- Around 85% of brand mentions in AI answers come from external third-party domains rather than owned pages, making social media marketing a high performing channel.
Social ROI is shifting from mass reach to micro-communities and credible creators. Brands win by showing up with real value rather than promotion. Algorithmic feeds reward generic, sales-heavy content, so organic reach for branded pages keeps sliding.
Pro tip
Over half of marketing leaders say their social tools don’t talk to the rest of their stack, and that’s the top reason they can’t tie social to business impact. Accurate benchmarking requires centralized data.
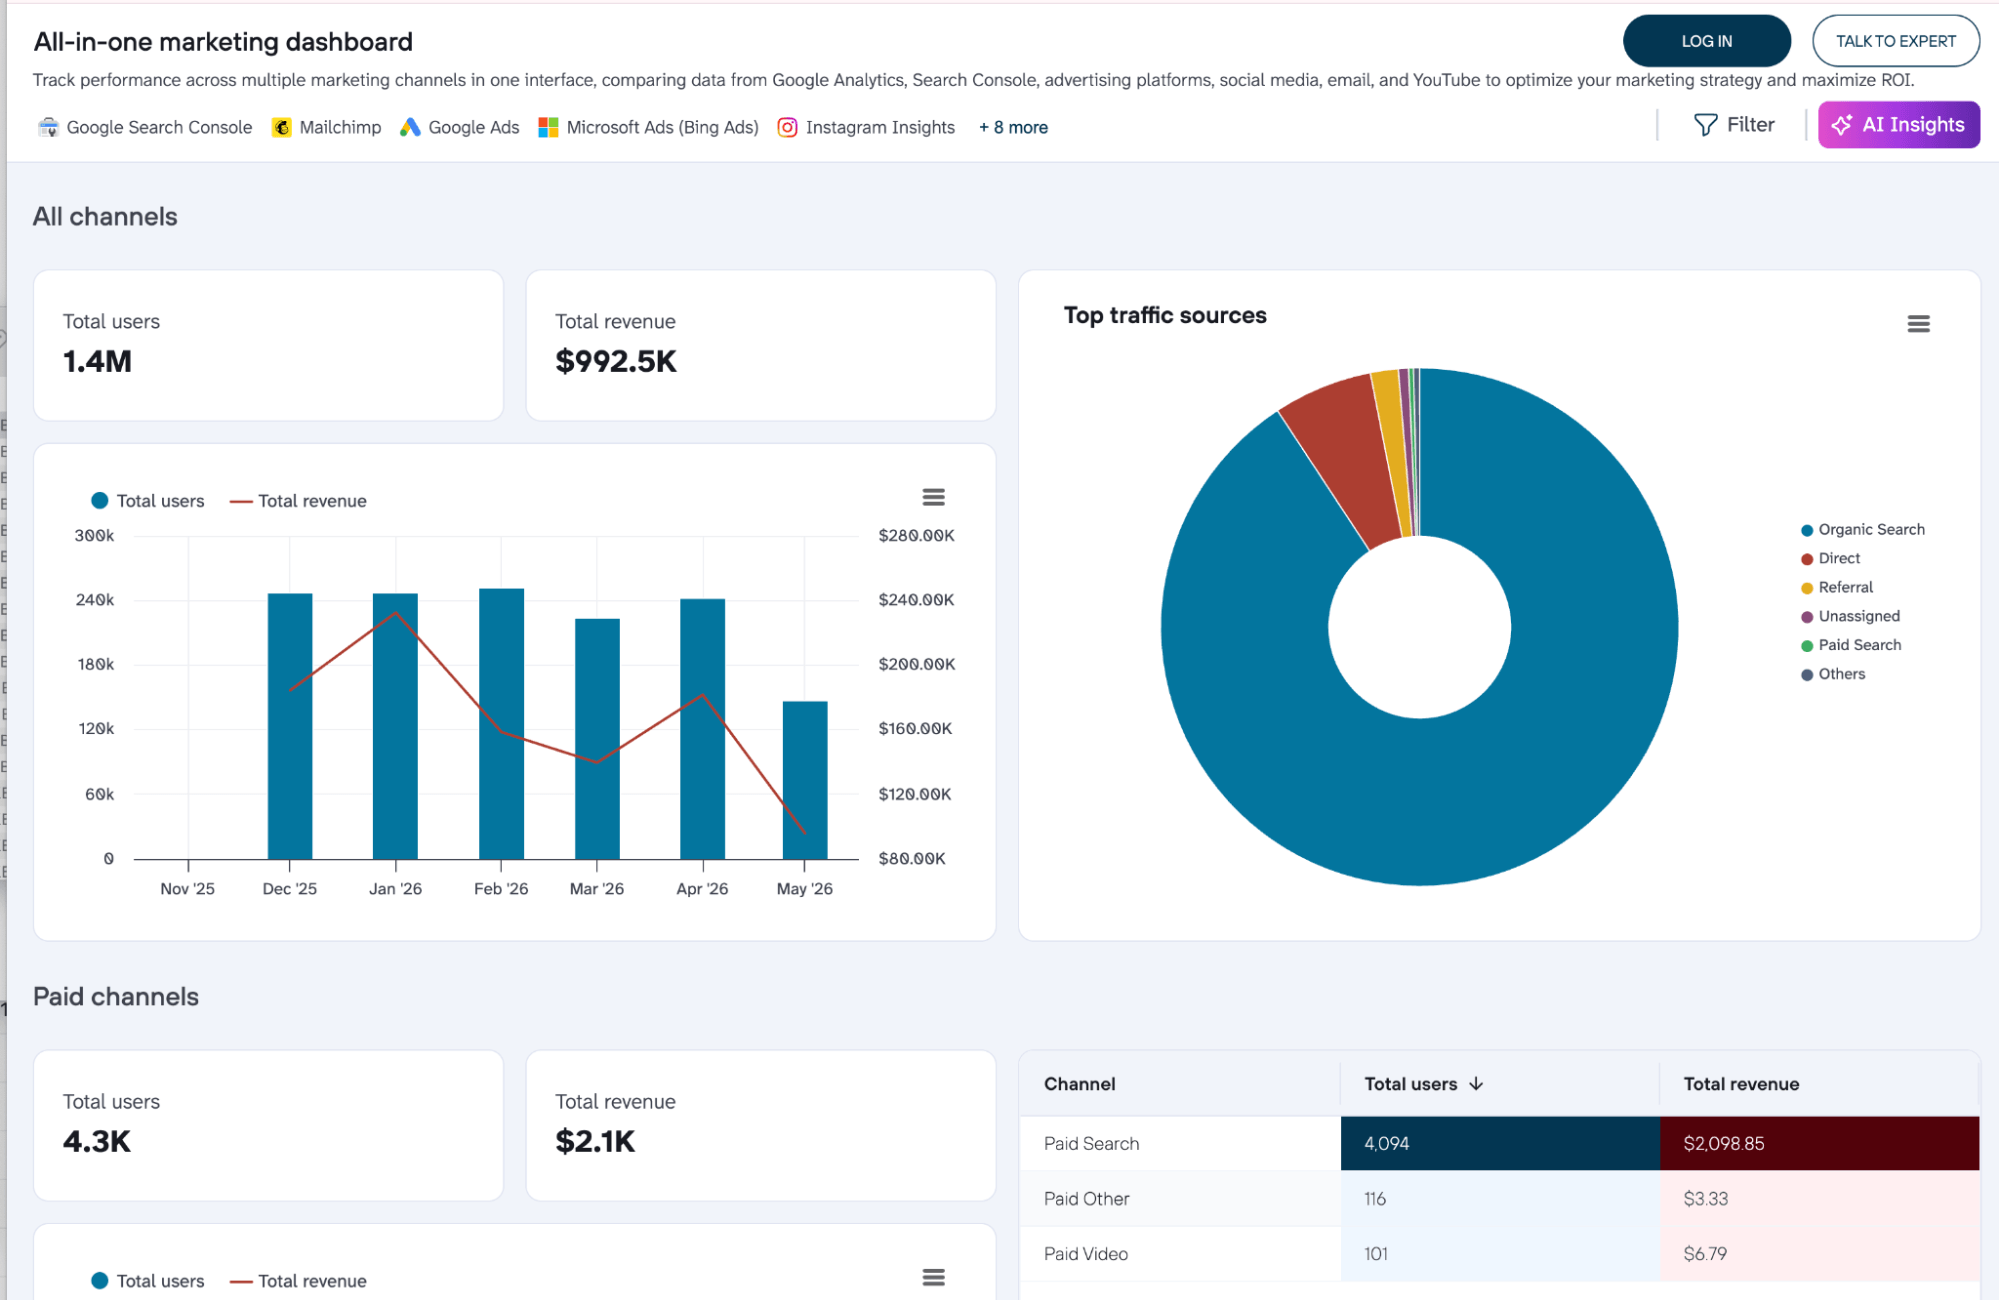
Coupler.io allows you to consolidate information from marketing and ad platforms, CRMs, analytics tools, finance apps, and other data sources. Then you can turn it into dashboards or connect to AI for conversational analysis. For example, the All in one marketing dashboard gives you one unified view on how each channel is impacting lead generation.

Content marketing ROI statistics
- Content marketing, counted as website, blog, and SEO, is the #1 ROI-driving channel in 2026, cited by 27% of marketers, per HubSpot.
- Companies using AI in content publish 47% more per month, a median of 17 articles against 12 for non-AI users, according to Ahrefs.
- Human-written blog posts cost 4.7x more than AI-generated ones, a weighted average of $611 against $131 per post.
- 51% of companies plan to increase AI content spend in the next year, and only 6% plan to cut it.
- 97% of companies edit and review AI content, and only 3% publish it untouched.
- Measuring ROI is the #4 content marketing challenge, named by 25% of content marketers, per HubSpot.
Content still compounds, but AI is changing the marketing cost. When you use AI, you can produce more, faster with less resources.
Video content ROI
- Short-form video is the top ROI content format in 2026, ranked first by 49% of marketers, up from 24% a year earlier, per HubSpot.
- YouTube was 2.7x more effective than TV and 2.8x more effective than social for EMEA brands, with long-term ROAS 1.4x higher than TV. (Underlying Google and Nielsen data spans 2020 to 2022.)
- Domino’s saw a 45% lift in overall ROI from YouTube after running brand awareness campaigns alongside performance campaigns.
- AI-personalised video ads hit 44% view-through rates, according to Deloitte.
Email marketing ROI stats
Email ROI is best read as a distribution, not one headline number. The 2026 spread, from Litmus’s State of Email 2026 survey of around 500 marketing professionals, shows most teams clustered in the middle with a small group of standouts.
Email ROI band
| Email ROI band | Share of teams |
| 45:1 or higher | 8% |
| 36:1 to 45:1 | 25% |
| 20:1 to 36:1 | 37% |
| 10:1 to 20:1 | 13% |
| 1:1 to 10:1 | 3% |
| Unsure | 13% |
- Email ranks as the #5 ROI-driving channel overall in 2026, cited by 22% of marketers in HubSpot’s report
- The open-rate sweet spot is 30% to 40%, with an industry-standard CTR of 3% to 5%. Most teams see conversion rates of 3% to 4%.
- Advanced AI adopters are 75% more likely to hit email ROI above 45:1.
- The top-ROI teams mostly send newsletters and onboarding emails, and they’re 20% more likely than peers to use behavioural-segmentation triggers.
- Customer acquisition costs rose for 73% of marketers in 2025, which strengthens the case for email retention programmes.
Influencer marketing ROI statistics
- 94% of organisations say creator content drives more ROI than traditional digital advertising, per CreatorIQ.
- 71% of industry leaders report more than 3x ROI from creator marketing, and nearly 7 in 10 brands more than doubled their creator ROI year over year.
- The top creator-marketing ROI drivers are boosting creator posts (39%) and branded sponsored posts (38%), then affiliate marketing and UGC. Gifting and seeding is now the least effective at 20%.
- Difficulty measuring creator performance is now the #1 roadblock to creator marketing, past inadequate budget and staff.
- 87.49% of marketers expect their influencer budget to grow in 2026, and 72.22% expect a jump of 50% or more, per Influencer Marketing Hub.
- Payback expectations are short: 65.9% expect influencer payback within a month, including 48.4% within two weeks.
- Best creator ROI by platform depends on the buyer. For brands, Instagram leads at 29% ahead of TikTok at 27%. For agencies, TikTok leads at 25% ahead of Instagram at 22%.
- Industry leaders now put 54% of their marketing budgets into creator marketing, and Unilever has committed about 50% of its ad spend to it.
Boosted creator posts and branded content are the top ROI drivers 2026. Brands are extending creator content into TLA paid ads and more original content aimed to build brand trust.
Marketing automation ROI
Marketing automation is now hard to separate from AI-driven marketing. In most stacks they’re the same workflows, and the data that matters sits in the AI marketing ROI view below.
AI marketing ROI
- Only 41% of marketers can demonstrate ROI on their AI investments in 2026, down from 49% a year earlier, per Benchmarkit.
- 85% of organisations increased AI investment in the past 12 months, and 91% plan to increase it further, according to Deloitte.
- Satisfactory AI ROI often takes two to four years, and only 10% of organisations see significant ROI from agentic AI.
- Governance (legal, compliance, brand review) is now the #1 barrier to scaling AI, ahead of access, expertise, and budget.
There’s a drop in ROI-measurement confidence across all industries. When marketers can prove ROI, the returns are substantial. The breakdown below is from Benchmarkit’s State of AI in Marketing 2026, based on 1,400 marketing professionals.
- 60% of marketers who can prove ROI report at least 2x returns on AI investment. Among enterprises with $10B+ revenue, that rises to 79%.
| Return level realised in 2026 | Share of marketers |
| Breakeven (1:1) | 9% |
| Positive (1-2x) | 31% |
| Strong (2-3x) | 37% |
| Significant (3-5x) | 16% |
| Very high (5x+) | 7% |
- Fewer than one in three track lift in campaign conversion, and only 8% measure pipeline or deal velocity.
- AI delivers roughly 200% more copy capacity, about 60% less manual design time, and a drop in cost per image from around €45 to €4 to €6, per Deloitte.
- AI hyper-personalised content lifts site conversion to 2.9% from 0.5%, and email CTR to 3.4% from 1.8%.
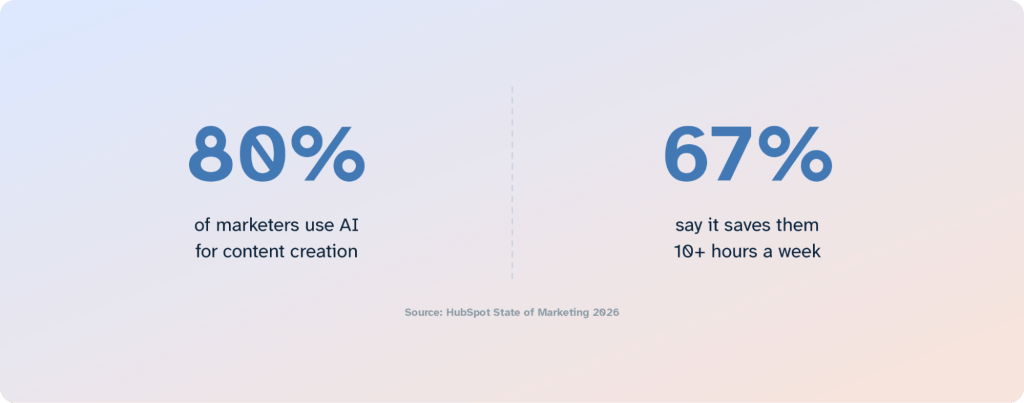
- 80% of marketers use AI for content creation, and 67% say it saves them 10+ hours a week, per HubSpot.
- Most PPC professionals report saving just 1 to 5 hours a week with AI, a useful reminder that scope drives the number.
- About 60% of small businesses now use AI in marketing, with 81% using it for content creation, up from 52% a year earlier.
- 33% of companies expect half or more of their email operations to be AI-driven by the end of 2026.
The pattern is workflow integration over isolated tools. AI value turns into ROI only with a control layer, composable tech, and clear commercial models behind it. Among companies that already have AI measurement systems in place, more than 60% see clear ROI from AI use.
Claude has been the tool of choice since the end of 2025, and we’re seeing GTM teams using Claude Code or Cowork across different use cases in their day-to-day tasks.

How to improve marketing ROI
Improving ROI usually comes down to a few marketing efforts teams already know but don’t act on. Here are four optimizations to focus on:
1. Invest in brand, not just performance campaigns: The easy move when targets are tight is to put everything into the channels you can measure this month. The problem is that brand marketing is what makes those channels convert in the first place. Cut it, and performance ROI quietly drops with it. Keep brand building at roughly 40-60% of the budget.
2. Track all your channels in one place: Most teams have Google Ads in one tab, Meta in another, LinkedIn in another, GA4 somewhere else, and the CRM on its own. You can’t compare channel ROI like that, and you can’t see the full path a customer took before they bought. The last click gets all the credit, and everything that warmed the lead up gets none.
Build one dashboard that brings every channel together and shows important metrics in real time. This makes it easier to measure marketing ROI holistically instead of just focusing on the channels with clear attribution.
Check out ROI dashboard examples for your needs.
We’re seeing a lot of our customers using Coupler.io’s Claude connector to bring data into Claude, build live artifacts to track marketing campaigns and analyze the data using plain language inside Claude.


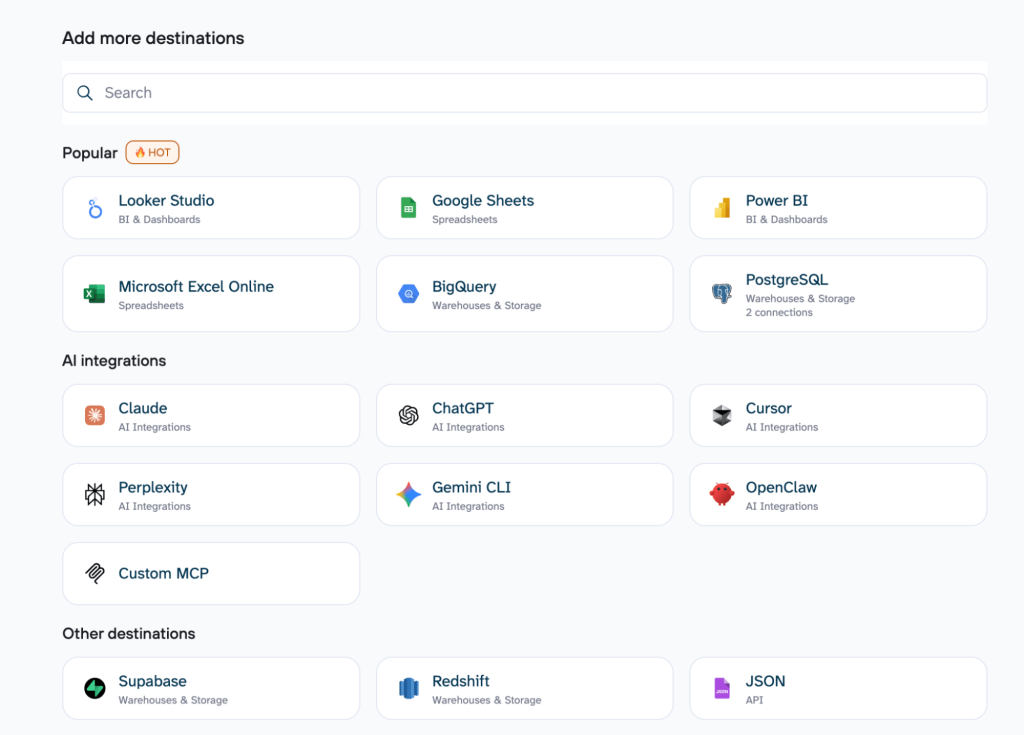
Coupler.io can help you pull data into ChatGPT, Claude, OpenClaw, Cursor, Gemini or data warehouses for building your own custom dashboards.

3. Move budget to what’s working: Once it’s all in one view, act on it. Most marketing teams set a budget once and leave it for the year. Check it monthly instead, and shift spend off the channels that aren’t returning. Even when money gets tight, reallocate rather than cut across the board: winning back lost market share costs about $1.85 for every $1 you saved by cutting.
4. Use AI to lower your marketing spend. ROI is return over cost, and cost is the side you can move fastest. AI has made production much cheaper: blog posts cost around 4.7x less than human-written ones, and cost per image drops from roughly €45 to €4-6. The point isn’t to publish more. It’s to spend less getting the same output, so more of every dollar shows up as return.
Sources
Every statistic in this article traces to one of the reports below.
- HubSpot State of Marketing 2026
- Nielsen Marketing ROI Blueprint 2025
- Litmus State of Email 2026
- Influencer Marketing Hub Benchmark Report 2026
- Deloitte Digital Marketing Trends 2026
- CreatorIQ State of Creator Marketing 2025-2026
- Google The Effectiveness Equation and Unlock Hidden Marketing ROI
- Kantar Marketing Trends 2026
- Benchmarkit State of AI in Marketing 2026
- Sprout Social 2025 Impact of Social Media Marketing
- Ahrefs The State of AI in Content Marketing (2025)
- PPCsurvey.com The State of PPC 2026
- AirOps The 2026 State of AI Search
- Similarweb AI Advertising: Insights from Real User Behavior
- WordStream by LocaliQ Search Advertising Benchmarks by Industry 2026
- LocaliQ Small Business Marketing Trends Report 2026
- Dreamdata LinkedIn Ads Benchmarks Report 2026
- Keen 2026 Marketing Investment Framework and Decision Guide