QuickBooks provides essential P&L data from which you can extract meaningful insights. However, this requires manual work and time-consuming analysis that often leaves critical patterns hidden.
Coupler.io solves this challenge with prebuilt data set templates and dashboards to turn your QuickBooks data into insights. As a result, monthly profit and loss analysis is no longer a struggle for most finance managers.
Key insights the QuickBooks profit and loss analysis report can offer
Check out a few key insights you can get when analyzing P&L data from the monthly perspective.
Track profitability trends across multiple time periods
Understanding your business’s financial trajectory requires more than a single month’s snapshot. Monthly P&L analysis combined with annual trends reveals seasonal patterns, growth trajectories, and potential financial risks that single-period reports miss.
Coupler.io solves this with the QuickBooks financial dashboard, in particular, showing trend charts for Gross Profit, Operating Profit, and Net Profit over 12 months.
Gross Profit, Operating Profit, and Net Profit

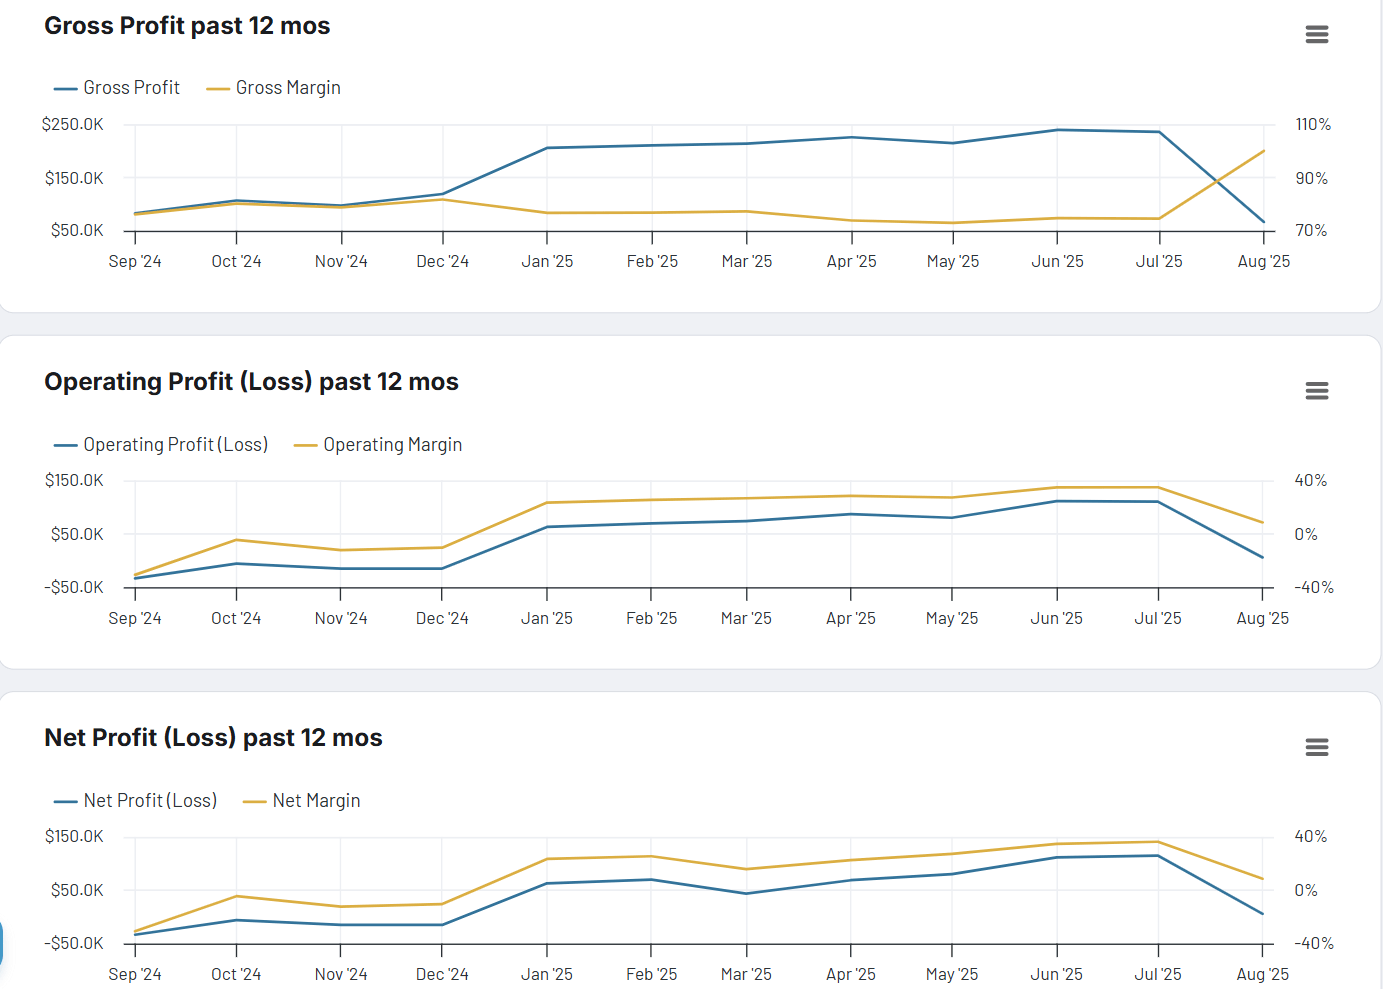
Gross Profit, Operating Profit, and Net Profit
Preview on dashboardBusiness challenges this resolves:
- Seasonal cash flow surprises: Identify profit peaks and valleys to plan cash reserves and avoid working capital shortages
- Investment timing decisions: Determine optimal periods for major purchases, hiring, or expansion based on profitability cycles
- Budget planning uncertainty: Use historical patterns to create realistic annual budgets and quarterly forecasts
- Performance evaluation confusion: Distinguish between temporary fluctuations and genuine business trends
Analyze expense patterns by category and time period
Expense management becomes significantly more effective when you can see both current spending and historical patterns across different account types. This analysis reveals which expense categories are growing disproportionately and where cost optimization opportunities exist.
The QuickBooks P&L Detail Annual dataset template provides transaction-level expense data with account classifications. It enables deep-dive analysis into specific categories, vendor relationships, and spending patterns that dashboard summaries can’t reveal.
Business challenges this resolves:
- Hidden cost creep: Detect which expense categories are growing faster than revenue before they impact profitability
- Vendor relationship inefficiencies: Identify duplicate services, premium pricing, or underperforming vendor contracts
- Budget variance mysteries: Understand why actual expenses differ from budgeted amounts at the transaction level
- Seasonal expense planning: Recognize patterns in variable costs to improve cash flow forecasting
- Compliance and audit preparation: Maintain detailed expense trails for tax optimization and regulatory requirements
Try the QuickBooks data set template by Coupler.io
Get started for freeIdentify revenue composition and growth opportunities
Revenue analysis becomes more powerful when you can see both total income and its breakdown by source over time. This insight helps identify which revenue streams are growing, declining, or seasonal.
Coupler.io’s financial dashboard for QuickBooks combines “Revenue past 12 mos” trends with “Income by Account name” breakdowns. This provides instant visual insight into revenue stream performance and dependency risks.
Revenue, income & expenses insights

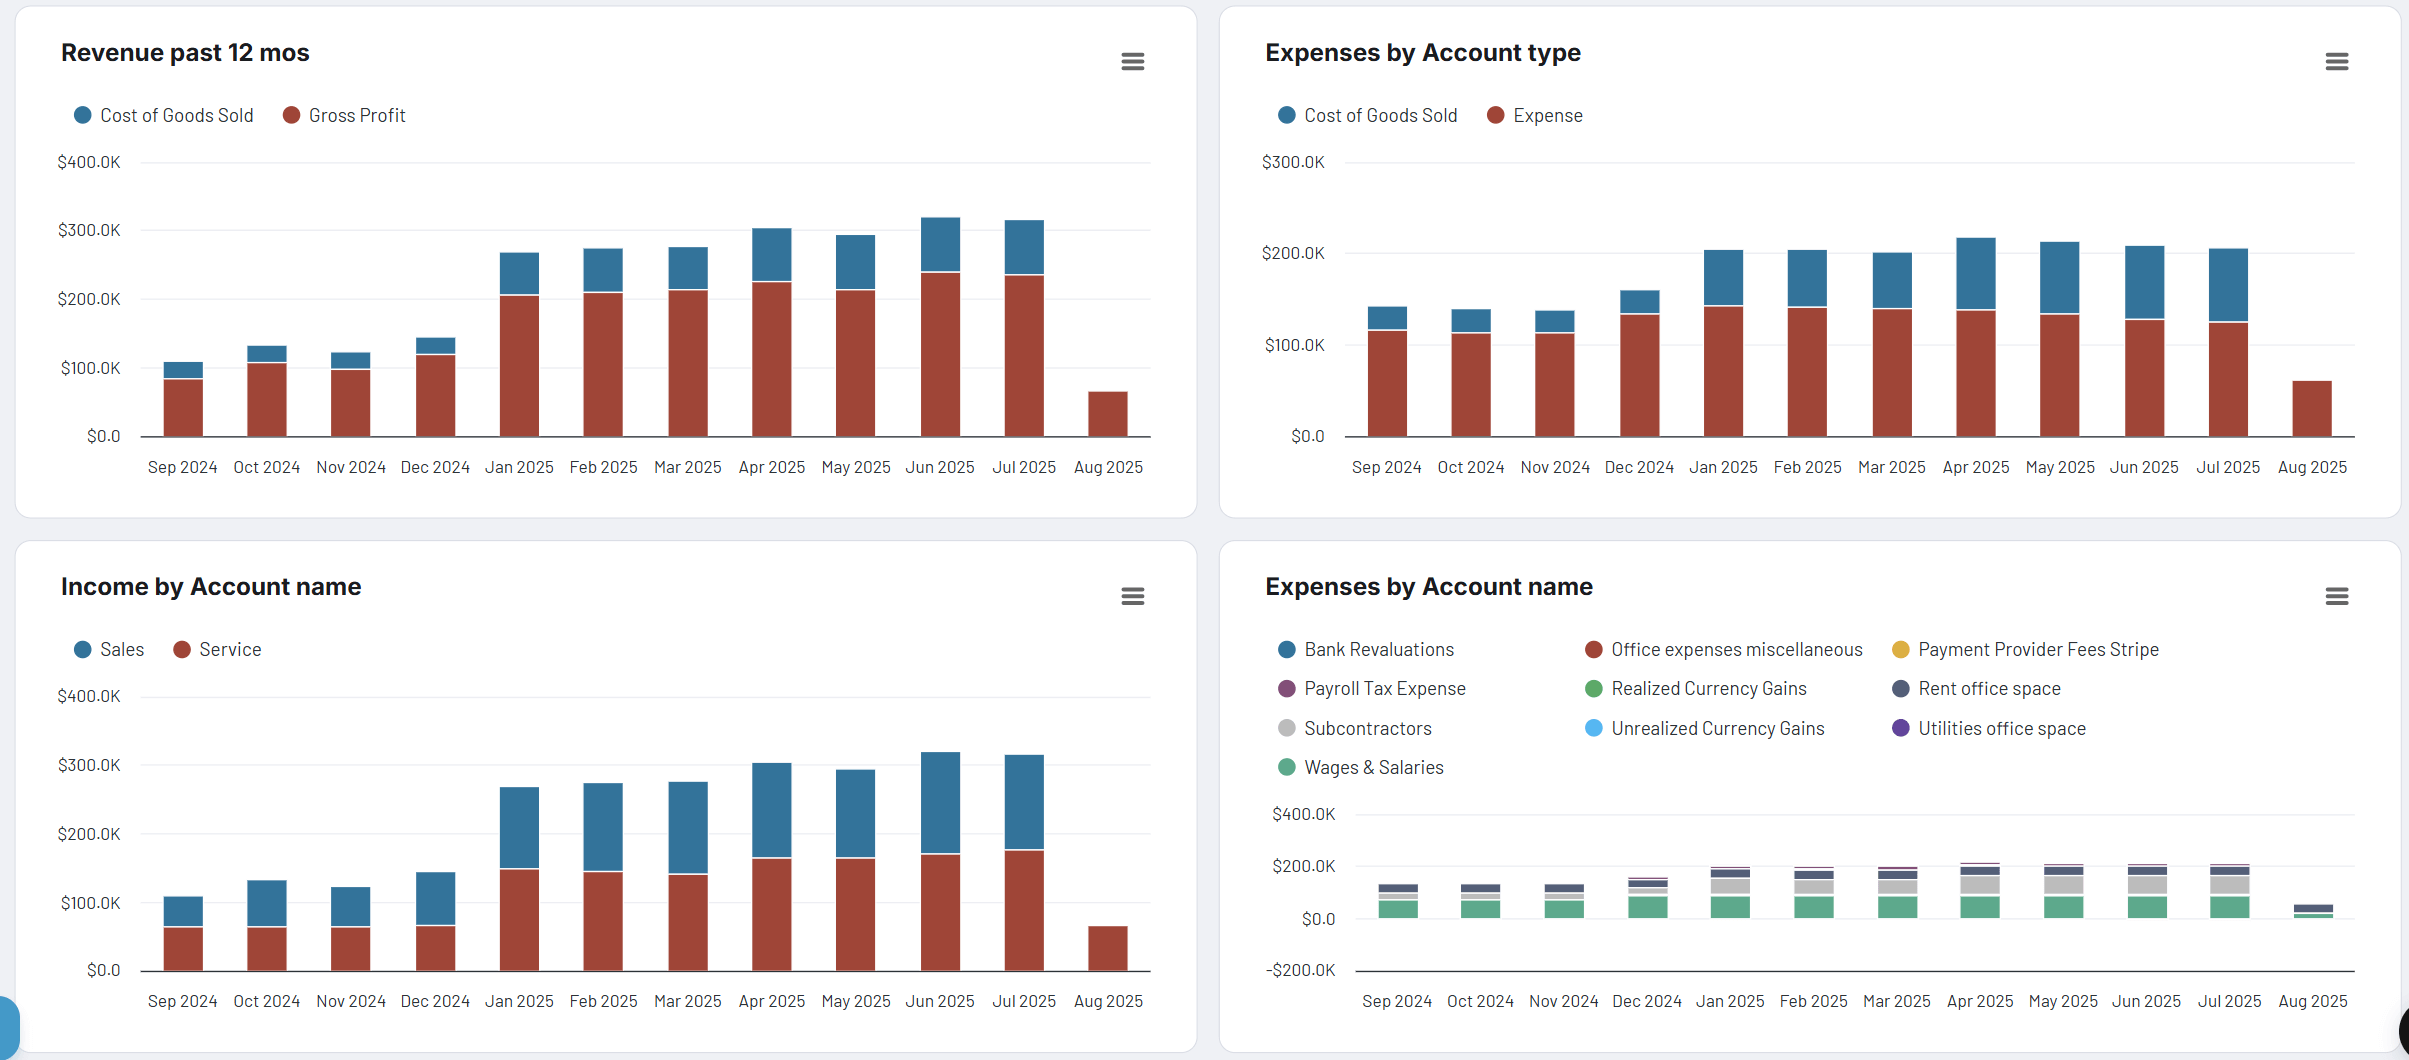
Revenue, income & expenses insights
Preview on dashboardBusiness challenges this resolves:
- Revenue concentration risks: Discover dangerous dependency on single clients, products, or service lines before they threaten business stability
- Pricing strategy confusion: Identify which revenue sources generate highest margins to focus sales efforts appropriately
- Growth planning uncertainty: Understand which business areas are expanding or declining to allocate resources effectively
- Market diversification needs: Recognize when revenue streams become too concentrated and require strategic diversification
Detect cash flow patterns and payment timing issues
Understanding the relationship between invoiced amounts, paid invoices, and overdue payments provides crucial insights into cash flow management and collection efficiency. This analysis helps predict future cash positions and identify potential collection problems before they impact operations.
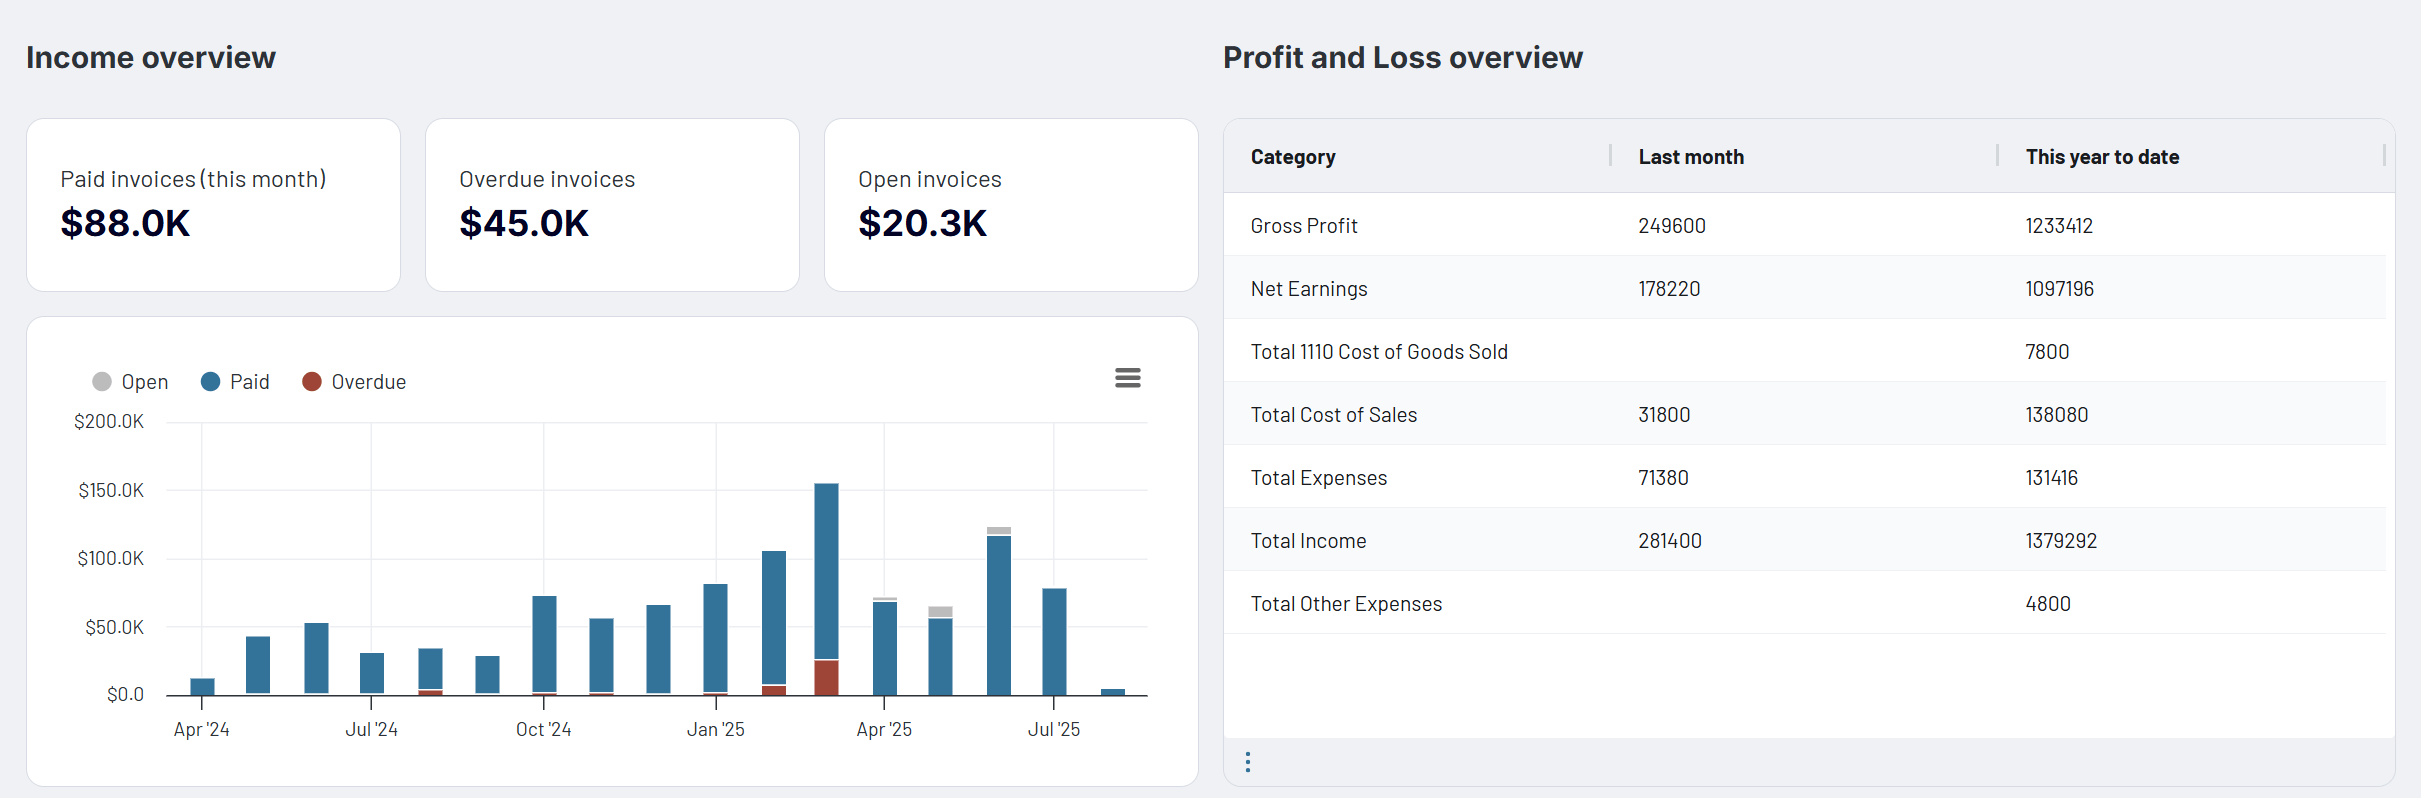
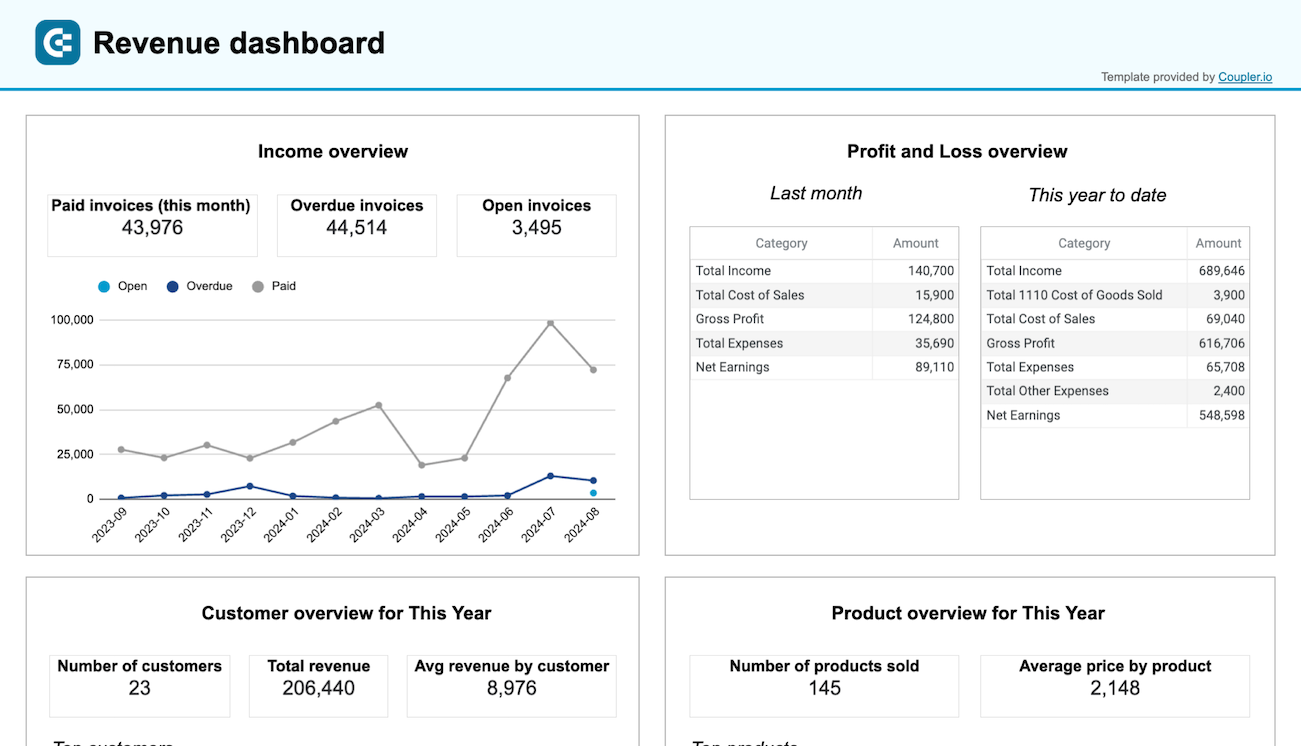
Coupler.io’s QuickBooks revenue dashboard includes an Income overview section with paid, overdue, and open invoice tracking. In addition, you can monitor the monthly collection pattern visualization that reveals payment behavior trends and collection efficiency metrics.

Business challenges this resolves:
- Payroll stress and working capital shortages: Predict cash flow gaps before they force difficult decisions about payments or operations
- Client payment behavior deterioration: Identify clients extending payment terms unilaterally before it becomes a major cash drain
- Collection process inefficiencies: Recognize when current collection methods aren’t working and need systematic improvement
- Credit policy weaknesses: Discover patterns that indicate when payment terms are too lenient for business health
Ready-to-use solutions for monthly P&L analysis in QuickBooks
Setting up a comprehensive P&L analysis doesn’t need to be complicated. Coupler.io offers two plug-and-play solutions – data set templates and dashboards.
Dataset templates
For businesses requiring white-label customization or integration with existing analytics tools, Coupler.io offers data set templates rather than building P&L analysis from scratch.
QuickBooks P&L Annual: This template provides 12 months of profit and loss data with automated calculations for annual trends, profit margins, and year-over-year comparisons. Perfect for businesses needing comprehensive annual financial analysis and strategic planning insights.
QuickBooks P&L Detail Annual: This data set includes transaction-level details with full account classifications. You get a deep-dive analysis into specific expense categories, vendor relationships, and revenue sources. Ideal for businesses requiring detailed audit trails, compliance reporting, and granular expense optimization.
QuickBooks P&L This Month: This current-period focused template provides detailed monthly P&L data for immediate cash flow analysis and short-term financial monitoring. Essential for businesses needing real-time profitability tracking and monthly performance evaluation.
All dataset templates provide automated refresh capabilities and can be customized to match your specific chart of accounts structure and reporting periods. You can integrate them with your preferred analytics tools like Power BI, Tableau, or Google Sheets for custom analysis.
In addition to P&L data sets, Coupler.io offers templatized solutions for cash flow, invoices, balance sheets, and more.
Explore all data sets for QuickBooks with Coupler.io
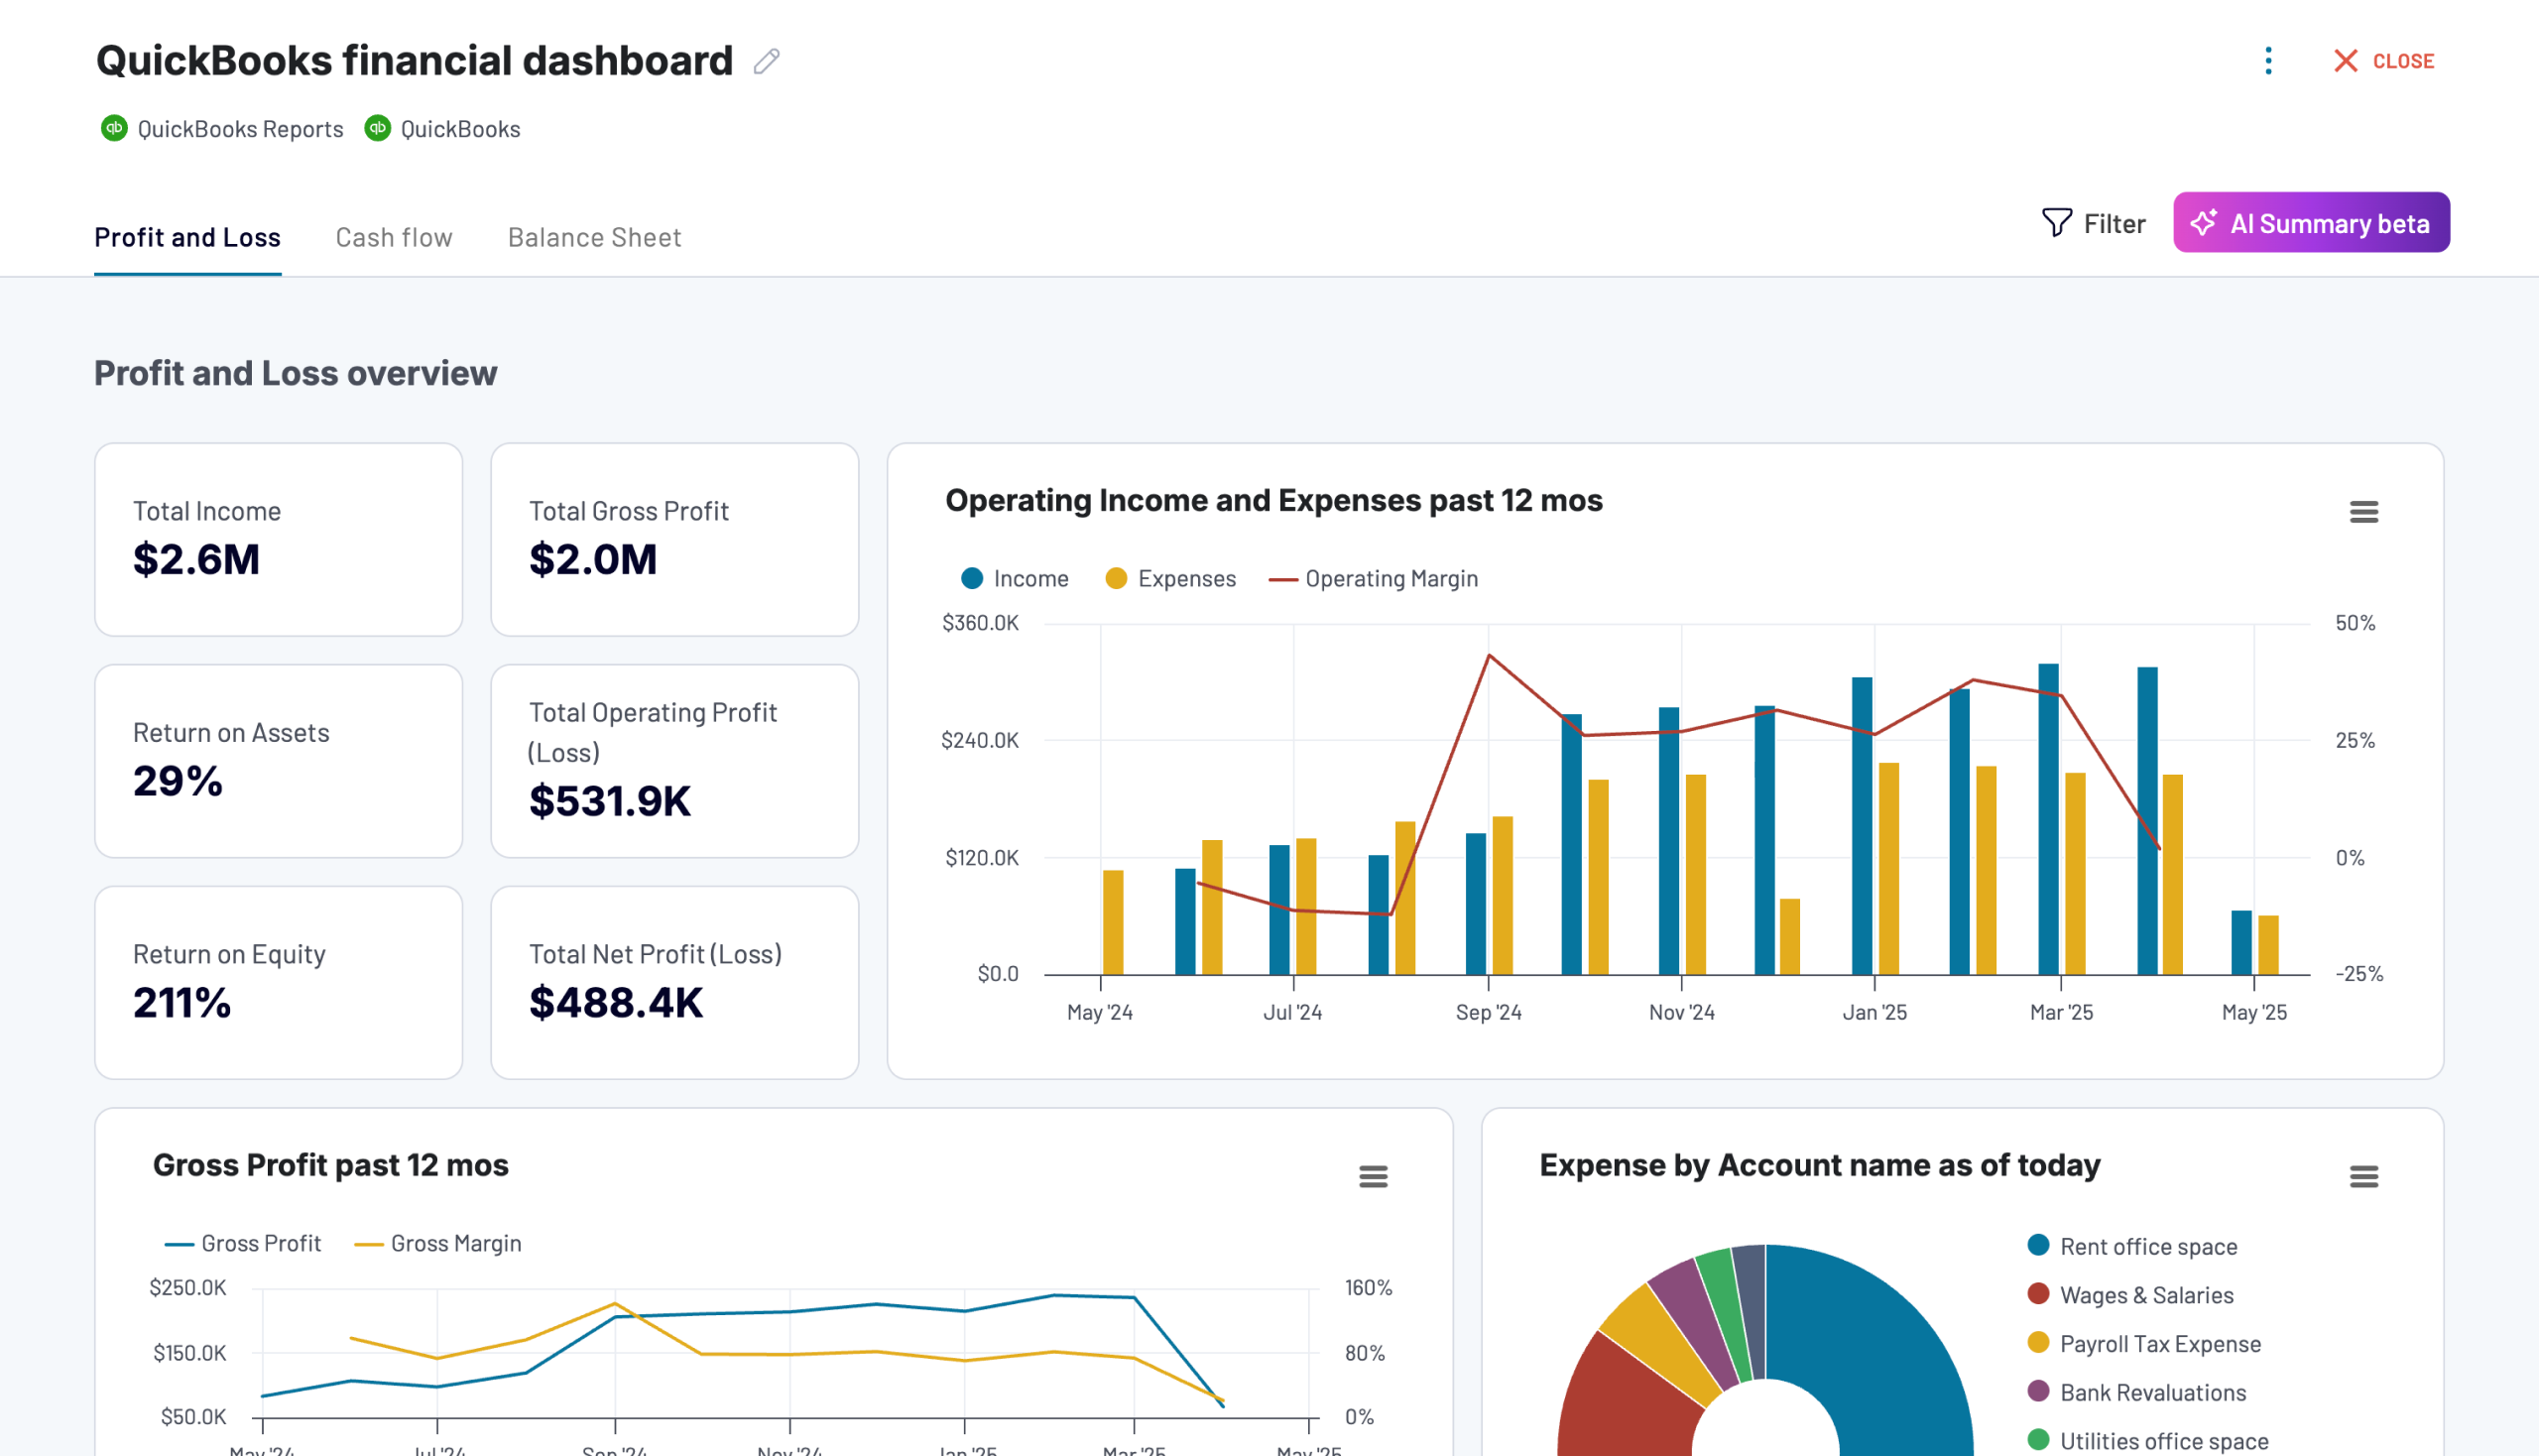
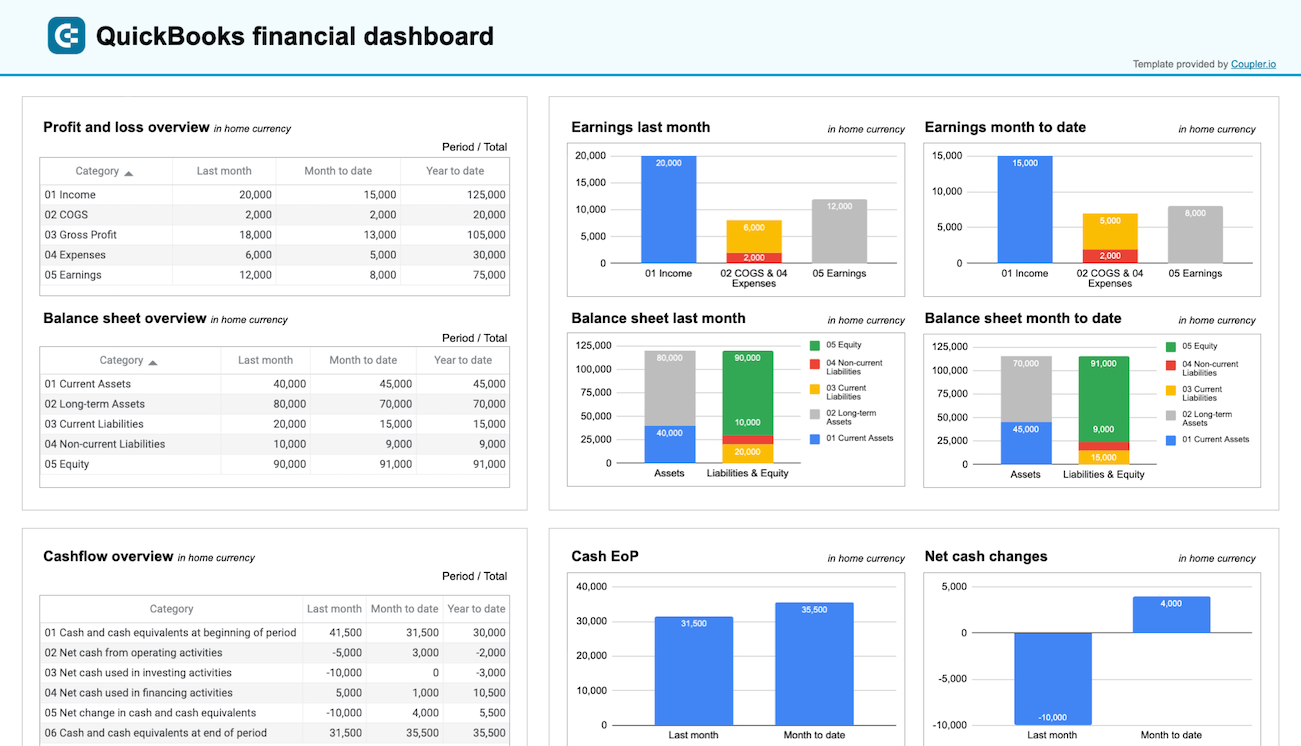
Get started for freeQuickBooks financial dashboard by Coupler.io
This dashboard delivers insights into your company’s financial performance by tracking earnings, cash flow, and balance sheet changes in one unified view. Designed for small business owners, financial managers, accountants, and bookkeepers, it provides an at-a-glance understanding of financial health without diving into detailed spreadsheets or reports.


P&L insights this dashboard provides:
- Monitor profitability trends through revenue, expenses, and net income analysis for last month, month-to-date, and year-to-date periods
- Control costs by identifying expense patterns and comparing them against revenue performance
- Track earning trends with visual charts that quickly reveal growth patterns or areas needing improvement
- Assess financial position through balance sheet analysis showing assets, liabilities, and equity relationships
- Manage liquidity effectively with cash flow tracking that highlights net cash changes over reporting periods
- Ensure operational stability by monitoring bank and cash account balances across all linked accounts
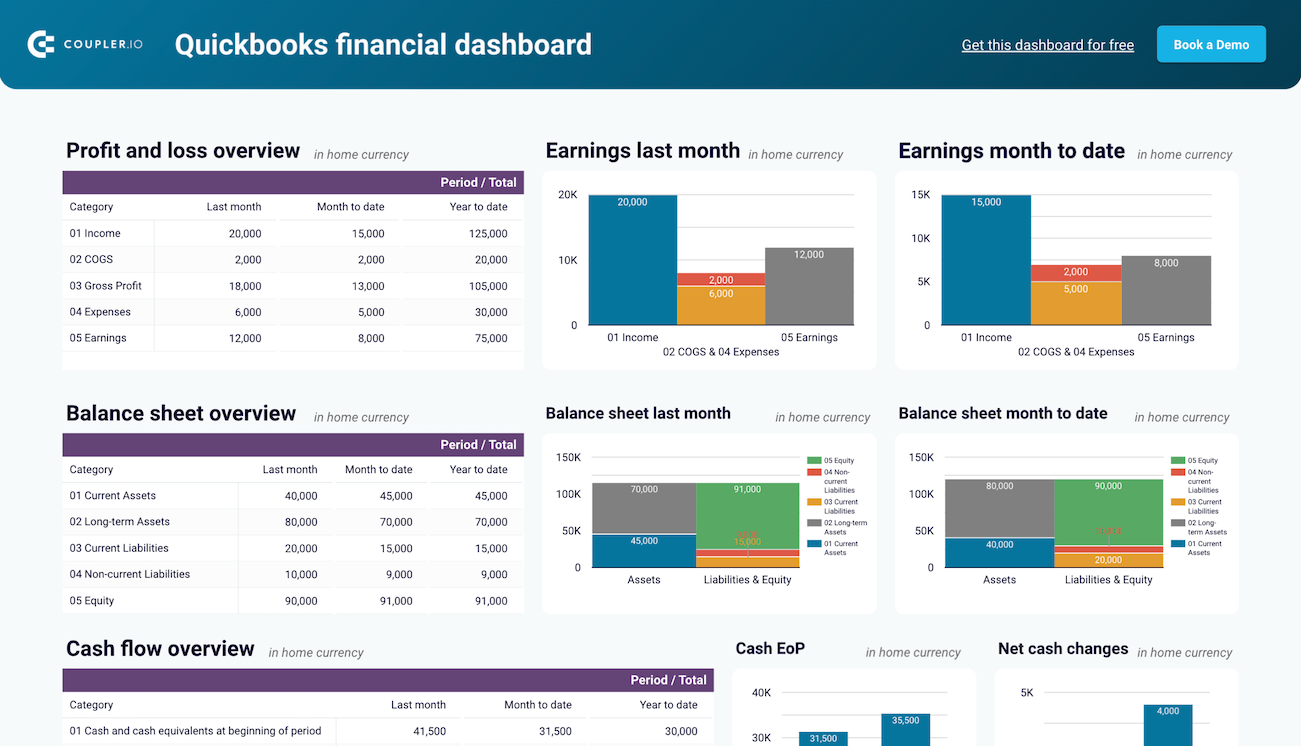
How to get started: The dashboard is available in Coupler.io and as a template for external tools like Looker Studio or Google Sheets. Choose the needed version and follow the setup instructions to connect the dashboard to your QuickBooks account.
QuickBooks financial dashboard
Tracks earnings, monitor cash flow, and analyze balance sheet changes with a dedicated dashboard that provides a clear picture of your business finances.


QuickBooks financial dashboard in Google Sheets
Get a clear snapshot of your business finances, including cash flow, P&L, balance sheets, and bank accounts, powered by data from QuickBooks Online.
Quickbooks financial dashboard in Looker Studio
Monitor and analyze your business’s financial health with real-time insights into profit and loss, balance sheet, cash flow, and bank & cash accounts.
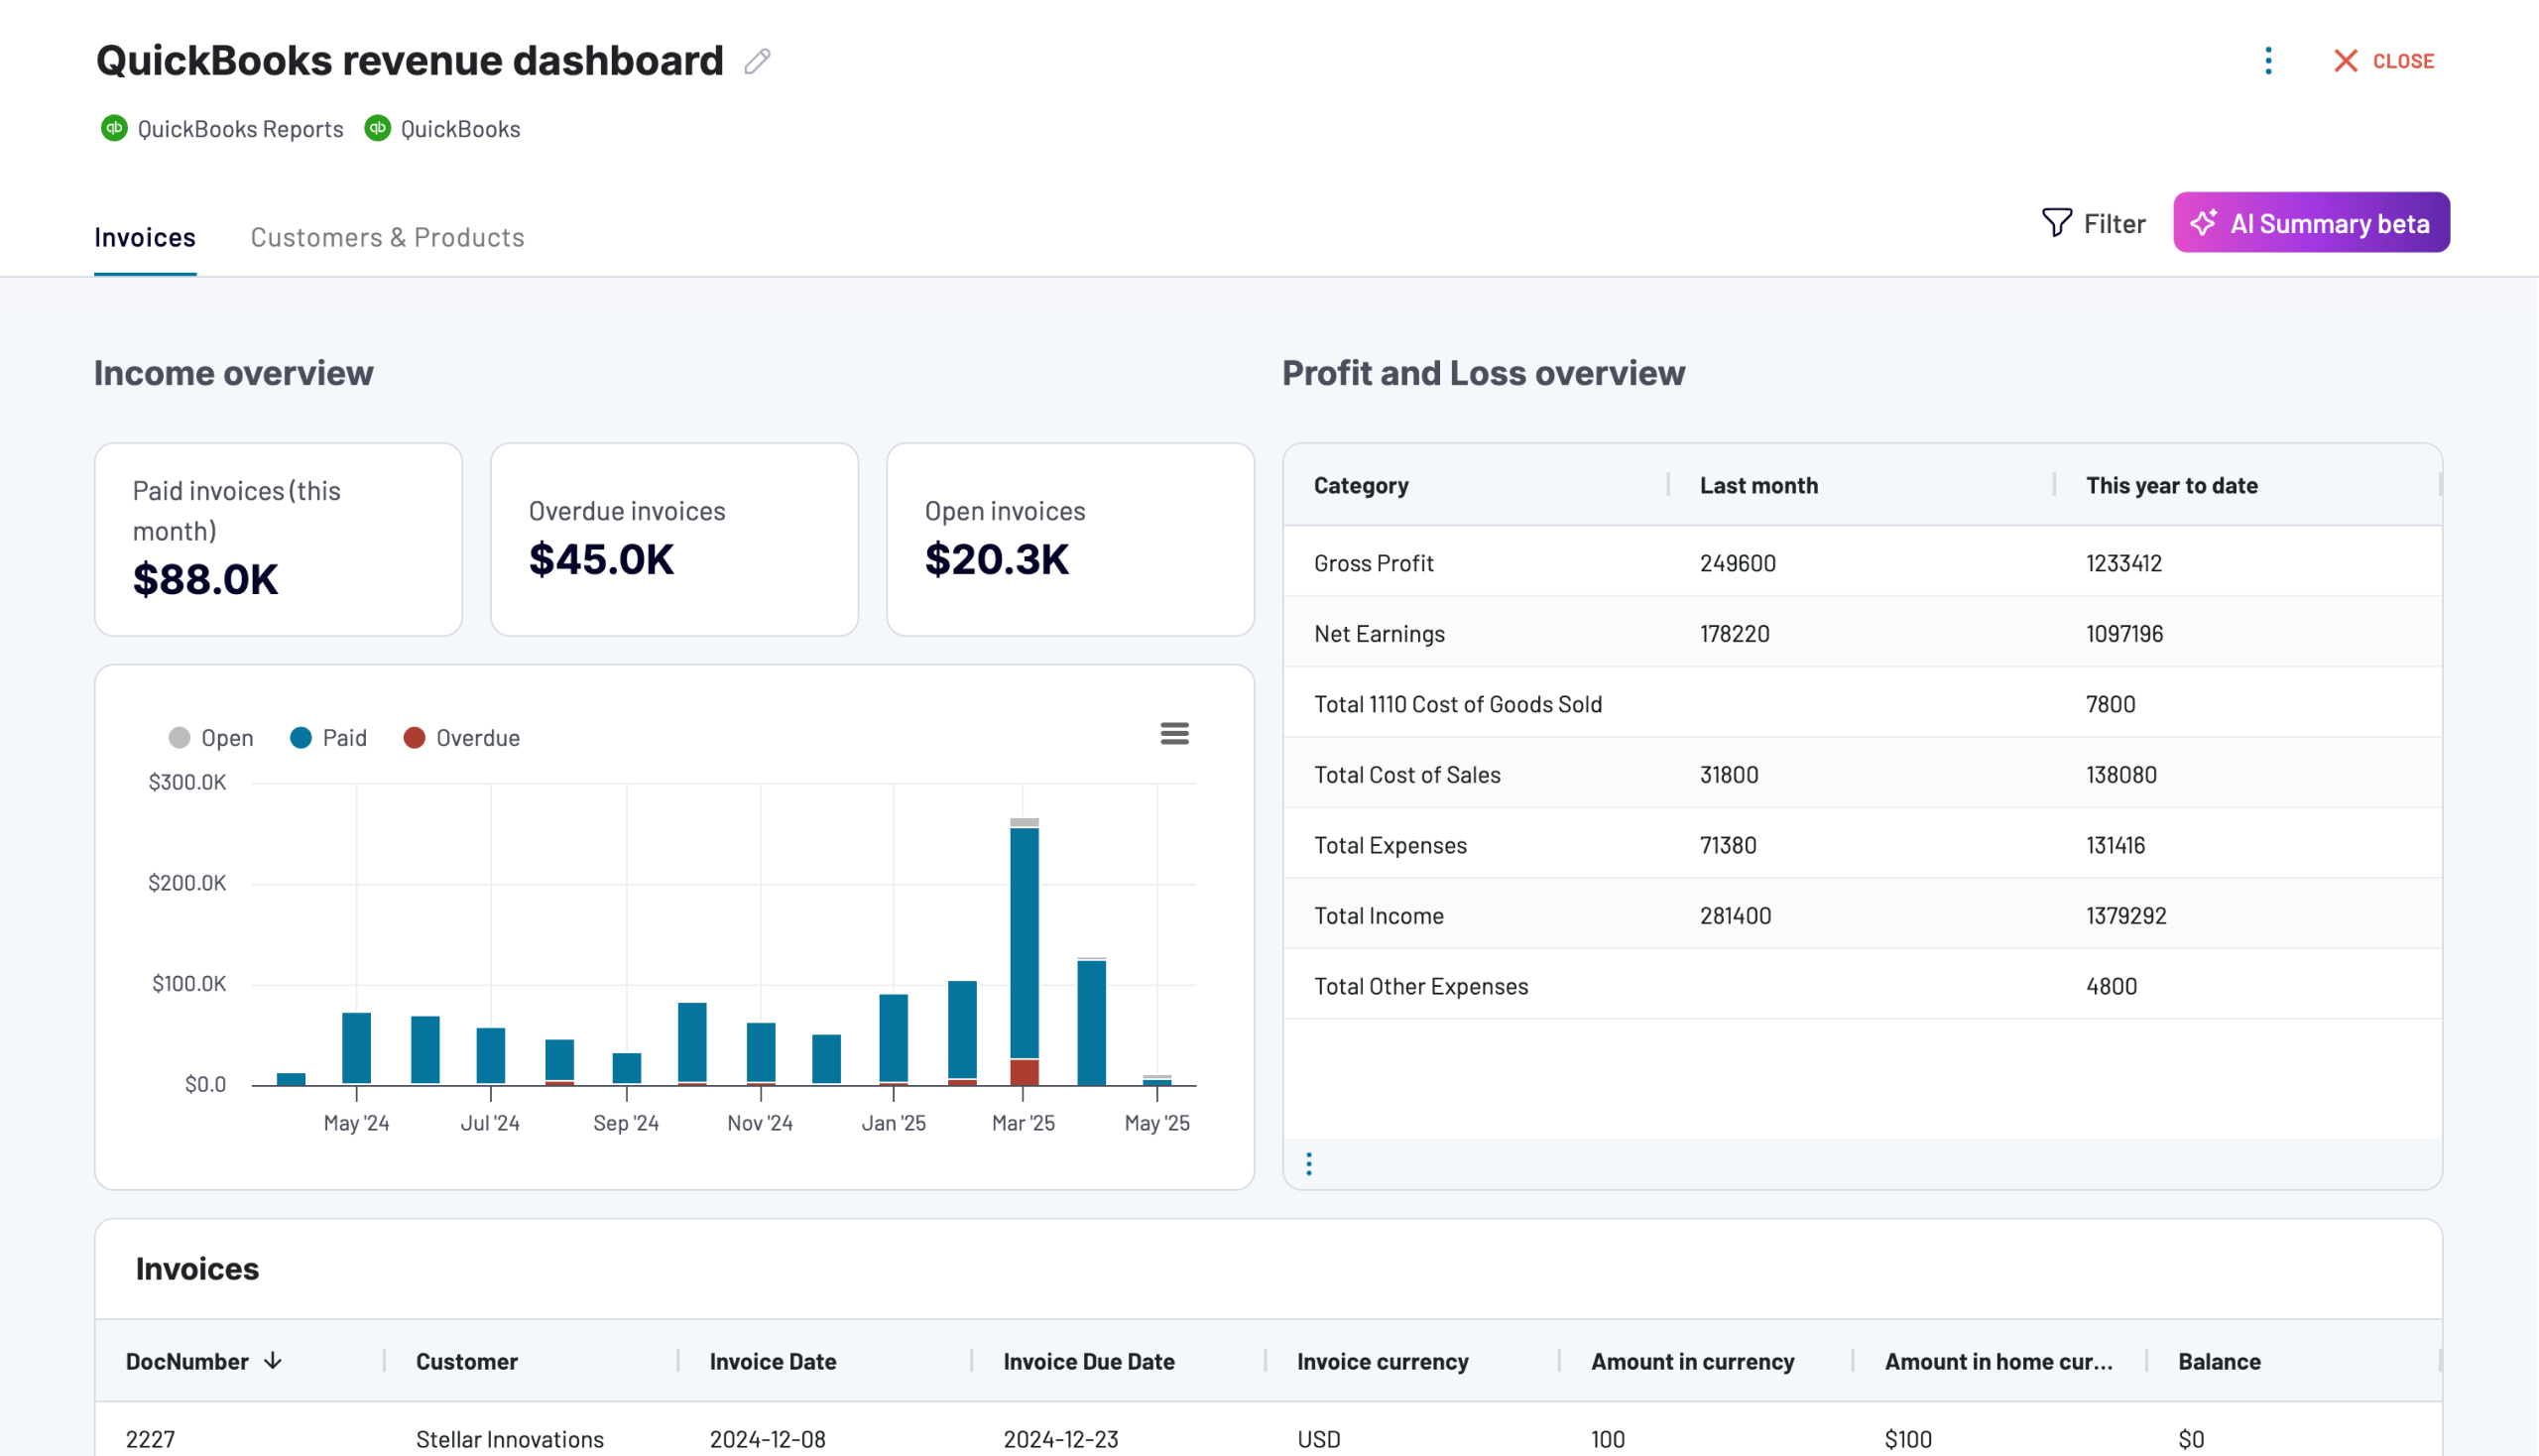
QuickBooks revenue dashboard by Coupler.io
This specialized dashboard focuses on income monitoring and revenue optimization for small business owners and accounting officers using QuickBooks Online. It provides detailed insights into revenue distribution, customer performance, and product profitability to enable strategic revenue planning and targeted business growth.

P&L insights this dashboard provides:
- Track overall revenue trends over the last 12 months to identify seasonal fluctuations and peak revenue periods
- Analyze profit and loss performance by comparing revenue against expenses for effective cost management
- Identify top revenue-generating customers for targeted marketing efforts and retention strategies
- Discover best-selling products and services to optimize inventory management and sales strategies
- Monitor income distribution patterns to understand which business areas contribute most to profitability
- Assess revenue concentration risks by analyzing customer and product dependency
How to get started: The revenue dashboard is also available in multiple versions – from a native Coupler.io dashboard to a template in Power BI. Setup takes minutes, and the dashboard begins populating with your historical data immediately.
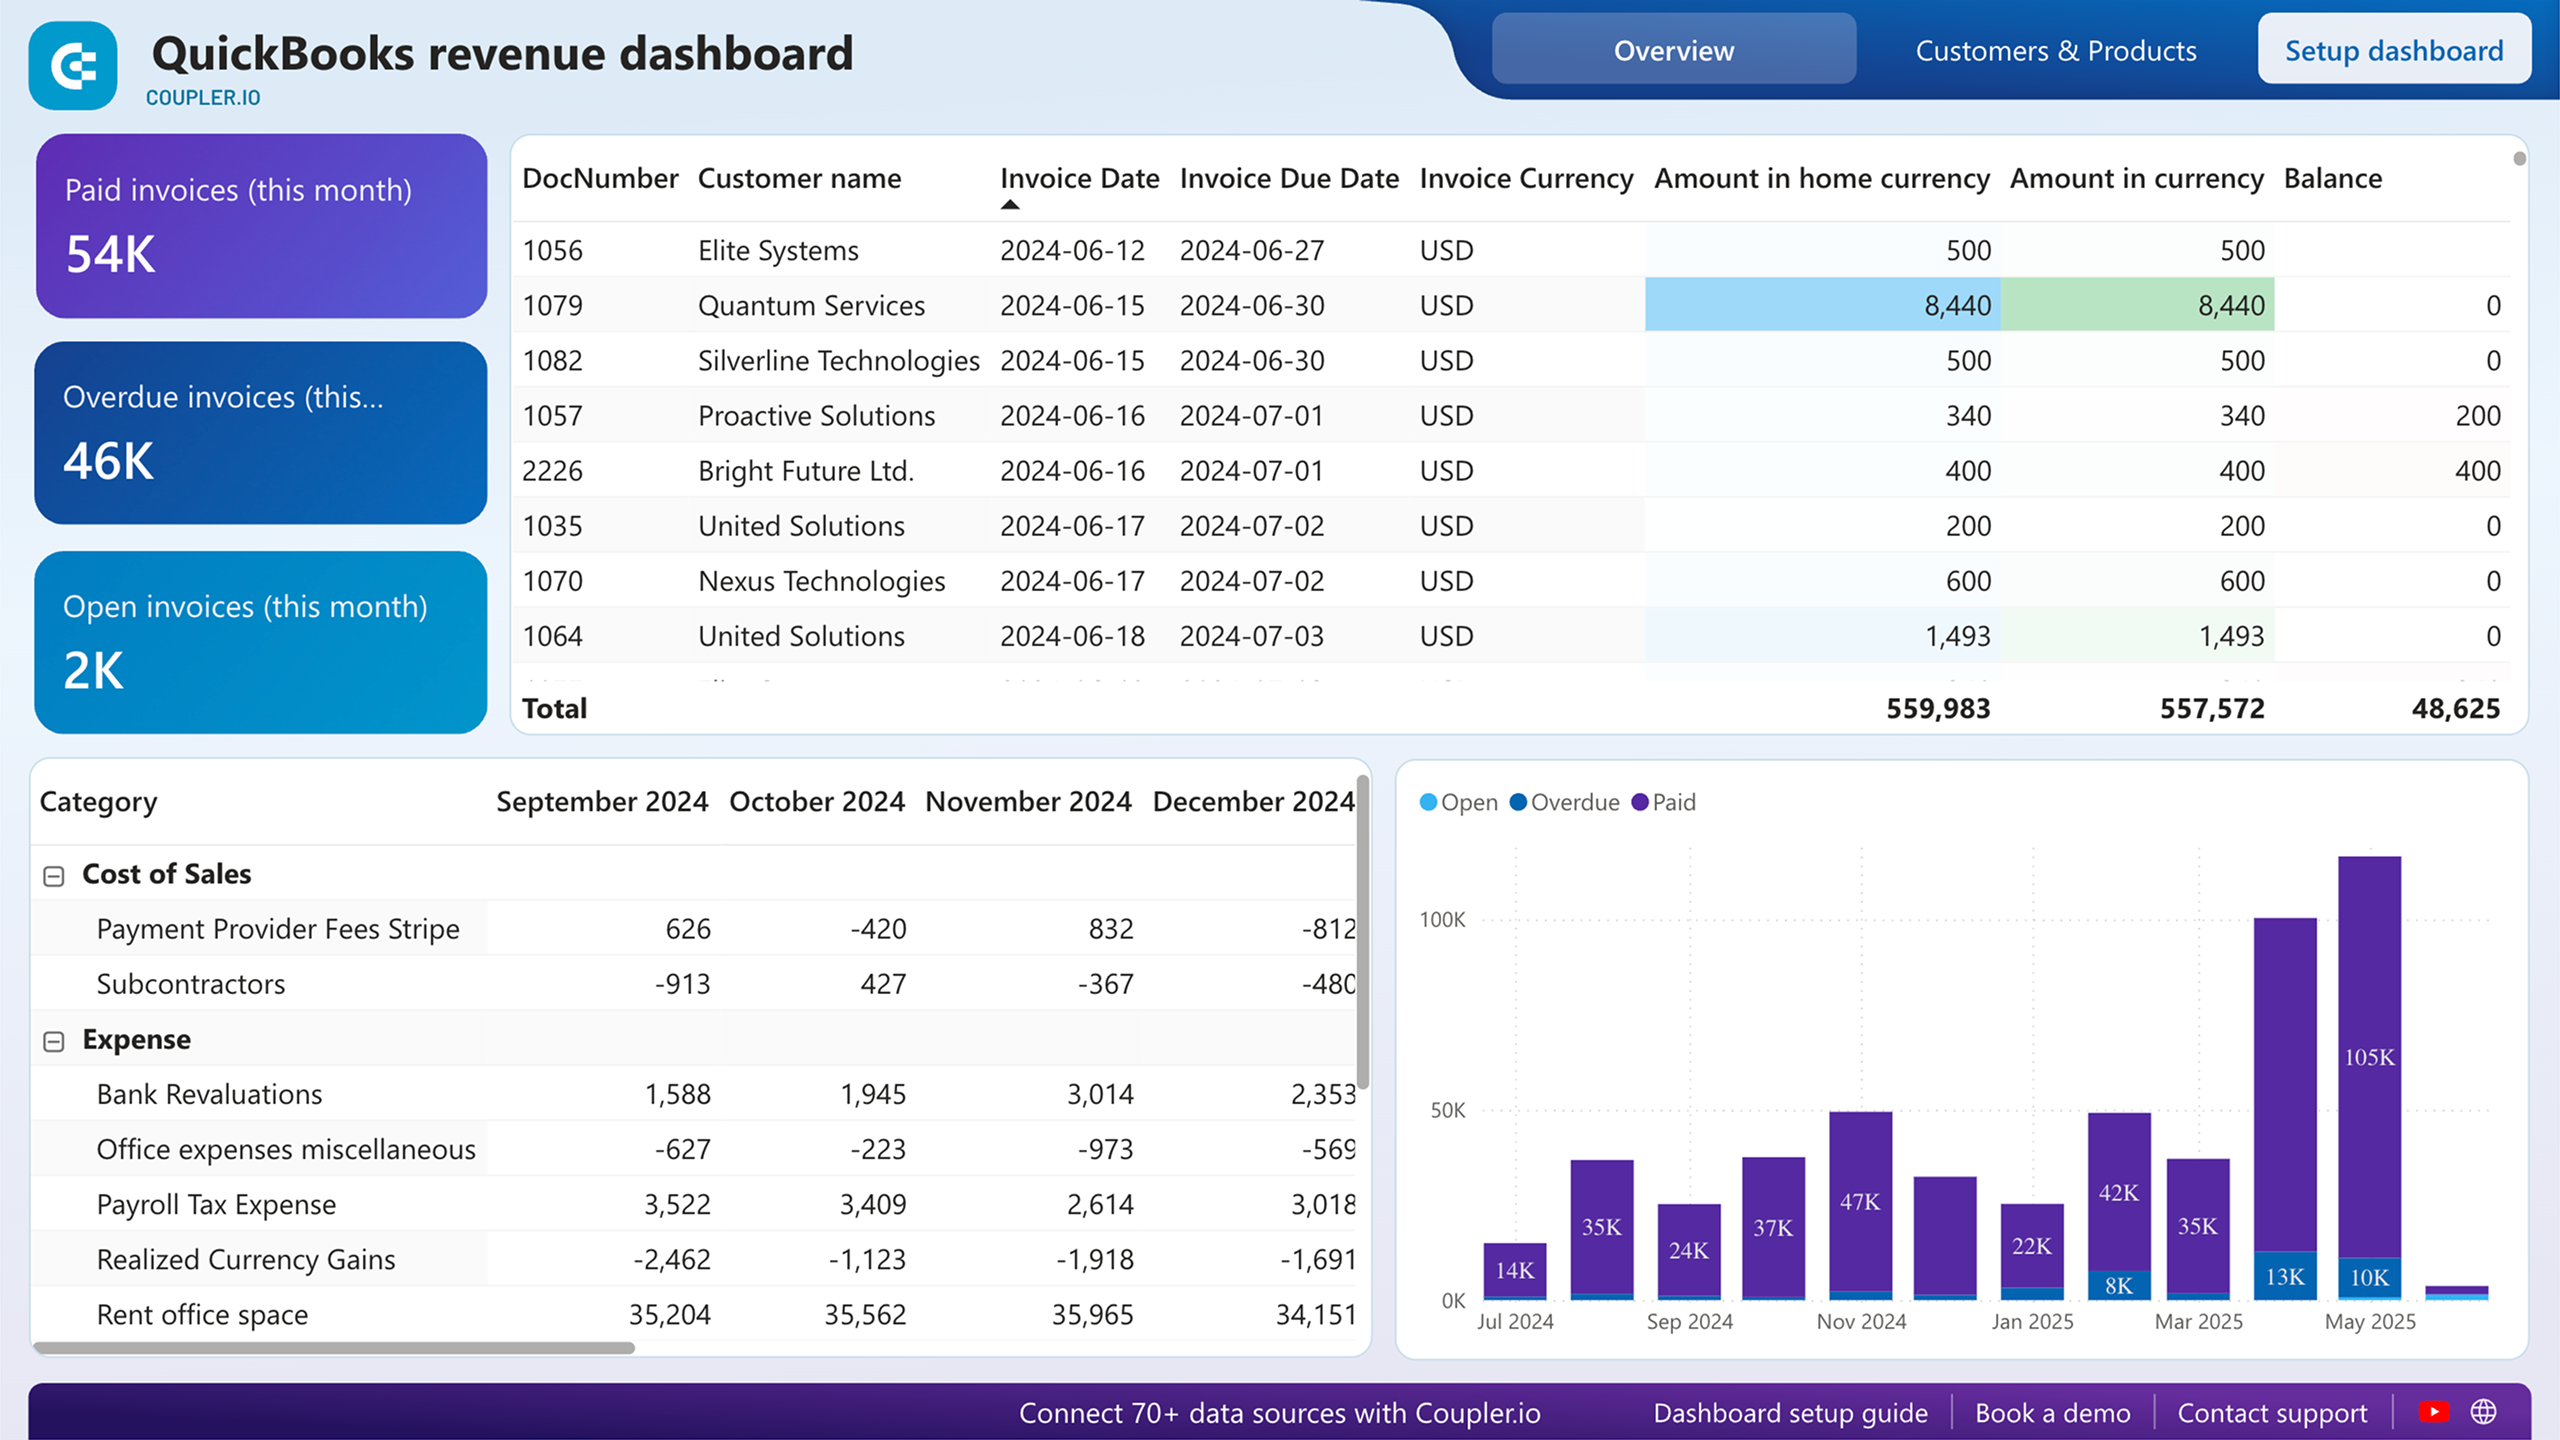
QuickBooks revenue dashboard
Transform your QuickBooks data into actionable revenue intelligence with visualized sales trends, product performance metrics, and customer value analysis. This dashboard helps identify growth opportunities and optimize pricing strategies through easy-to-understand charts.


QuickBooks revenue dashboard in Looker Studio
Get an overview of your revenue based on the data from QuickBooks and unlock in-depth insights to drive informed business decisions.

QuickBooks revenue dashboard in Power BI
Monitor your income and expenses on an all-in-one revenue dashboard connected to your QuickBooks Online account.
QuickBooks revenue dashboard in Google Sheet
Analyze your revenue through a set of reports collected from QuickBooks Online on a single dashboard.
Ask AI to analyze profit and loss data from QuickBooks
Traditional financial analysis requires building complex queries, creating pivot tables, and manually calculating ratios to extract insights from your QuickBooks data. However, you can delegate these data manipulations and other financial data analytics tasks to an AI assistant.
Coupler.io enables you to integrate QuickBooks data with AI tools like Claude and ChatGPT through our Coupler.io MCP server. It acts as a bridge for AI integrations and lets you benefit from conversational P&L analysis, where you ask natural language questions and receive instant, data-driven answers.
Instead of manually analyzing spreadsheets and calculating ratios, you can ask:
- “Which months had the highest operating profit margins this year?”
- “Show me the revenue trend for my top 3 income sources”
- “What’s causing the expense increase in Q2 compared to Q1?”
- “Which expense categories should I prioritize for cost reduction?”
- “How do my profit margins compare to industry benchmarks?”
The AI analyzes your complete QuickBooks dataset and provides specific, actionable answers based on your actual financial metrics, not generic advice.
Real-world example: Worst-performing months by profit
Here is an example of using the dedicated QuickBooks MCP to integrate data flows from QuickBooks with Claude. Once you’ve connected data, just ask:
Sample query: “Show me the worst-performing months by profit and recommend what I can do to improve them.”
AI analysis results:
Based on your QuickBooks P&L data, here are your lowest-performing months and specific improvement recommendations:
PROFITABILITY ANALYSIS
- Worst month: December with -$66K net loss
- Performance: Revenue dropped 75% while expenses remained at $200K
- Problem: Seasonal revenue decline without proportional expense reduction
- Recommendation: Implement variable cost structure and build cash reserves during peak months
EXPENSE EFFICIENCY
- Issue: Fixed expenses of $140K monthly regardless of revenue performance
- Performance: Operating margin dropped to -40% in low-revenue months
- Problem: Cost structure not aligned with revenue seasonality
- Recommendation: Convert 30% of fixed costs to variable or implement seasonal staffing
CASH FLOW OPTIMIZATION
- Issue: $45K in overdue invoices during low-revenue periods
- Performance: Collection efficiency dropped 25% in Q4
- Problem: Inadequate collection processes during seasonal downturns
- Recommendation: Implement automated collection systems and seasonal payment terms
Priority actions:
- Emergency fix: Accelerate collection of $45K overdue invoices to improve immediate cash position
- Strategic action: Renegotiate 3 largest expense contracts to include seasonal adjustment clauses
- Technical action: Set up monthly P&L variance alerts to catch declining trends within 30 days
You can enhance your P&L analysis with follow up questions or ask AI to turn it into a report or visualization to share with stakeholders.
The future of financial optimization
The combination of comprehensive QuickBooks data collection through Coupler.io and intelligent analysis through AI represents the evolution of financial management. You’re not just tracking numbers – you’re having conversations with your data to uncover insights that drive strategic decisions.
Whether you’re a financial manager trying to understand monthly variances, a business owner looking for optimization opportunities, or an executive needing quick performance summaries, the Coupler.io solution makes your financial data accessible and actionable.
This is financial analysis reimagined – where insights come from conversations, not complex spreadsheets. And it’s available today for your profit and loss optimization workflow.