Many business owners and CEOs either don’t analyze financial data at all or rely on a very basic form of financial analytics — looking at a basic sales report in their ecommerce app like a Shopify sales report.
This doesn’t give you a clear picture of your business and doesn’t let you make strategic business decisions. Doing full-scale analytics is accessible to any business, even if you don’t have a CFO or a financial data analyst on board.
Follow this guide to learn more about what financial analytics is and what is the best use of data analytics in finance with only fundamental analytics skills.
What is financial data analytics?
Financial data analytics is the process of interpreting vast amounts of financial data to formulate a comprehensive picture of your business’s financial health. This data can include records of sales, incoming or outgoing invoices, information about assets & liabilities, and so on.
Financial data may come from one consolidated source or from multiple sources. For instance, you may have a CRM on your website that helps process and log all sales done through the website. At the same time, employees don’t always log the sales over the phone or on Instagram; these only appear on your payment processing app. Mapping these fragmented streams into a unified view is one of the most effective AI use cases for CFO and finance teams, as it ensures your automated reports reflect every dollar earned rather than just the easiest ones to track.
On top of that, you may have incoming invoices logged manually into a spreadsheet, and a balance sheet done by an accountant — that makes four total financial data sources you’re working with.
With all that financial data in one place you’re likely to aggregate it for reporting, like a balance sheet dashboard, mine it to find areas of improvement, or run predictive analytics to run some financial modeling ahead.
However, before those more complex processes, companies have to set up the systems that prepare data for analytics. This includes exporting data automatically from multiple sources, setting up a data warehousing solution, and creating simple dashboards that all team members can use.
Importance of data analytics in finance
Suppose you’re running a small business like an ecommerce website on Shopify and you only have one source of sales data. In that case, you may get away with only viewing financial statistics in your Shopify admin. However, if you’re planning on moving forward or you run a much larger operation, consolidated financial reporting is crucial. For businesses with multiple sources of sales data, bringing all the data into one warehouse helps with more accurate reporting and saves time.
Reporting on the financials accurately gives you a broader understanding of your business’s health. It also allows you to locate problems that could be fixed, for instance, catching a drop in sales or a rise in cost per acquisition across different platforms. When you trace the problem to the cause, you can fix it faster and save money in the long run.
Having all the financial data management in one place also allows you to do financial forecasting — predict how your financials would look like based on current trends. If you do more advanced analytics, you’ll be able to predict possible dents in cash flow depending on your decision-making and plan your budget ahead.
If nothing else, doing financial data analytics for a long time makes it easy to pitch your business to investors, as you have months or years of financial data to back up your offer. A quick tip: consider using pitch deck design services like Whitepage, Visme, or Slidebean to turn your financial data into an eye-catching pitch. Still, the data itself matters the most.
How is data analytics used in finance for businesses
The use of data analytics in finance can be implemented in five key areas to improve your business:
- Financial audit
- Reporting
- Sales attribution
- Fraud detection
- Predictive data analysis
Financial audit
The most straightforward way to analyze financial data, and one you will most likely do first when creating an analytics system, is auditing your financial situation. This will give you a more nuanced idea of your financials and help you set goals.
In the most basic form, you’ll have to calculate:
- Gross & net profit margin
- Monthly or annual revenue
- Return on sales
- Operating cash flow ratio
- Gross burn rate
You also want to analyze all of these metrics and some basic ones like sales and revenue over time. Seeing a trend in your revenue can indicate how well your business is doing and whether it’s growing at a comfortable rate.
Explore more on how to track and analyze business revenue.
Then, you could do deeper analytics, for instance, calculate profitability for each product or customer to find out what brings you more money. Shifting priorities to that could potentially improve your bottom line. Check out profitability dashboard examples by Coupler.io.
Doing a financial audit first is a great way to understand the dynamics of the most important thing in your business and potentially track and fix major issues.
Reporting
Data analytics in finance is used for ongoing business performance. It’s a great way to constantly keep in touch with the financials of your organization, show the health of your business to the stakeholders, and spot potential trouble beforehand.
In case you’re only working with a single sales channel, and you don’t think you need a more complicated financial reporting solution, you may use a dashboard built into your ecommerce tool like Shopify.
But many platforms like that lack the option to customize your reports, or they may not store historical data for that long. If that’s the case, or if you’re using multiple sources of sales data, it’s best to export the data and create a CFO dashboard of your own.
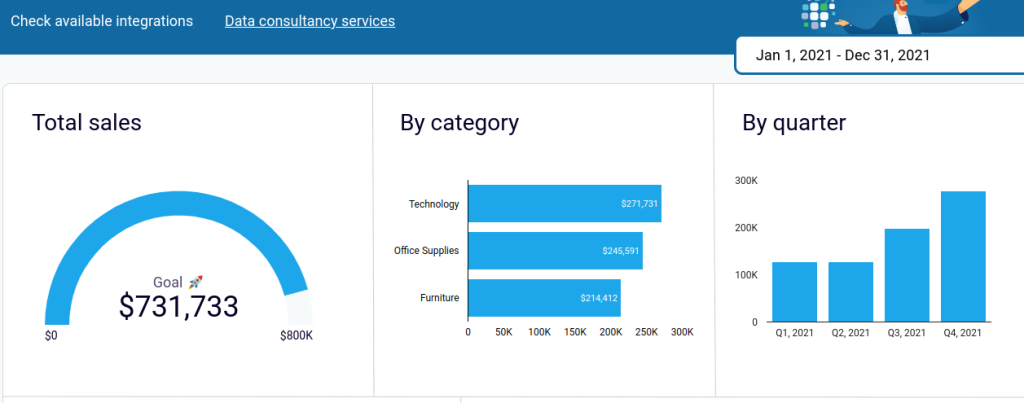
It does require some time to set up, but the beauty of it is that it can be as broad or as narrow as you want. For instance, you could just display sales volume and a breakdown by quarter.
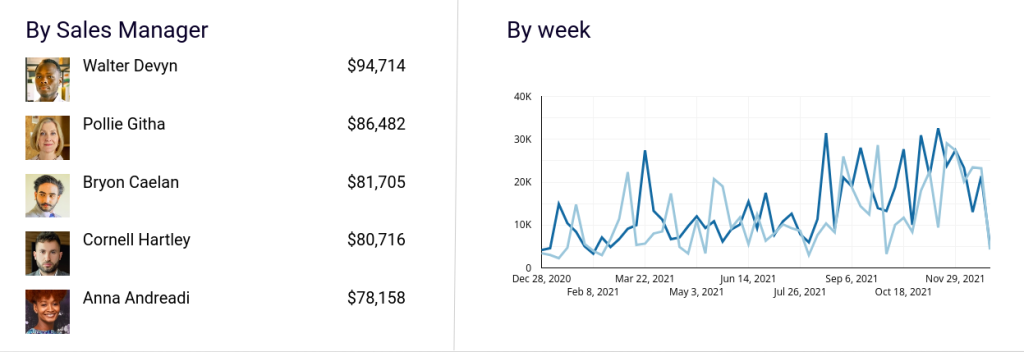
Or you could add more detailed breakdowns like showing graphs for sales representative performance,
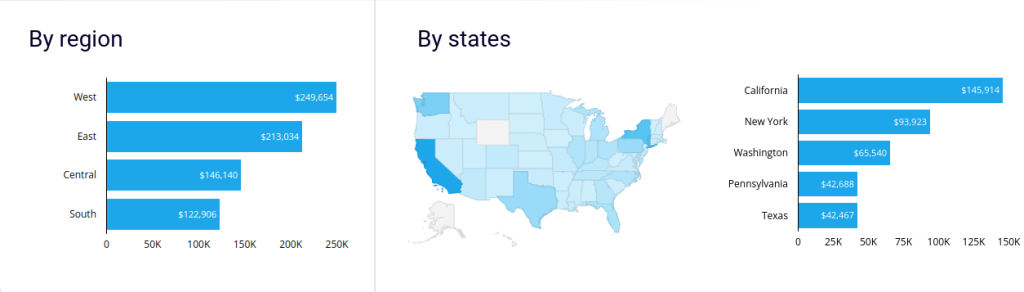
and sales across different locations. For ecommerce businesses operating multiple storefronts, multi-location analytics takes this further by consolidating cross-store data into a single reporting view.
Provided you keep all the raw data in a warehouse in case you need any further financial analysis in the future, you can have your dashboard really simplistic. Or you could serve a simpler dashboard to the executive team and a more detailed one to the teams that need that specific information.
The best part about reporting is that you can automate most of it. With a data integration platform like Coupler.io, you can connect your data source or data warehouse to Looker Studio or any other business intelligence tool. It also supports Google Sheets, Excel, BigQuery. You can not only automate data refresh in your report on a schedule but also implement triggered automation. For example, send email notifications to all the stakeholders once the report is refreshed. This way, your reporting becomes essentially real-time and hands-free.
Check out Xero report templates you can use for your accounting reporting.
And what about AI-powered financial insights? It’s also possible with Coupler.io since it provides integrations with AI tools, such as Claude and ChatGPT. You can integrate the needed financial data sets from your data sources with AI and ask it to query, analyze, summarize, etc. This way you can do your financial analytics in Claude, Cursor, Copilot, and custom AI agents.
This raises an important question: will LLMs replace dashboards for financial reporting? The answer is no—they serve complementary purposes. Dashboards provide the visual overview essential for monitoring financial KPIs, spotting trends at a glance, and tracking performance over time. LLMs excel at answering specific questions about your financial data, like “Why did expenses increase last quarter?” or “Which product line is most profitable?” The most effective financial analytics approach combines both: dashboards for continuous monitoring and LLMs for conversational, on-demand analysis.

Set up multi-source financial reporting in Claude
Talk to Coupler.ioSales attribution
Another use of financial analytics is sales attribution. To do a complex, and arguably more accurate sales attribution, you’d need to track the customer journey through all the touchpoints with your company, like engaging with ads on different platforms, reading the blog, viewing the emails, etc.
But if you don’t have that just yet, you can do a simpler single-source attribution model with financial data analytics.
Breaking down sales by channel and further breaking them down by new and existing customers will give you a clear picture of where your sales are coming from. Breaking sales down by the type of customer will show what channel brings you new clients and which is best for working with existing ones.
Learn more about revenue reconciliation in our blog post.
Fraud detection
The first three ways of using financial data analytics are standard and don’t require much effort from most business owners. This one, however, does.
Data analytics in finance can help you detect fraud and either prevent it or contact the authorities fast. One way of finding the purchase patterns of your existing customers and creating an alert when there are multiple purchases under an account that doesn’t shop with you constantly, expensive purchases, or a change in shipment address. These signals are a reason to check if the company is legit and, if needed, notify the authorities.
Financial data analytics isn’t the only way to prevent fraud. To do this more consistently and accurately, you need to implement a system that analyzes incoming transactions as they happen and uses machine learning to spot activity that may be fraudulent.
But if you don’t have that or can’t afford it yet, analyzing sales data is a good, cheap solution that can help you spot fraud shortly after it has happened. In this case, you could contact the customer and the authorities to avoid problems down the line.
Predictive data analytics
Another advanced way to use data analytics in finance is predictive analytics. Since you’re storing a lot of historical data and can use it to see historical trends, you could also project those valuations into the future and try to predict what may be ahead.
One of the most straightforward ways to do predictive analytics is by predicting your cash flow. Based on the previous dynamics of accounts payable and accounts receivable, you can understand when cash flow is going to go down so you can optimize financial planning and budgeting ahead. This is especially important for agencies and other services businesses as sometimes it takes a long time for an invoice to be cleared.
Check out the examples of a cash flow dashboard template by Coupler.io.
Besides, forecasting a P&L statement is also a key for diverse predictive analysis since it enhances operational efficiency by providing insights into future revenues and expenses.
You could also run sensitivity analysis, also known as what-if analysis. In this type of analytics, you try to change one of the variables in your financials and see how it would affect your bottom line or other important metrics.
Tools for data analytics in finance
Creating a financial analytics environment can set you back tens of thousands of dollars if you run a large company or a corporation that operates millions in monthly sales volume and has hundreds of suppliers.
But if your business is a small ecommerce store, SaaS startup, or agency, it’s possible to analyze your financial performance with a set of tools with moderate pricing or that are absolutely free. The quality won’t suffer either because these tools do their job for ETL in finance perfectly.
There are dozens of specialized tools for data analytics in finance, like Asset-Map and ReadyRatios. Software like this can import your data and produce standardized reports based on it. Some of these tools even claim to rely on artificial intelligence algorithms to provide an A-class level of financial services.
But they may not be customizable enough for your needs. The alternative is creating a financial analytics environment with different tools that allow you to tailor the reporting to your needs and business models. For businesses seeking even more advanced capabilities, AI-powered solutions like the Coupler.io MCP server enable natural language conversations with your financial data. You can ask questions and get insights without complex queries or technical expertise. Explore the MCP server use cases for data analysis across industries.
Check out how you can analyze QuickBooks data using ChatGPT or Claude.
You can do that with Coupler.io, one of the most versatile solutions for financial reporting automation and analytics. Coupler.io can help organizations make the most out of their data by connecting data streams of most apps you use making it a powerful tool for accounting automation and financial reporting.
For instance, you can export sales data from your payment processor to BQ and then wrap it up in the form of a dashboard in Looker Studio or Power BI.
It does all data imports and exports automatically, on a schedule that you prefer. You can also configure some data transformation in the app in case you need to change the data before loading it into the warehouse or BI tool.
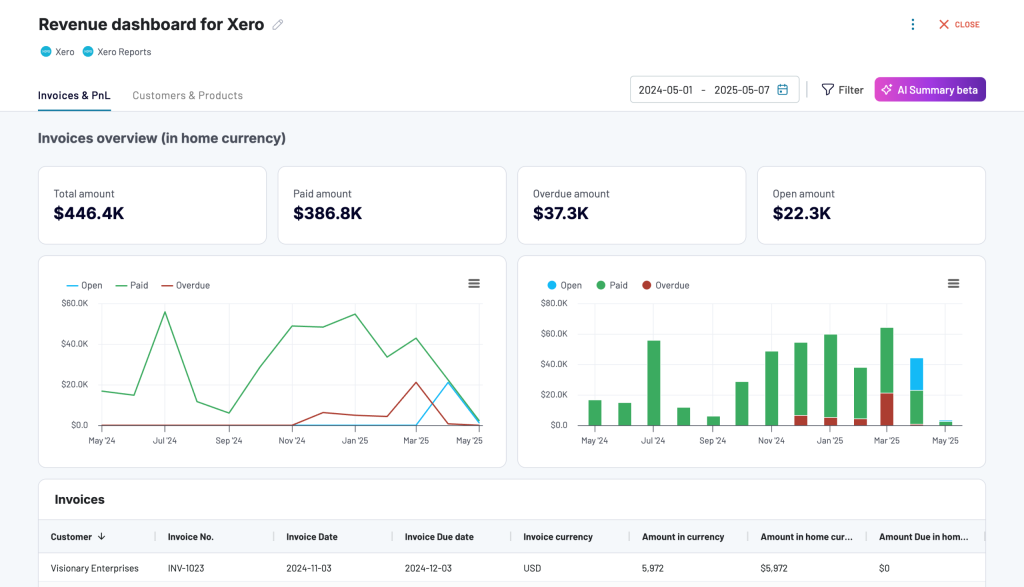
With all that, you can do reporting in a simple and customizable real-time dashboard like this one.
If you’re unsure, you can set up the rest of the financial data analytics pipelines — talk to the Coupler.io data analytics team to see whether we can help you in your business process use case.
How to analyze financial data
Now that you know how to use data analytics in finance and what tools to use, let’s explore how to create a data analytics solution for your business. Here’s a six-step plan to analyze financial data with a few optional steps.
Gather data sources
The first thing you have to do is gather all of your data sources in one place. Typically, even a small business may have several sources of first-party data that must be exported into your data warehouse before running analytics.
Get a list of all the data sources. For accounts receivable, the sources would typically include:
- Subscription management software
- Transaction management software
- CRM software
Sources for accounts payable may include:
- Payroll software
- Transaction management software
- Expense management software
- Advertising platforms
- Proprietary data
- Banking data
At this stage, you may also find a way to bring all this data together. You can do this with Coupler.io, an all-around tool for Stripe, QuickBooks, and Xero automation in terms of reporting. It can bring data from any source to any destination you might have, like a data warehouse or a BI tool, and do it automatically and on a schedule. You can also transform data before loading it into the destination app.
Create a plan for consolidating them
While you’re not joining all the data together just yet, you have to figure out how to do it before you run the analytics.
Data typically comes in different formats. One platform may use a comma for decimals, and the other may round them. Or they would use different date formats. You have to decide which format to use in your analysis.
Different data sources may also have different types of data values. For instance, one data input would include data points on the exact time of transactions or the other party’s bank, while the other would not.
You have to decide on what data to leave out of the dataset. Since you’re consolidating all the data in one storage facility, it should have the same set of data points. You may also choose to add more data to the set, for instance, making the source of it.
Pick the metrics you’ll be focusing on
Next, pick the metrics you’re going to calculate. You may mine the data for more insights, but reporting is a major part to analyze financial data, so choosing the right metrics is a necessary step.
For most businesses, you’d want to calculate at least these metrics:
- Gross & net profit margin
- Monthly or annual revenue
- Return on sales
- Operating cash flow ratio
- Total expenses
- Gross burn rate
Subscription-based software businesses may also calculate the following SaaS accounting and financial metrics:
- Monthly or annual recurring revenue
- Accounts receivable turnover ratio
- Profit margin
- Average revenue per account
For an ecommerce business, these metrics can also be included:
- Average customer spend
- Customer lifetime value
- Current accounts payable
- Payables and receivables ratio
You can choose to calculate only some of these that matter the most to you or calculate all of them and only show the relevant ones in your dashboard.
Create a report
When you’ve planned out your imports and your storage documents, you can start creating a financial report. You do this by connecting a data set to a pivot table, a chart, or running it through a formula to get a metric.
Whatever metrics you plan on adding to your financial report, find the formulas for them, and add them to a spreadsheet. The metric will be updated each time the data is refreshed with a new export.
To make a step from raw data to financial data visualization, you have to connect your data to a pivot table or a chart. If you’re not using a BI tool yet, the simplest way to do that is with Looker Studio. You can connect it to a source containing your data and set up a report.
You can use graphs to present the data or do it by simply presenting aggregate numbers. Consider adding a historical dimension to your dashboard — comparing new data to the historic one to add context to it.
The ability to apply filters to the report is also great, as it allows viewers to select the data that’s relevant to them.
Optional: automate the dashboard notifications
With the previous step, your basic financial analytics system is all set. But you could make it more sophisticated by automating the notifications.
With Coupler.io, your data pipeline is going to be fully automated. That means each day or each week, however, you set it up, the financial data will be exported to your warehouse, and your BI solution will update all the reports based on the new data.
To notify all the stakeholders, you can configure data alerts in it. In most BI tools, you can set up the system to alert users when specific requirements are met in the database. You could set up a notification (data alert) to come each time a specific KPI in your report is achieved. This way, you and your stakeholders won’t miss a significant milestone to consider. For instance, you could notify stakeholders when the sales plan for the month has been met, or each time daily sales exceed expectations.
Optional: do data mining to uncover trends
A more advanced solution to analyze financial data includes data mining to help you find trends in your financial data. Data mining is the process of sorting through big data to find patterns and trends.
These trends can show you new opportunities for growth that you can capitalize on by either fixing weaknesses shown by the data or doubling down on your strength.
Here are some ideas where you could start with financial data mining:
- Analyzing outlier data
- Cluster analysis
- Time series analysis
- Predictive analysis
- Correlation analysis
Performing data mining requires using algorithms, so to run these, you’ll either need a data analyst to write code from scratch or use specialized mining software. There are even add-ons for Google Sheets and Excel, in case you’re building a simpler data analytics solution.
Implement data analytics in finance
Financial data analytics is a must-have in any organization. Whether you run a small ecommerce business or a large agency, you want to know where your financials are heading and make the right decisions to accommodate it.
Automating the reporting also saves a lot of valuable time for your key employees that doesn’t have to be wasted on manual tasks like exporting and formatting spreadsheets.
Not sure you can create a financial analytics solution on your own? Contact Coupler.io’s data analytics consulting team and see how we can help. To learn more about this topic, check our article on revenue dashboards and financial dashboards.