
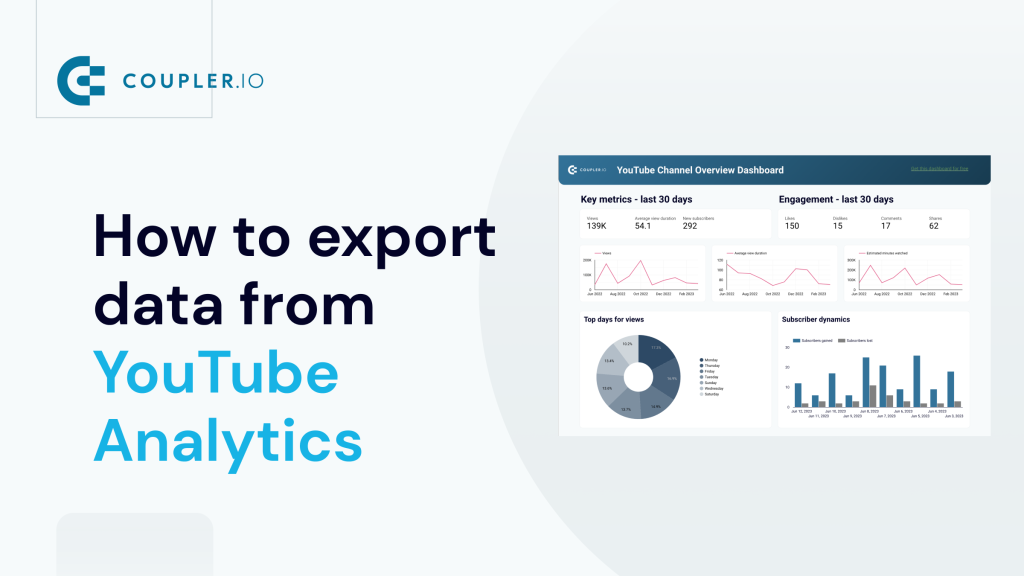
YouTube Analytics tracks how your channel performs across videos and Shorts. That includes views, watch time, subscriber changes, traffic sources, audience demographics, revenue, and engagement metrics like likes, comments, and shares. YouTube Studio works for checking these numbers. Many creators and marketers still need the data somewhere else: in cross-channel reports, blended with ad platform data, in dashboards for stakeholders, or in front of AI to spot content performance trends.
The most reliable way to export YouTube analytics data is to automate it. Below, you’ll discover how to set up and automate a Coupler.io data flow that refreshes on a schedule. You can feed the same data into ready-made dashboards or send it to AI for analysis. If you only need a one-off file or prefer a Google-native option, the manual export, Data Studio’s native connector, and BigQuery Data Transfer Service are covered after that.
How to export YouTube analytics data automatically on a schedule
Coupler.io, a data integration platform and AI analytics solution, allows you to connect YouTube Analytics and pick and organize the metrics you need. You can also send them to spreadsheets, BI tools, data warehouses, or AI tools. Scheduled refreshes keep that data up to date, so you set it up once and skip the weekly re-exports. The process takes three steps, and you can follow along in a separate tab.
Step 1: Collect your data
Start with YouTube and add other channels when you need them. Coupler.io connects to 400+ sources, so if you also track performance on TikTok or Instagram, or run Google Ads alongside YouTube, you can pull those into the same workflow.
The source is pre-selected as ‘YouTube’. Select the data destination in the form below and continue.

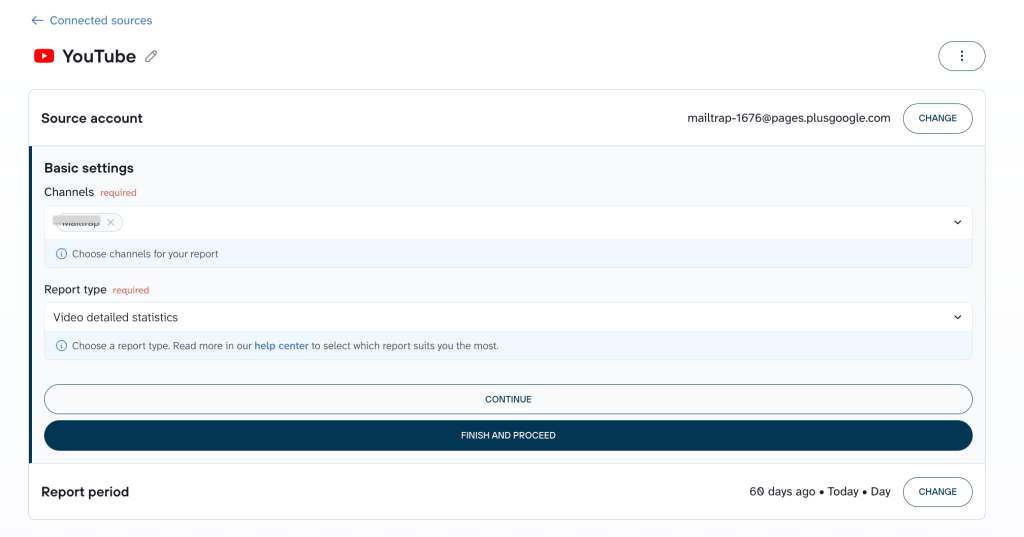
Now, create a Coupler.io account for free without any credit card required. If you already have one, you can simply log in. Next, you need to connect your YouTube account and set up the source settings.
- Basic settings – select the YouTube channel from the dropdown. You can select more than one too.
- Report period – select the start date and end date for a specific time period.
- Metrics and dimensions – select all the metrics data you want to include in the YouTube analytics export.
- Advanced settings – select the currency.

Step 2: Organize and transform data
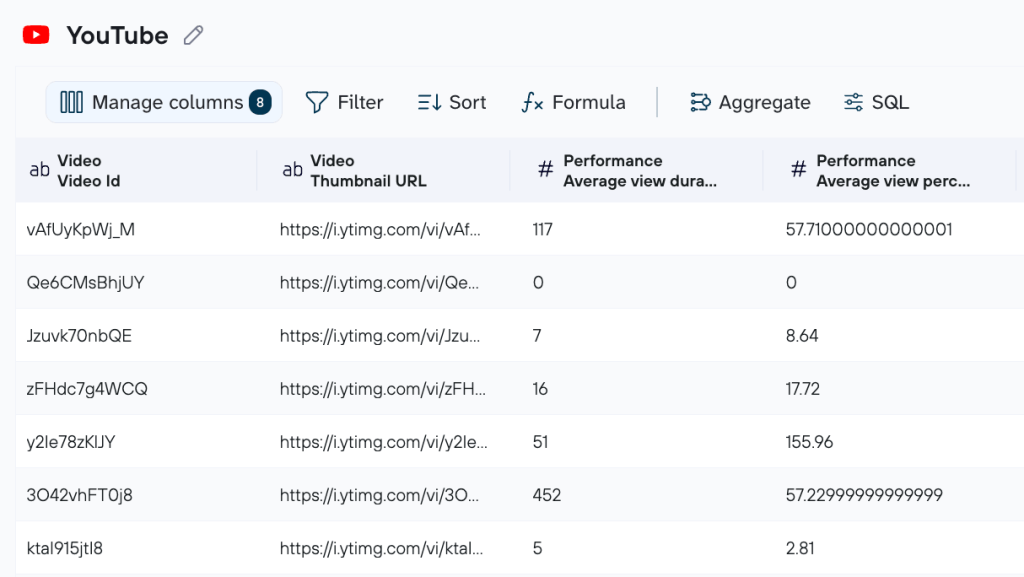
The columns and filters you set in this step control what every downstream tool sees, including AI. Coupler.io has a few data transformation options:
- Column management – Hide unnecessary columns and only keep key metrics useful for your analysis. Hiding dimensions you don’t report on also keeps AI analysis focused on the metrics that matter for your channel.
- Filtering data – Focus on specific segments of data with filters. For example, YouTube videos with >10,000 views.
- Sorting data – Sort your data to identify the highest and lowest-performing videos based on different metrics.
- Custom formulas – You can create new columns like the engagement rate by adding the likes, comments, and shares divided by the total number of views.
You can also add business context for your data analysis, such as what each metric means or how your channel defines “engagement.” When you ask AI questions later, it uses this context to interpret your data correctly.
AI never connects to your YouTube account directly. It works only with the structured dataset you build here.

Once your data looks right, set up the destination. Step 3 covers scheduling, and the full list of destinations is in the section below.
Step 3: Schedule updates
Scheduled refreshes keep your YouTube reports up to date without re-running exports by hand. Turn on automatic data refresh, then choose the time preferences, timezone, and days of the week. You can send data from YouTube as often as every 15 minutes.
A single data flow can also send the same YouTube data to several destinations at once, for example Google Sheets, Data Studio, BigQuery, and an AI tool, so every report works from the same refresh.

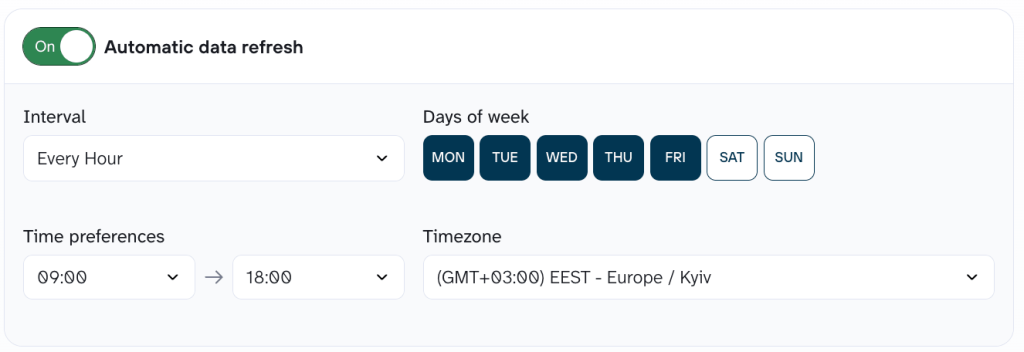
With scheduled updates, you’ll always have near real-time data that’s ready for analysis.


Get reliable YouTube performance analysis with Coupler AI
Get started for freeBonus step: Analyze YouTube data with AI
Dashboards show how your channel is trending. A follow-up question, like why a video stalled after its first week, is easier to answer by asking it. With Coupler.io’s AI Agent, you can ask about your YouTube performance in plain language inside Coupler.io, on the data flow you just built. It needs no extra setup.
Behind each answer, Coupler.io’s Analytical Engine does the math. It queries your YouTube dataset, runs the calculations, and hands the AI only the calculated numbers. The AI’s job is to explain what those numbers mean for your channel.
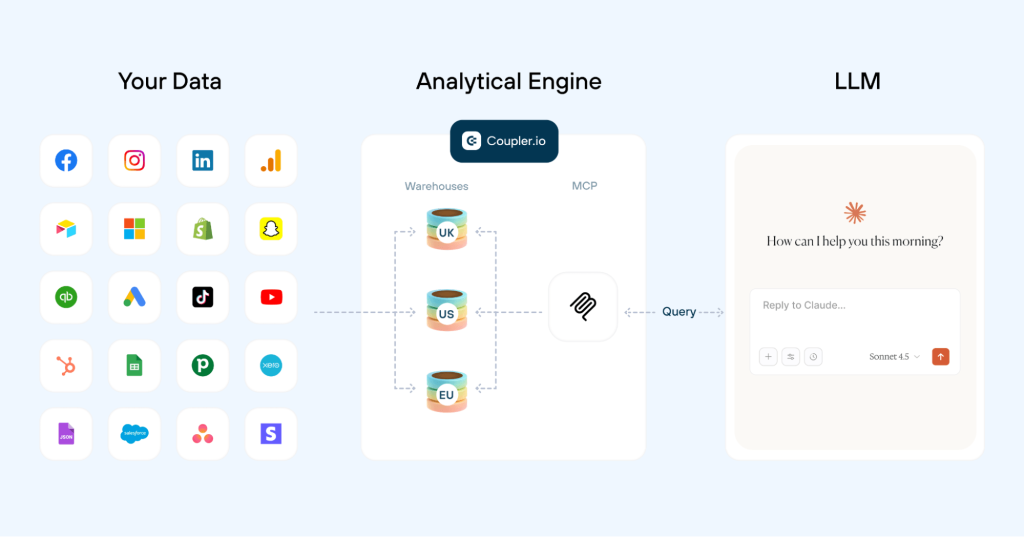
A few prompts to start with:
- “Which videos had the highest watch time but lowest subscriber conversion in the last 90 days?”
- “Compare my Shorts performance to long-form videos this month: views, engagement rate, and subscriber change”
- “What traffic sources drove the most views last quarter, and how has the mix changed from the previous quarter?”
- “Show me videos where average view duration dropped below 30% of total length. What topics do they cover?”
- “Which upload day and time correlates with the highest first-48-hour view counts?”
If you run the same kind of analysis regularly, AI Skills, pre-built analysis procedures, save you from writing prompts from scratch. The marketing-analytics skill covers channel performance analysis and content trend detection. The report-generation skill formats the output into a report with a summary, key metrics, and recommendations. Skills also work in external AI tools connected via MCP.
Prefer working in Claude, ChatGPT, Gemini, or another AI tool? AI Integrations connect your YouTube data flow to external AI tools over MCP, with the same structured data and calculated results behind every answer. The YouTube MCP page lists the supported tools, and our guide on how to connect YouTube to Claude walks through the setup.
Keep in mind: AI sees only the data you prepared in Step 2. The columns you hid and the filters you applied also apply to AI analysis. YouTube Analytics data is aggregated at the channel and video level and has no viewer-level personal data. You still decide how much of it AI can access.
Where you can export YouTube analytics data with Coupler.io
Coupler.io sends YouTube data to five types of destinations. The right one depends on what you plan to do with the data.
- Spreadsheets: Google Sheets, Microsoft Excel. Good for ad hoc analysis, custom calculations, or sharing a simple video performance table with your team.
- BI and dashboard tools: Data Studio (recently renamed back from Looker Studio), Power BI, Tableau, Qlik, monday.com. Use these for visual channel reports and stakeholder dashboards that refresh on their own. The dashboard templates below are built for Data Studio and Power BI.
- AI tools: Claude, ChatGPT, Gemini, Perplexity, Cursor, OpenClaw, via AI Integrations. Use these to ask questions about your content performance in the AI tool you already work in.
- Data warehouses: BigQuery, PostgreSQL, Redshift. Use these to store long-term channel history and join YouTube data with other business data in SQL.
- Other: JSON, CSV. Use these to pass data to custom apps, scripts, or tools without a native connector.
Instant YouTube performance analysis with ready-to-use dashboards
Ready-to-use YouTube dashboard templates are a good starting point if you’re new to building reports. Follow the steps in the readme tab to connect a template to your account and populate it with your data. Check out the white-label templates by Coupler.io for analyzing YouTube performance.
YouTube dashboard template
This YouTube analytics dashboard template is designed in Data Studio and consists of a few reports. The first one is an overview of channel performance metrics. You can track views, likes, dislikes, average view duration, playlist watch time, new subscribers, and other engagement metrics.

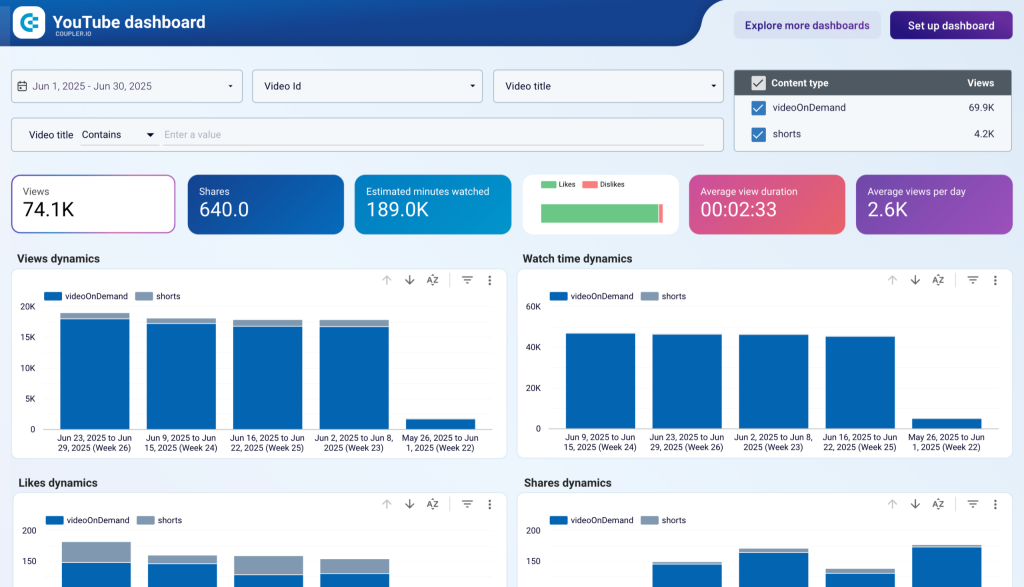
The second report is dedicated to the analysis of subscribers: how they get to watch your channel, what the subscription dynamics look like, and so on. The third report contains insights into your channel reach. And the fourth report dives into traffic sources showing the top search keywords, URLs, and related videos.
You also get a complete view of all the individual videos uploaded on the channel with performance metrics. The audience segmentation by demographics, subscriber status, traffic source, country, and device type can be used to understand your content performance better and create a content strategy accordingly.
YouTube KPIs dashboard template
This is a one-page dashboard that focuses on YouTube channel KPIs. It provides an overview of the major metrics and displays the dynamics of views and likes. The dashboard has a section dedicated to the last 60 days of channel performance. Here you can see pie and bar charts showing different top selections such as top videos, keywords, sources, etc.
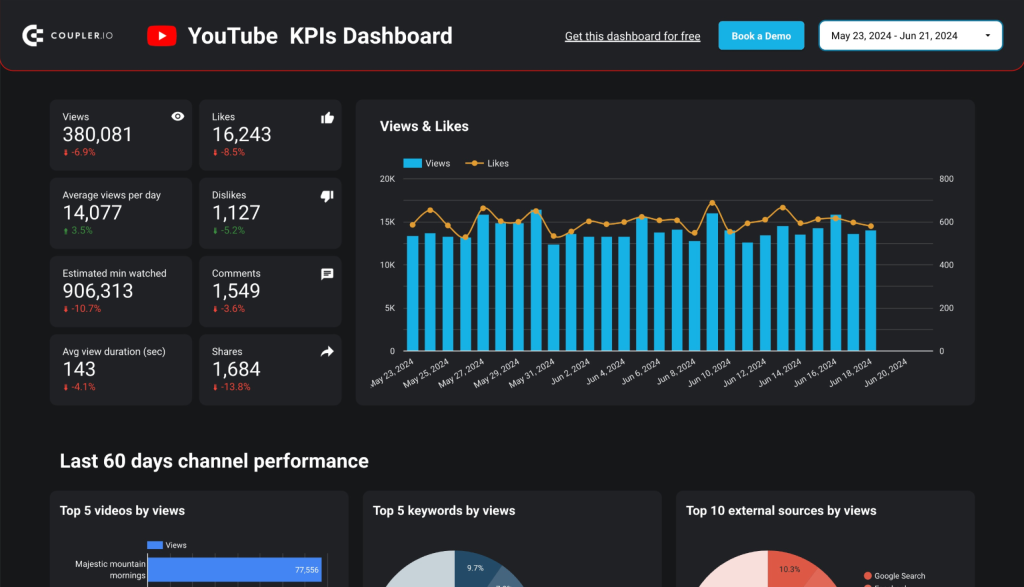
At the bottom of the page, there is a breakdown of video performance by the key metrics, including views, likes, shares, subscriber change, and so on. The template is also designed for Data Studio, and you can start using it by connecting your YouTube account.
YouTube analytics dashboard template for Power BI
If your reporting stack runs on Power BI, Coupler.io offers a standalone YouTube analytics dashboard built for that environment. It pulls data from YouTube Analytics and organizes it across four pages: Overview, Detailed video stats, Stats by country, and Traffic sources.

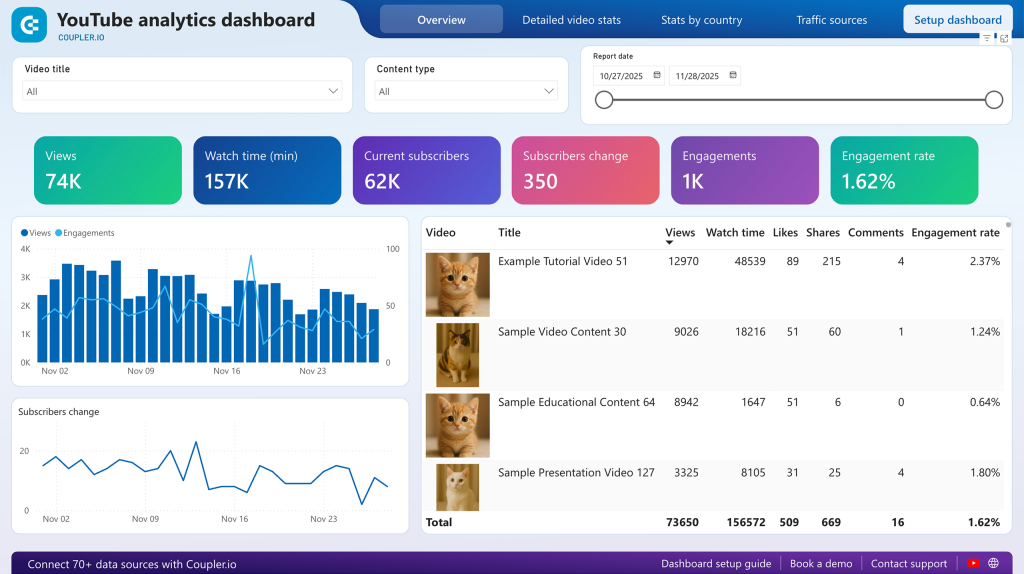
The Overview page pairs daily views and engagements on the same timeline, so you can spot videos that attracted clicks but failed to hold attention. A subscriber change chart below it traces net gains and losses back to specific publish dates. The Detailed video stats page adds average view percentage and content type classification. It’s useful if you need to separate Shorts performance from long-form videos.
Other ways to export YouTube analytics data
Coupler.io covers the automated path. Maybe you need a one-off CSV from YouTube Studio, a native Data Studio connection for customized YouTube dashboards within the Google ecosystem, or raw channel reports in BigQuery through Data Transfer Service. The sections below walk through each of these.
| Solution | Google Sheets | Data Studio | BigQuery | Power BI | AI tools | Other destinations |
| Coupler.io | ✔️ | ✔️ | ✔️ | ✔️ | ✔️ | ✔️ |
| Manual export | ✔️ | ❌ | ❌ | ❌ | ❌ | ❌ |
| Native Data Studio connector | ❌ | ✔️ | ❌ | ❌ | ❌ | ❌ |
| BigQuery Data Transfer Service | ❌ | ❌ | ✔️ | ❌ | ❌ | ❌ |
How to export your data from YouTube Analytics manually
If this is a one-time task, then to export YouTube analytics data to Google Sheets manually is the best cost-free method. To get started, log in to YouTube Studio.
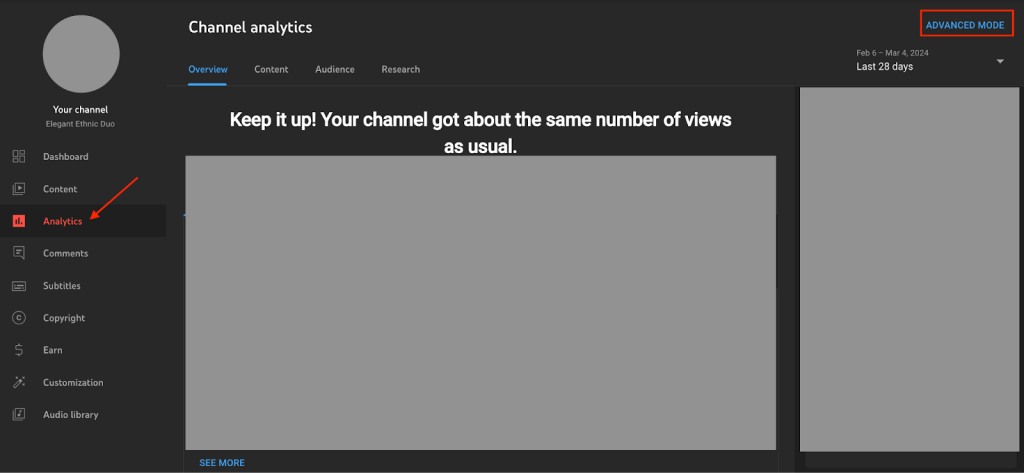
Click on ‘Analytics’ from the list on the sidebar. Now click on the ‘advance mode’ at the top right of the screen to view the different reports of your YouTube channel.

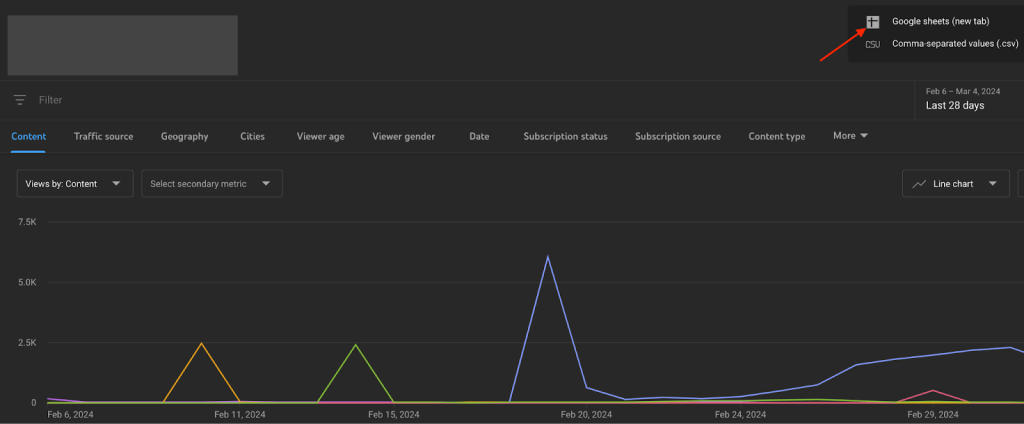
You can select the type of YouTube Analytics report you want to export to Google Sheets and click on the download sign to download reports. Choose the ‘Google Sheets (new tab)’ option to export the current view.

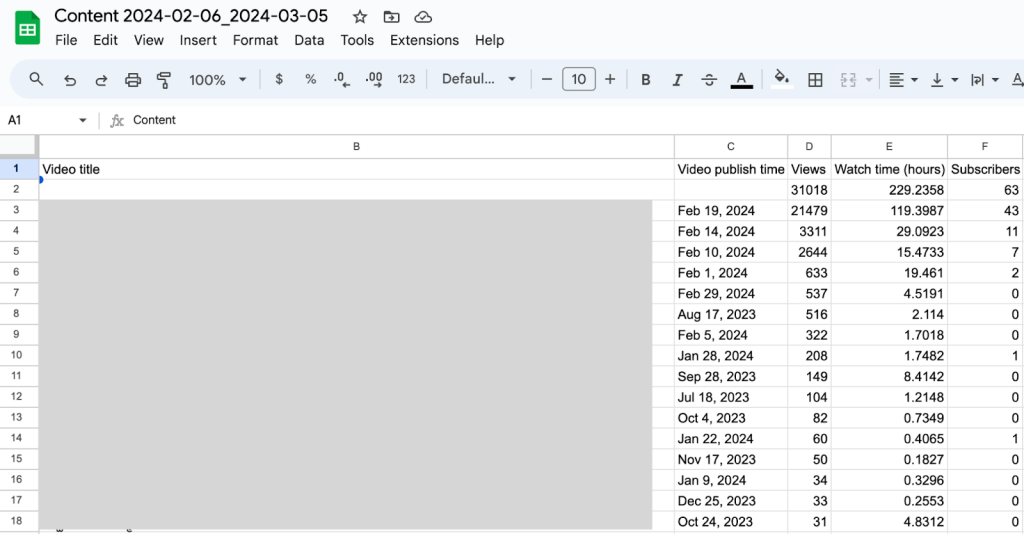
Now, you can see the report data in a Google Sheets spreadsheet like this. It can be used for further analysis within Google Sheets or moved to another application.

For different reports, you need to manually export it multiple times which can be time-consuming and lead to manual errors.
Export your data using Data Studio connector
Let’s explore another potential destination, Data Studio, to visualize and understand YouTube analytics data at a granular level. You can connect YouTube analytics to Looker Studio with a native connector.
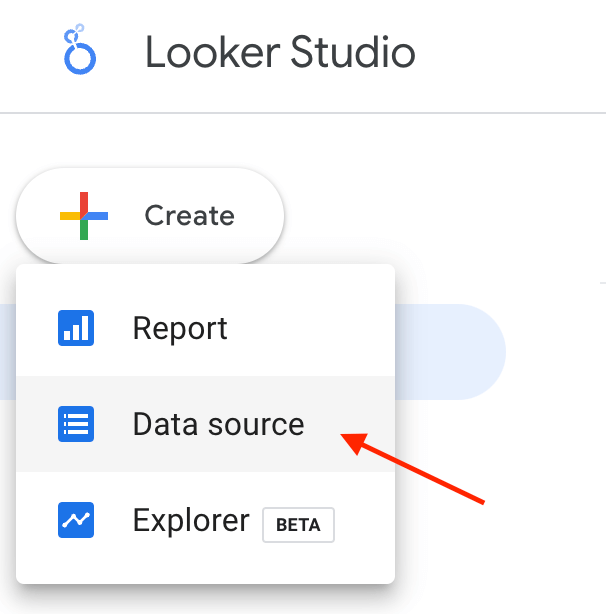
Start by signing in to Data Studio. On the home page, click on the Create icon, and choose Data Source.

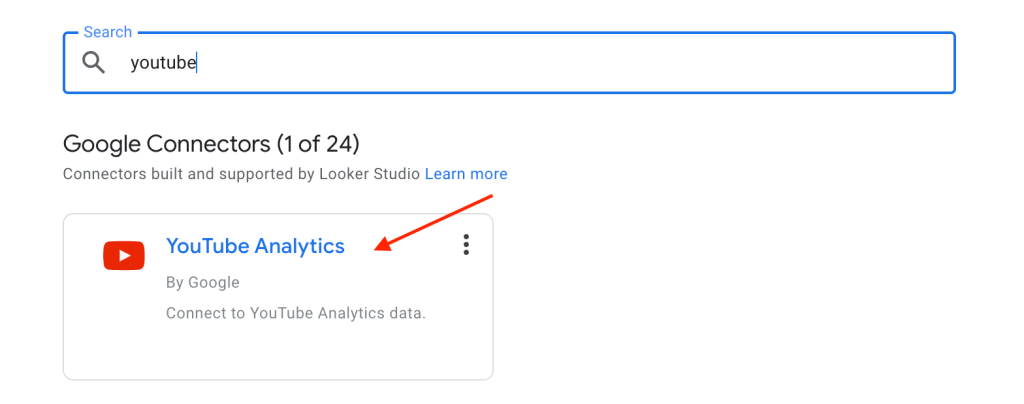
Select the YouTube Analytics connector.

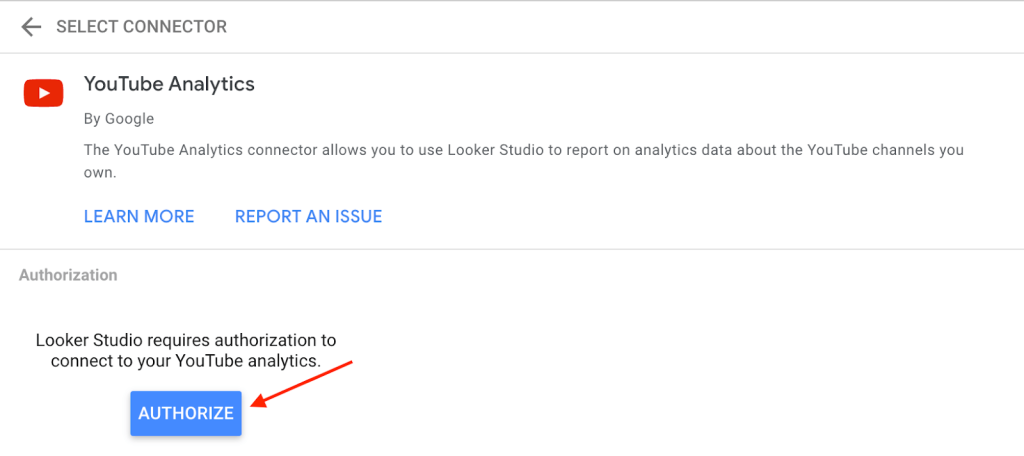
Click Authorize to let Data Studio access your YouTube account. You can withdraw this permission at any time.

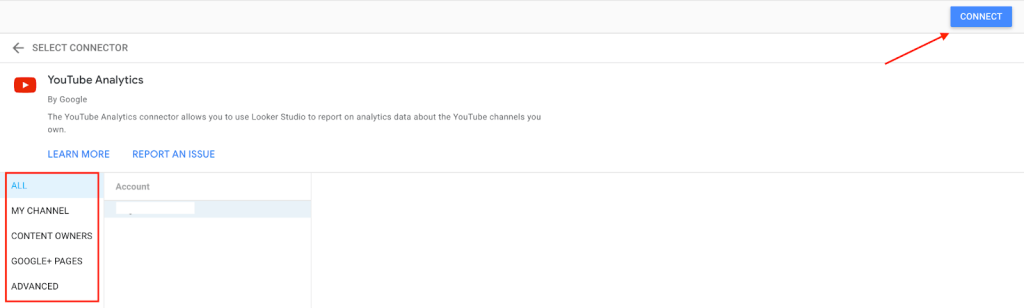
Click Connect in the top right corner. You’ll see the data source fields panel, indicating your dataset is now linked.
- All – Lists every account and channel you can access.
- My Channel – Shows channels linked to your current Google account.
- Content Owners – Lists all YouTube content owner accounts you can access and lets you select channels.
- Google+ Pages – Accesses data via an associated Google+ page, useful for team management of a channel.
- Advanced – Allows you to directly specify a channel or content owner ID.

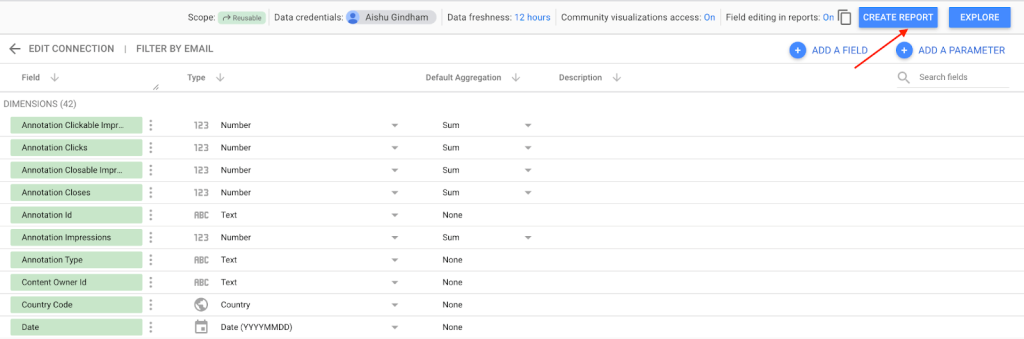
Use the data source fields panel to customize your data by renaming fields, adding descriptions, creating calculated fields, and adjusting data types and aggregations. In the upper right, click Create Report to open the report editor.

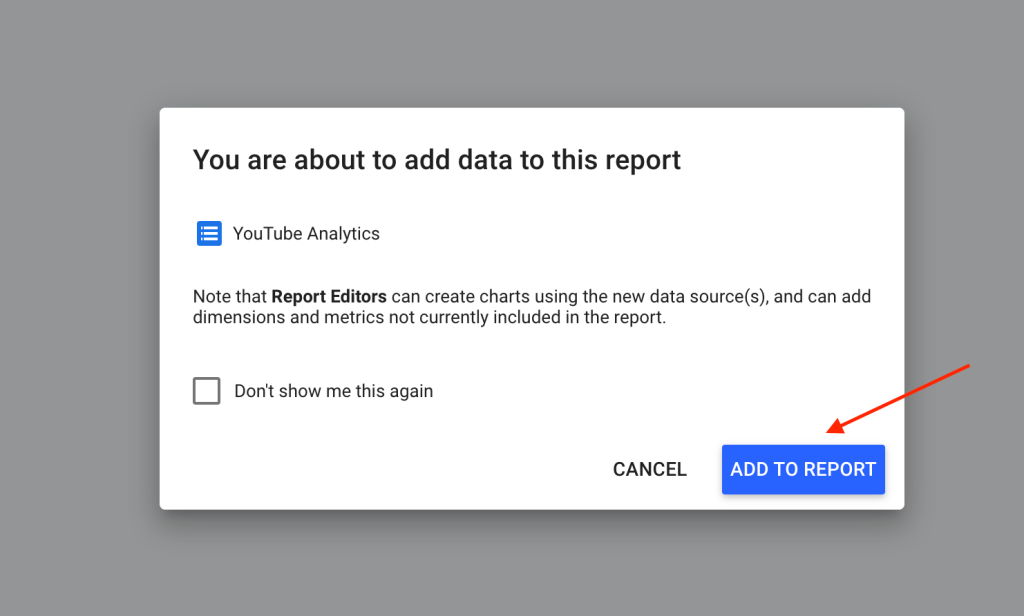
Click Add to Report to use this data source in your report, and start creating visualizations.

For those new to Looker Studio or seeking to enhance their reporting skills, check out this tutorial on Looker Studio visualization.
Export YouTube channel reports to BigQuery with Data Transfer Service
If you want to store all your YouTube channel data in one place, then BigQuery is the right destination. You can export the YouTube reports to BigQuery automatically with a minimum frequency of 24 hours. With complex queries, you can conduct in-depth analysis in BigQuery like pattern recognition, time series, forecasting, and more. Follow the steps below to export YouTube channel reports to BigQuery natively.
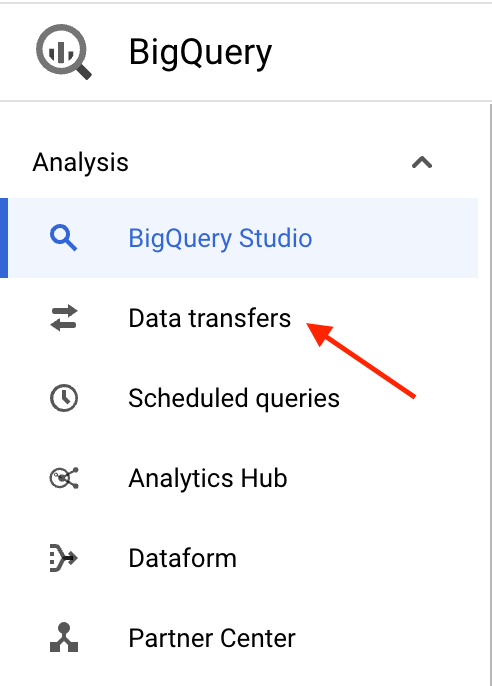
Open the Cloud Console and select BigQuery in the left-side menu. Navigate to Data Transfers.

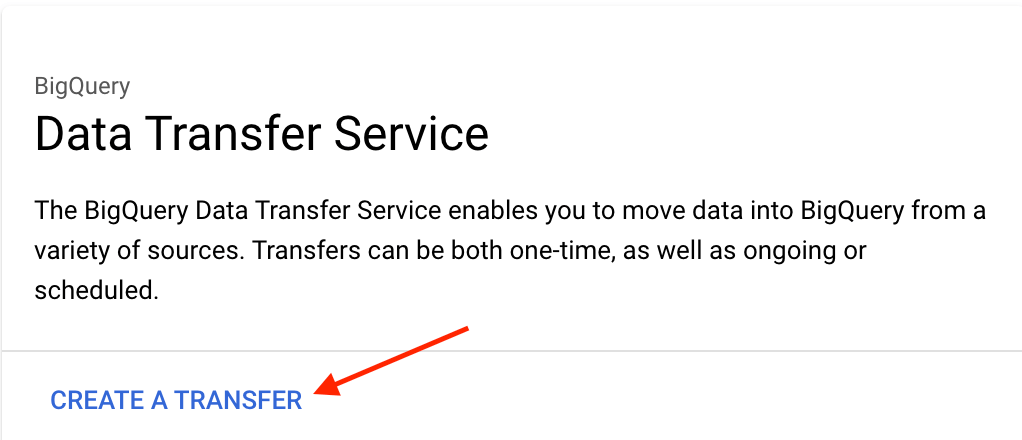
Click to activate the BigQuery Data Transfer API if it’s not already enabled. Select Create transfer.

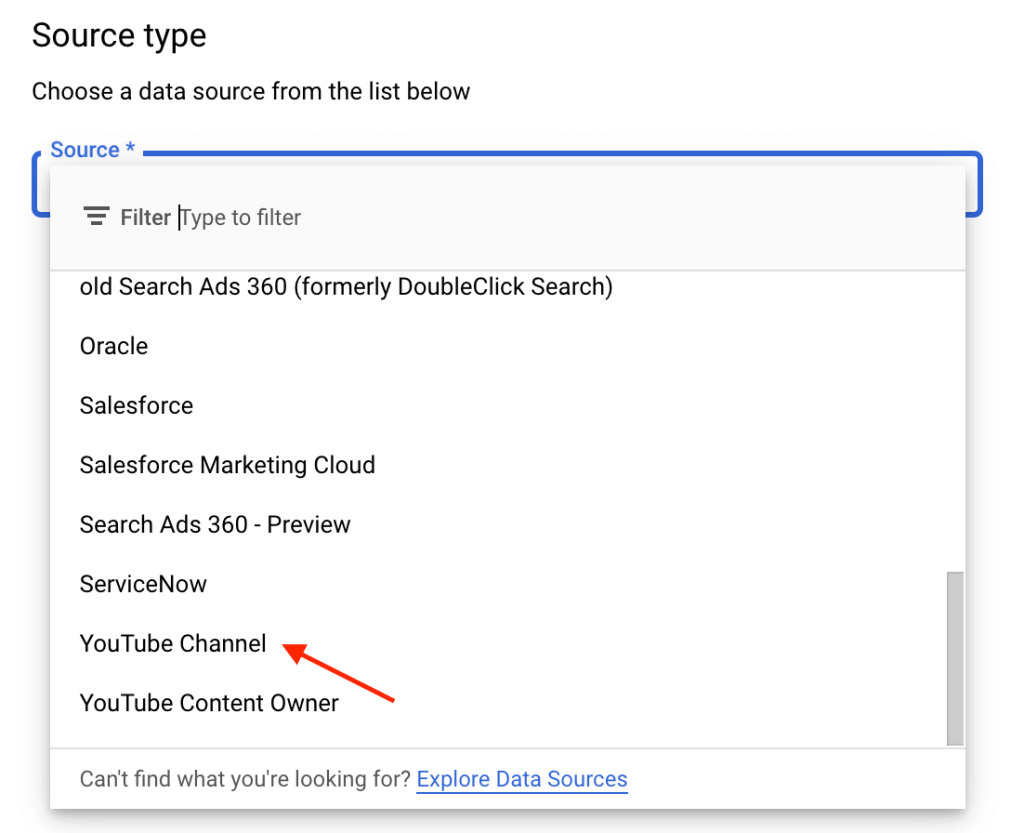
From the drop-down list, choose YouTube Channel as the source of the data transfer.

Configure your transfer by setting a display name for the source. Decide on a schedule for the data imports. You can start the first import immediately or schedule it for a future date. Choose the dataset where you want to import your YouTube data and specify a table suffix. This helps in organizing the data, especially if imported from multiple sources.

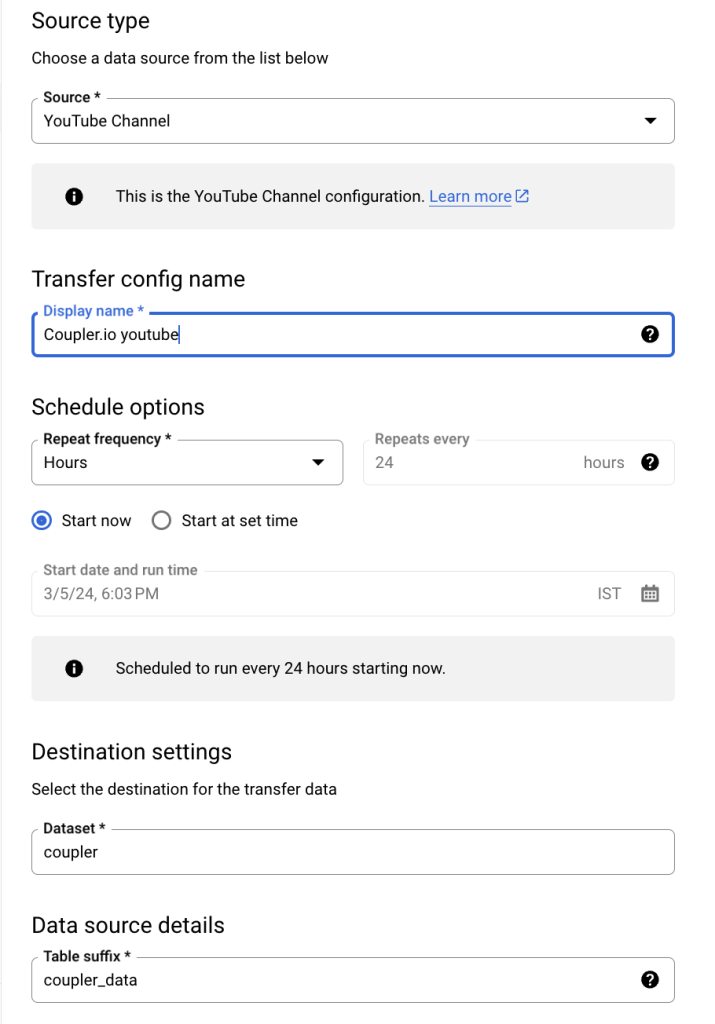
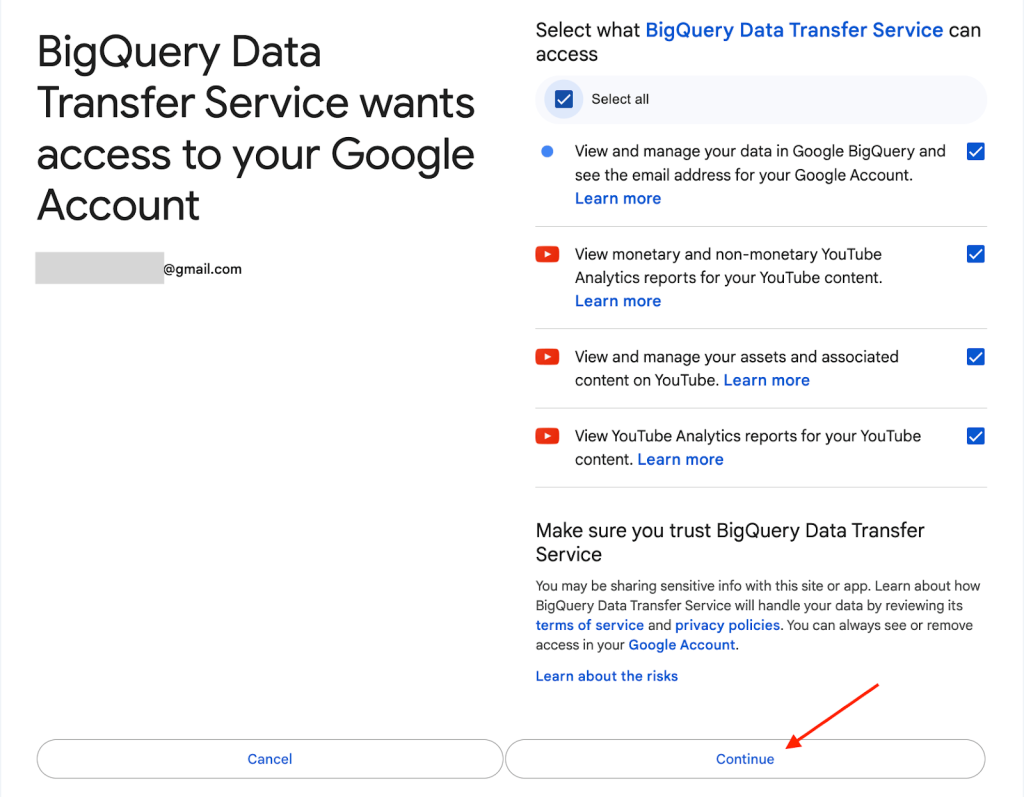
Optionally, enable email notifications to be alerted if a transfer fails. After configuring your transfer settings, click Save. A pop-up will appear, requesting permission to access your source account. Grant the necessary permissions.

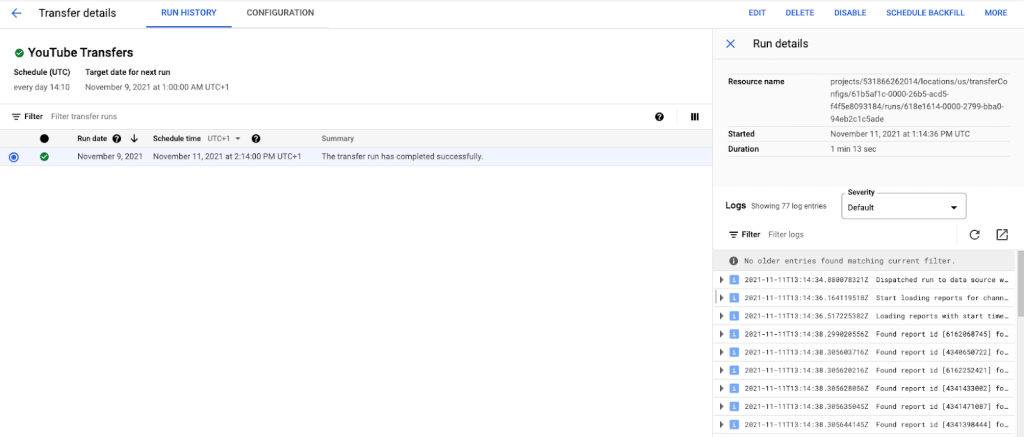
After authorization, if you select the Start Now option, your data import will begin automatically. The time it takes will vary based on the data size.

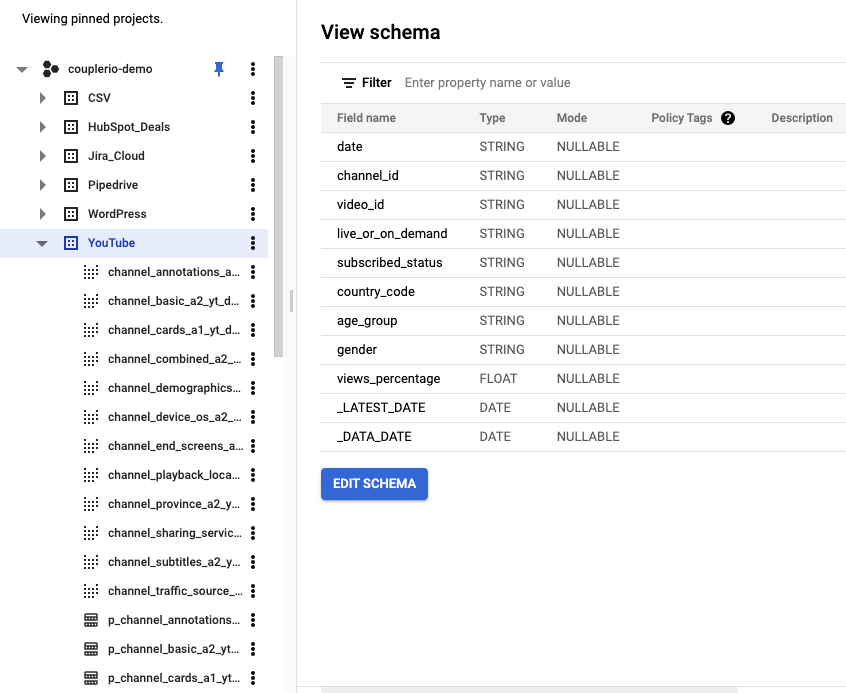
Return to your BigQuery dashboard to see the newly created tables from your import. This confirms the data has been successfully transferred.

If any data is missing or you wish to import historical data, you can schedule a backfill.

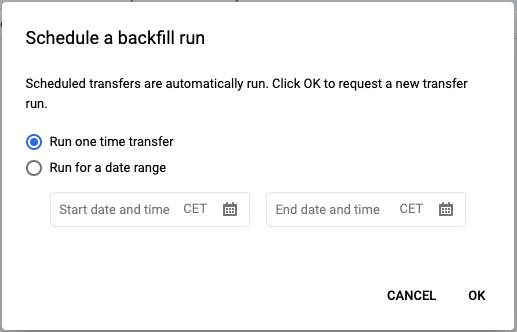
Go to the Transfer Details window, click Schedule Backfill in the top-right corner, and choose between a one-time transfer or pulling data from a specific date range.
Automate data export with Coupler.io
Get started for freeBest way to export your data from YouTube analytics
The best way to export YouTube channel analytics data depends on your needs, expertise, resources, and where you want to export these to. For simple and one-time analysis, you can manually export the YouTube analytics to Google Sheets. For in-depth analysis and visualization, you may consider BI tools and connect YouTube analytics to BigQuery or Looker Studio.
However, exporting YouTube data to these platforms natively can be complicated and requires technical skills. To easily send YouTube data to any destination, try Coupler.io. Set it up once in a few simple steps and it exports data on a schedule automatically. Moreover, Coupler.io supports other data sources and lets you export data from Vimeo, ad platforms, marketing apps, and more. This is an ideal solution for omnichannel reporting.