You send the monthly pay per click report, which includes spend, clicks, conversions, and a dashboard link. The client replies: “Should we increase the budget?”
If answering means reopening three ad platforms and building another spreadsheet plus five charts, your reporting process still has a gap. You’ve collected the results, but the client needs help deciding what to do with them.
A useful PPC client report makes that decision easier. It shows progress against the goal, explains where performance changed, and sets out what you’ll do next. Ask what is a PPC report meant to do, and the answer is this: when a follow-up question comes in, you should be able to investigate it without rebuilding the report.
Coupler.io keeps your ad-platform data connected and refreshed, so you can spend less time stitching exports together and more time explaining PPC reports for clients. Read on to learn how to build a PPC reporting structure with metrics worth explaining, and how to use templates and AI to prepare the report and answer the questions that follow.
What is a PPC report, and what should it tell your client?
A PPC client report summarizes paid advertising performance across ad accounts and channels over an agreed period and explains what the results mean for the client’s business.
It can cover Google Ads, Microsoft Ads (formerly Bing Ads), Meta Ads (including Facebook Ads), LinkedIn Ads, TikTok Ads, and other paid channels. Agencies often group these under PPC reporting.
Whether you call it a PPC report or a pay per click report, it should answer four questions:
- Business impact: Did the campaigns generate the leads, customers, or revenue we wanted?
- Strategy: Which audiences, offers, and channels are contributing to that goal?
- Budget efficiency: Are we spending as planned, at an acceptable cost per result?
- Campaign performance: What should we keep, change, or investigate?
The depth depends on the reader.
A founder might need the revenue result and a budget recommendation based on their return on ad spend (ROAS) and cost per acquisition (CPA) in a quick view. A marketing lead wants more granular metrics to understand campaign breakdowns and test results. They also need to ask follow-up questions in a chat interface between PPC reports for clients.
Answering those questions gets harder when the results are spread across Google Ads, Meta Ads, LinkedIn Ads, and the client’s CRM. Coupler.io brings that data together and refreshes it on a schedule. With Coupler AI, you can then ask follow-up questions in plain language without preparing another set of exports.
When clients can check an updated dashboard themselves, they don’t have to ask you for every performance update. Social Unit used Coupler.io to consolidate cross-channel PPC data and build refreshed client dashboards. The result was a 60% reduction in client inquiries about results, giving the agency more time for analysis and recommendations.


Unify client ad data across channels with Coupler.io
Book a demoWhat to include in a PPC client report
When building PPC reports for clients, use the following five sections as your repeatable structure. Keep the order consistent so clients know where to find the answer each month.
Here’s what efficient PPC report templates should cover:
Campaign goals and reporting context
Start with the client, cadence, reporting period, comparison period, and business objective. Add the budget and the target used to judge performance.
For example:
- Report type: Monthly
- August 1–31, compared with July 1–31.
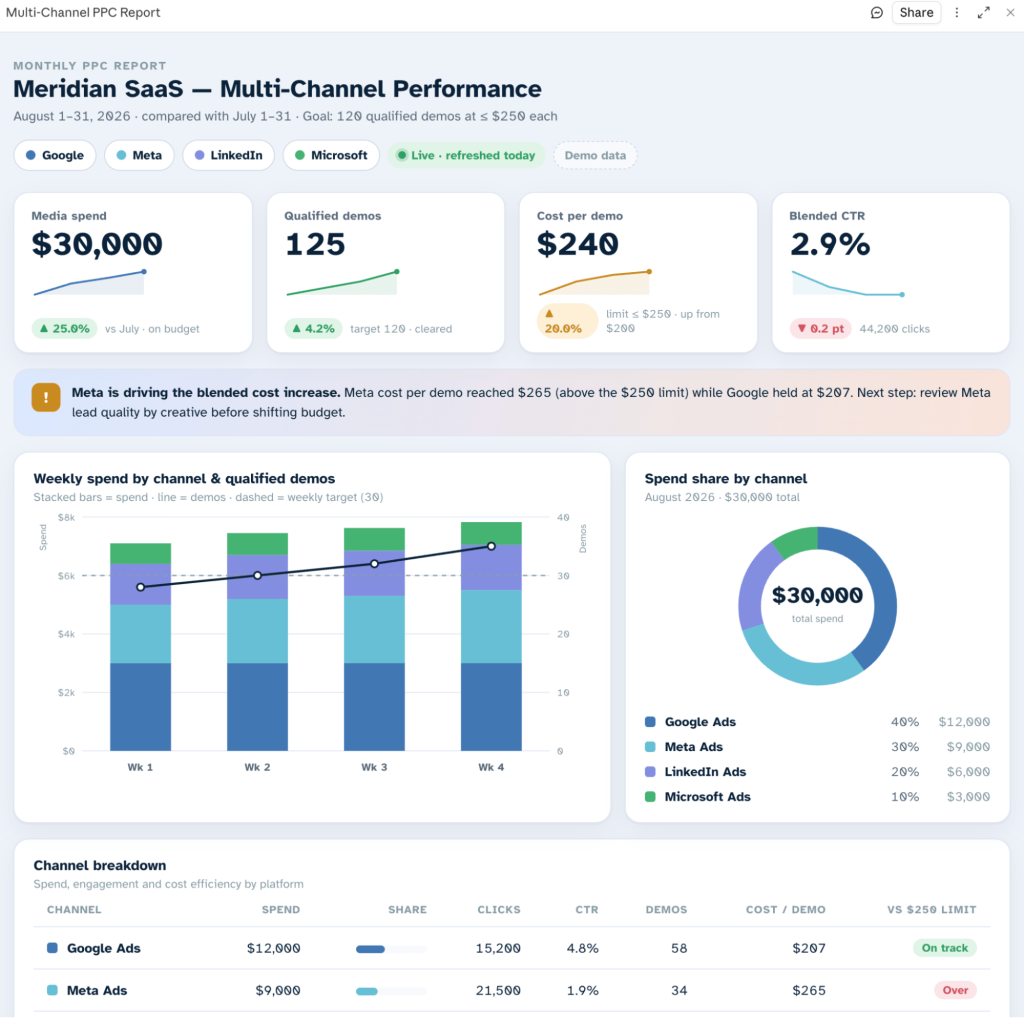
- Goal: 120 qualified demo requests at no more than $250 each.
- Monthly media budget: $30,000.


Define “qualified” and identify the source of that number. A form submission recorded by an ad platform and a sales-qualified lead in your CRM are different outcomes.
Include context that affects the comparison: a promotion, a budget change, a new landing page, or a tracking interruption.
Show when the data was last refreshed, and flag any recent conversions that may still arrive after the reporting cutoff. Coupler.io shows the last refresh timestamp on each data flow, so you can check how fresh the numbers are before sharing the report.
Executive summary
The executive summary should read like a quick performance recap and highlight the overall results. Keep it to one short paragraph and focus on three to five headline numbers, plus the main next step.
Here’s a PPC report example using fictional numbers:
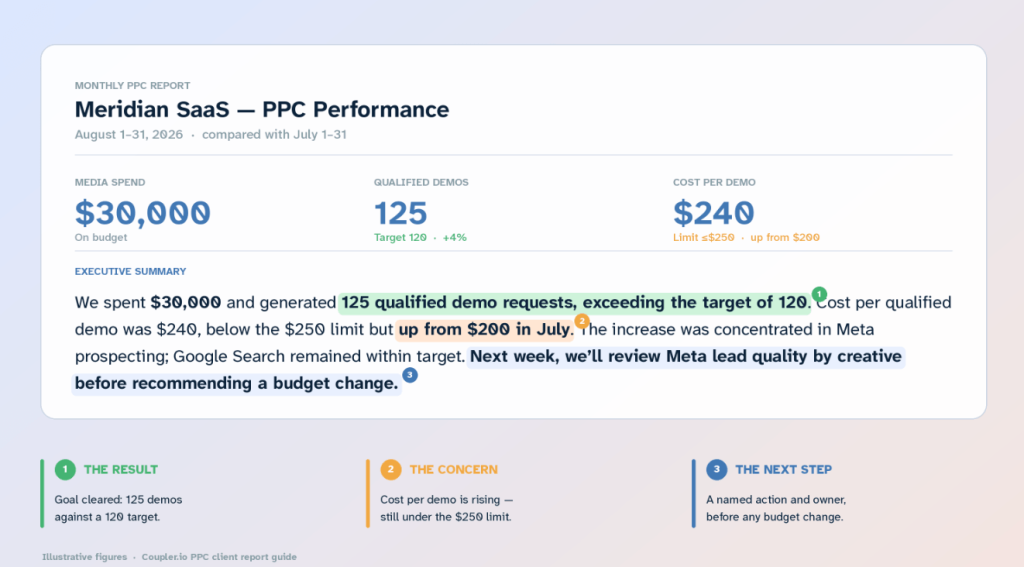
We spent $30,000 and generated 125 qualified demo requests, exceeding the target of 120. Cost per qualified demo was $240, below the $250 limit but up from $200 in July. The increase was concentrated in Meta prospecting; Google Search remained within target. Next week, we’ll review Meta lead quality by creative before recommending a budget change.
A good executive summary lets the client see the result, the concern, and the planned response without opening another tab.

Top-line PPC KPIs
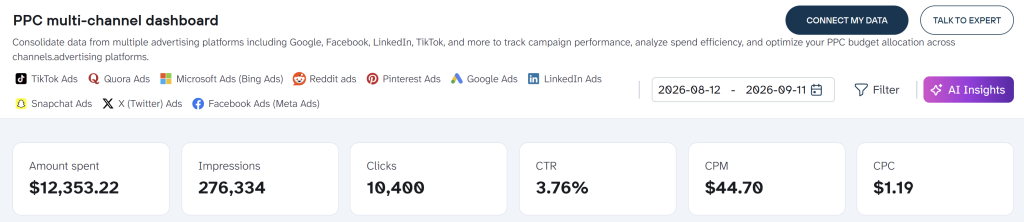
Show each of the primary PPC report metrics alongside its target and previous-period value. A number alone leaves the reader guessing whether it’s good.

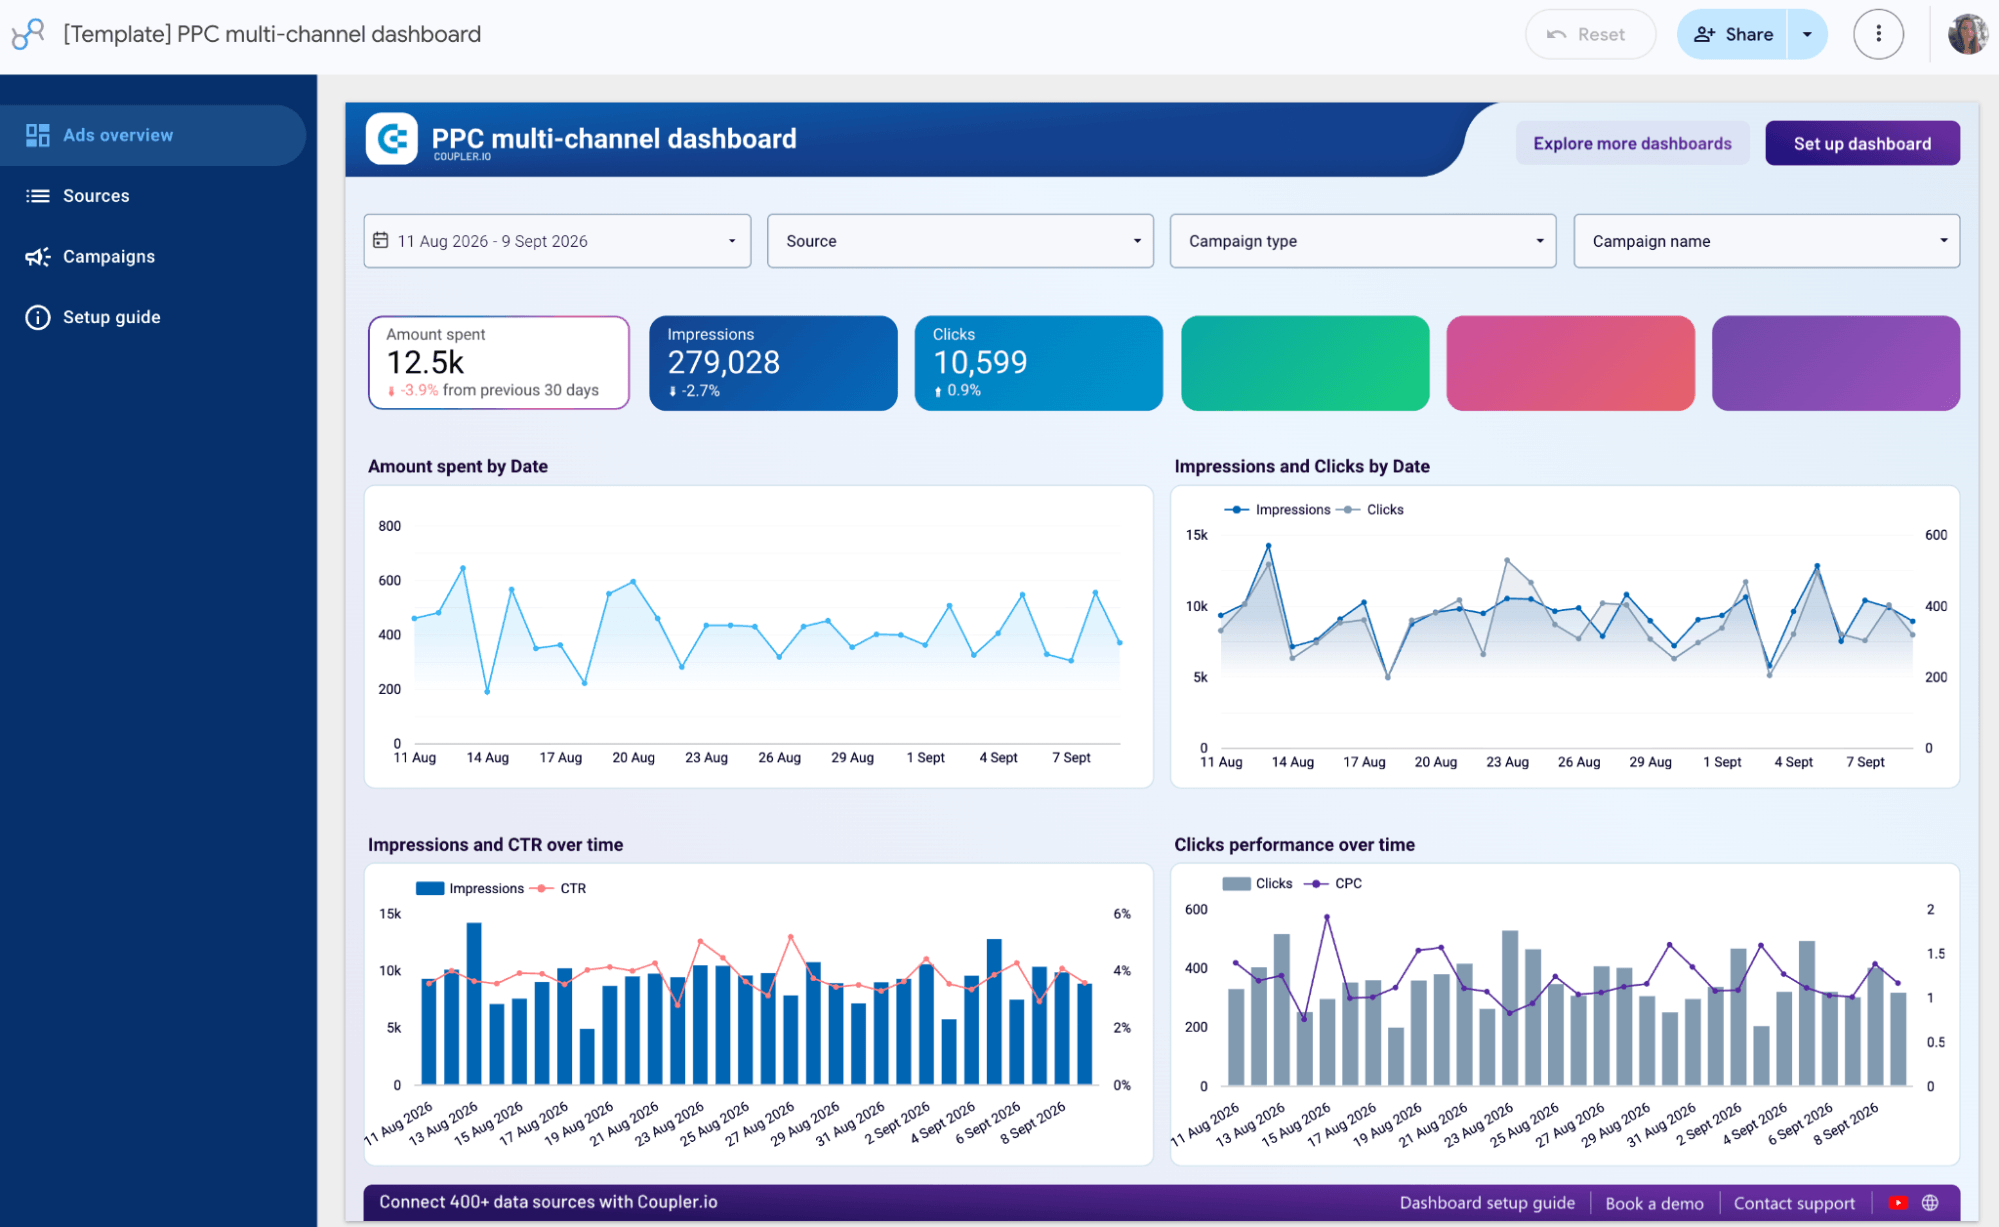
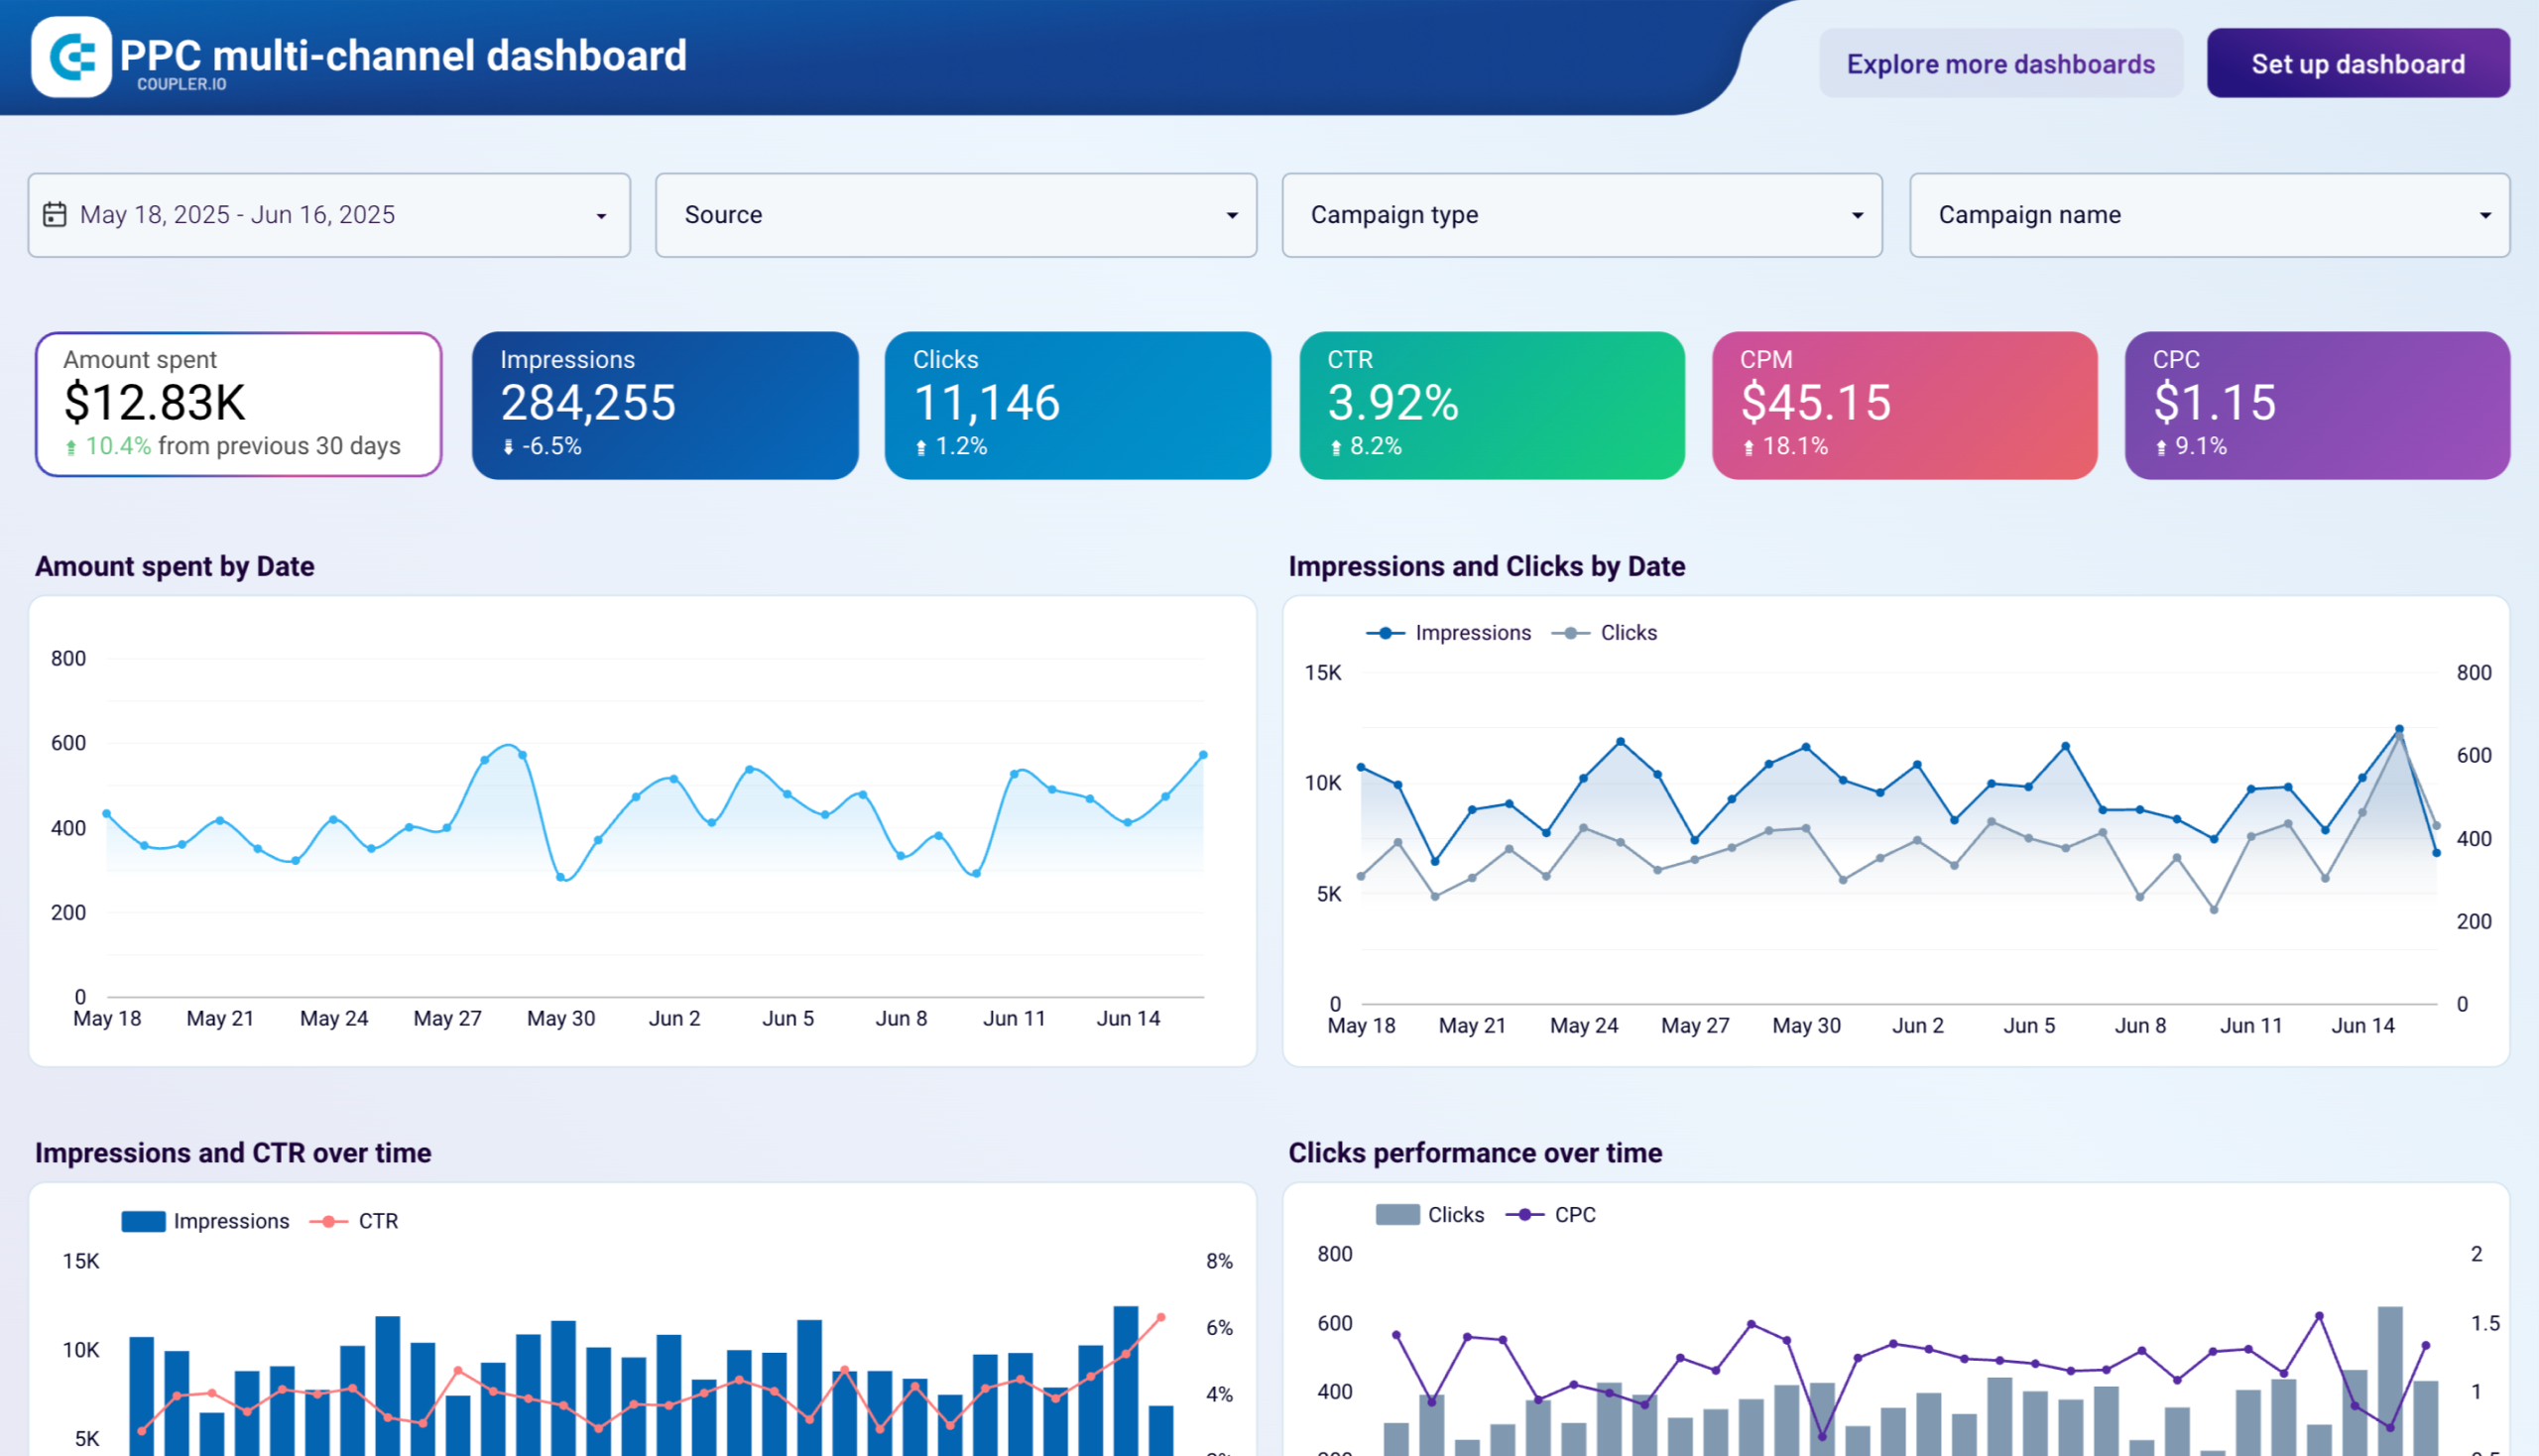
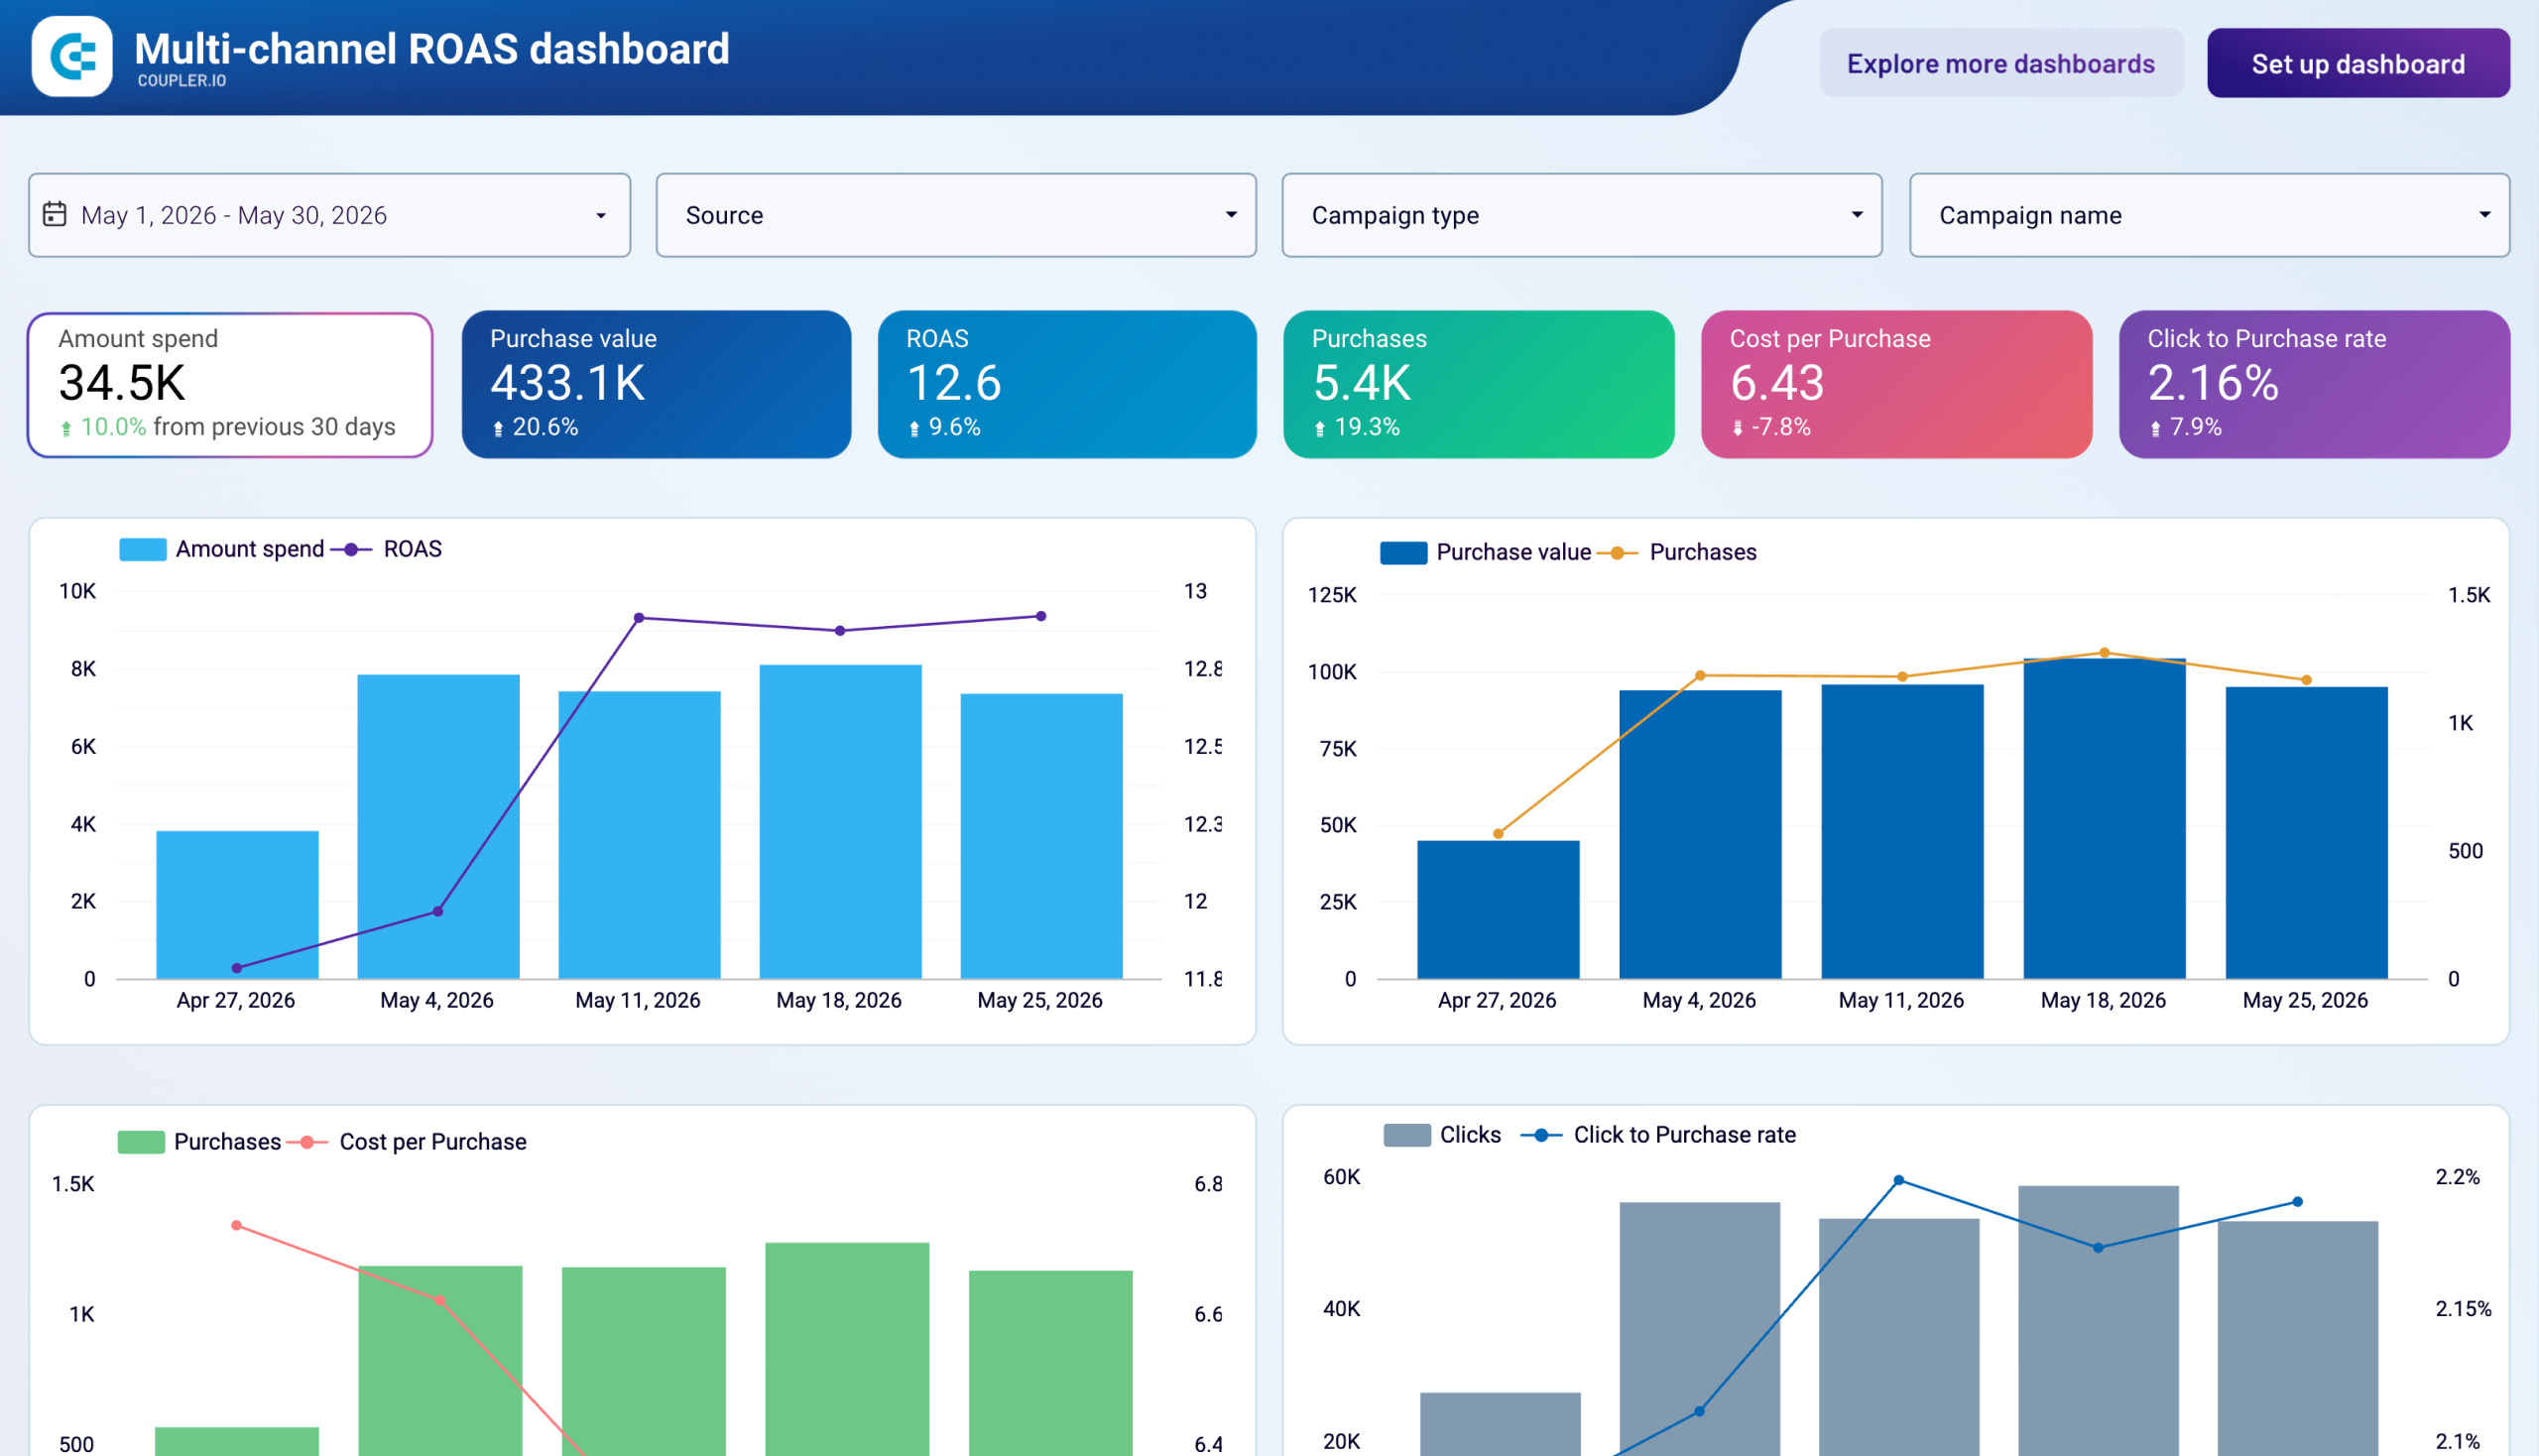
Example: PPC multi-channel dashboard
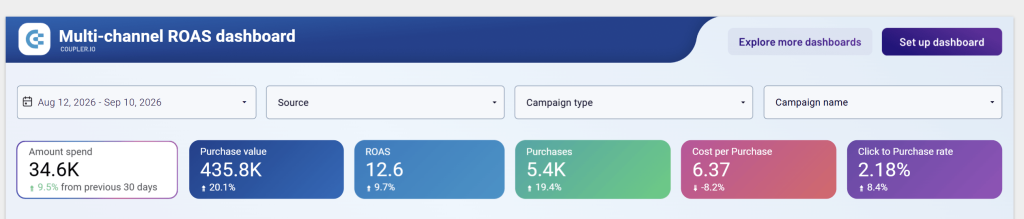
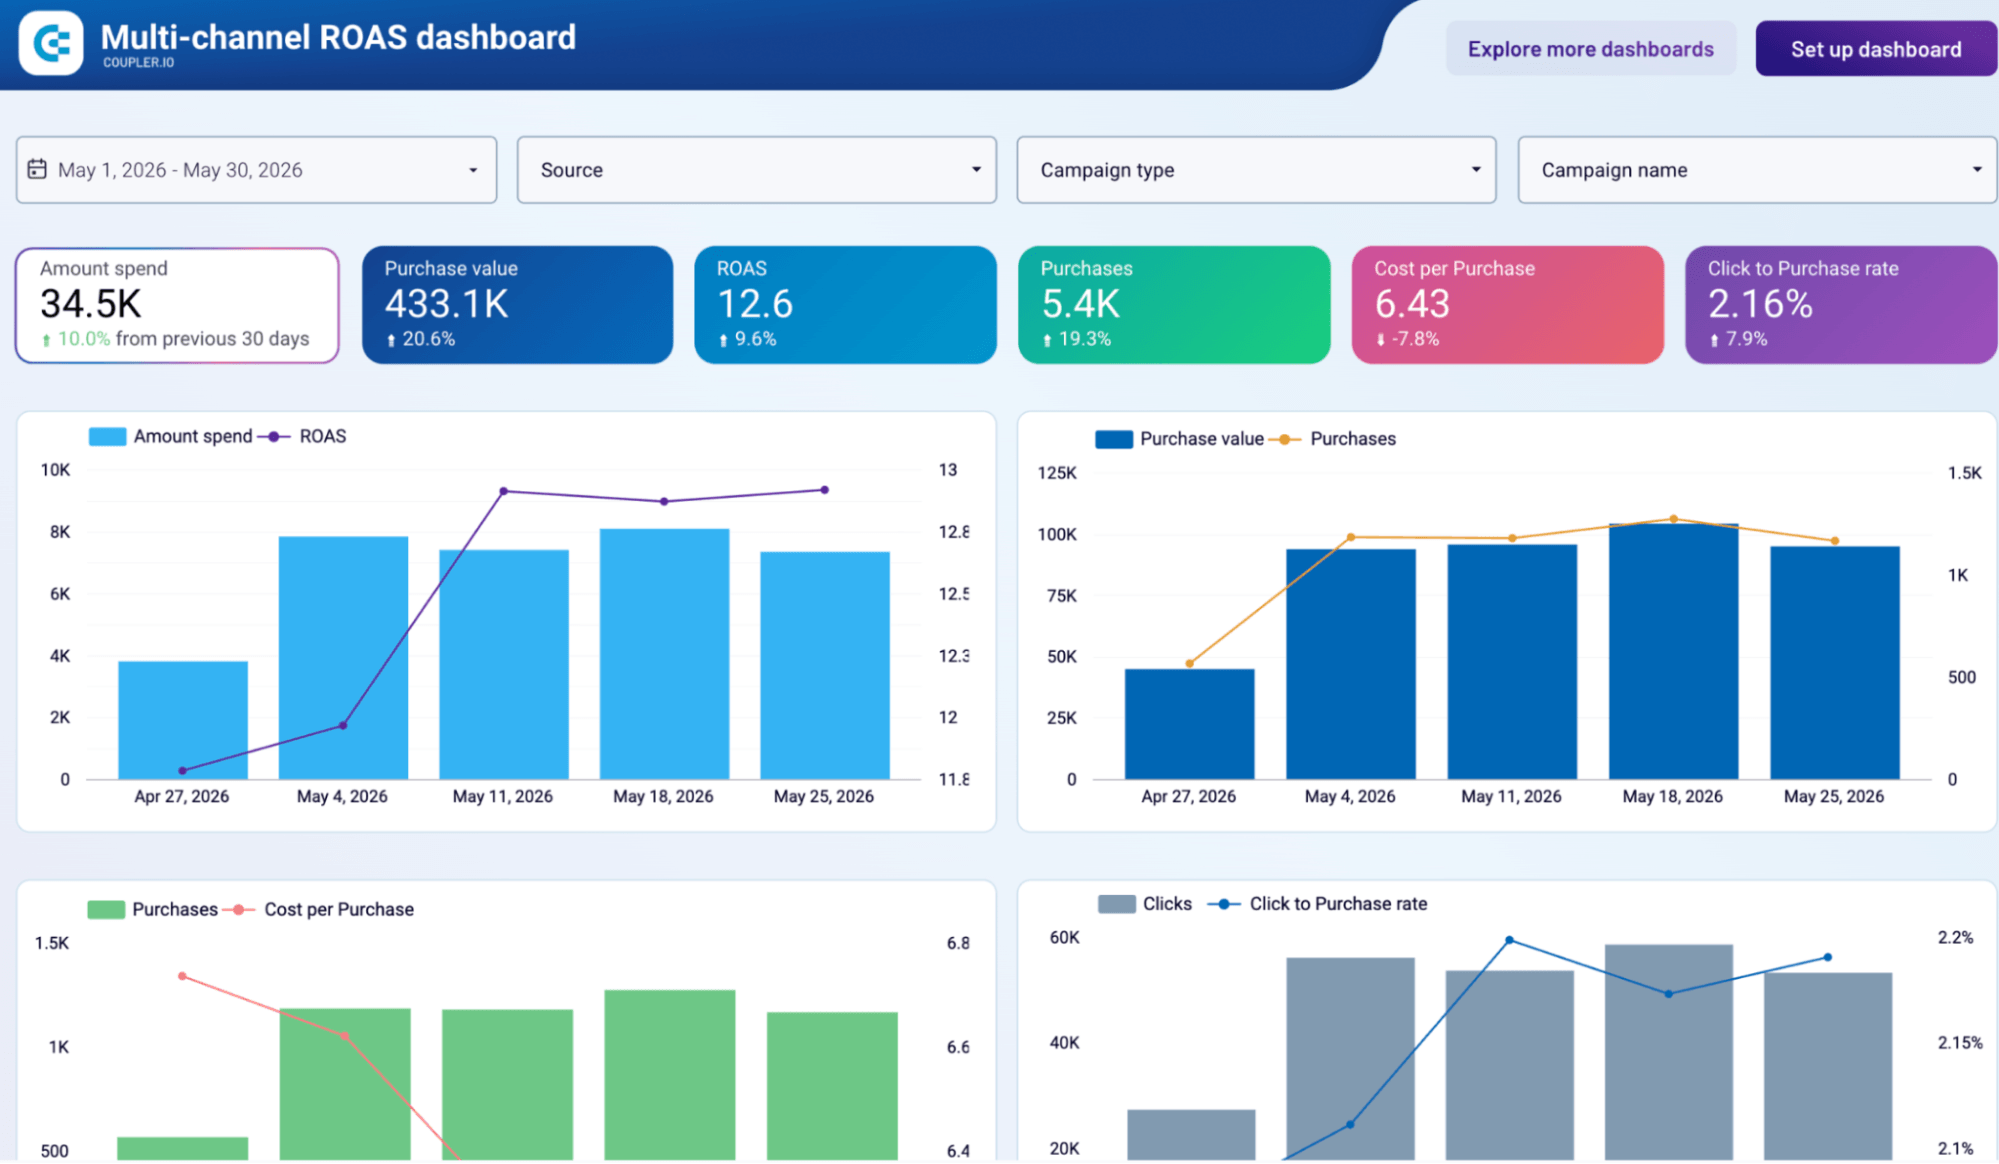
For ecommerce, replace qualified demos and cost per demo with purchases, orders, sales, attributed revenue, and return on ad spend. Include the revenue definition: gross sales, net sales after refunds, or another agreed measure.

Example: Multi-channel ROAS dashboard
Campaign performance breakdown in cross-channel PPC report
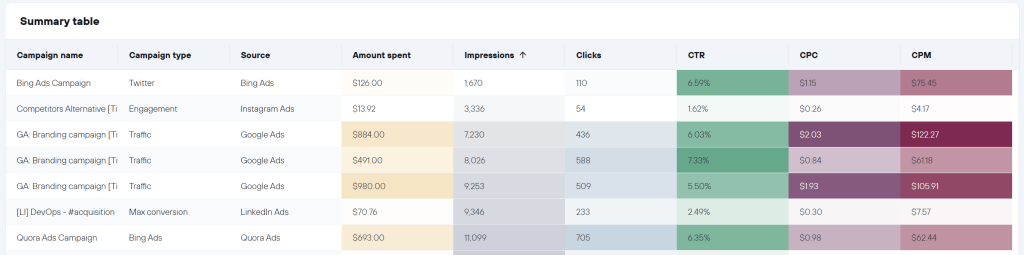
Use the breakdown by channel in a cross-channel PPC report to explain the total.
For clients running campaigns across several channels, use separate tabs for each channel alongside a cross-channel overview. For clients focusing on one channel, a single campaign breakdown table may be enough.
Start with channels, then show the campaigns or ads responsible for meaningful changes.

Example: PPC multi-channel dashboard
A PPC campaign report can go deeper into ad groups, keywords, and ad copy when those details explain the result.
Keep exhaustive keyword and ad performance tables in an appendix or at the end of a dashboard tab so they don’t clutter the key results. You can also include creative previews when the client needs to approve replacements or understand which message performed well.

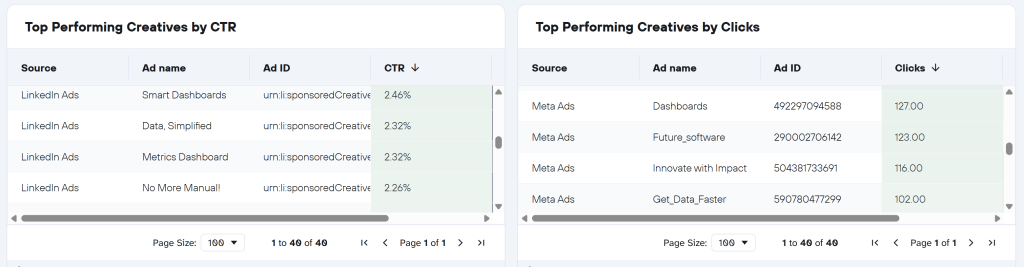
Example: Multi-channel ROAS dashboard
Tip: Add demographics or target audience segments only when the data is available and the breakdown informs a decision; small segments can be misleading.
Insights, analysis, and recommendations
For each significant finding, explain what changed, what the available evidence supports, and what you plan to do. These are the actionable insights that make client reports useful: a finding tied to a specific decision or task.
“Optimize Meta” is too vague. A useful recommendation names the work:
- Finding: Meta cost per qualified demo increased from $200 to $311.11.
- Investigation: Compare campaign spend, form submissions, and CRM qualification rates to locate the drop. Check whether newer leads have had enough time to qualify.
- Next step: Paid media manager to review the campaign and creative breakdown with sales by Friday. Recommend a budget change after that review.
AI can help query the breakdowns and draft this section. With all campaign data connected, you ask specific questions that AI answers against the account’s own data history.

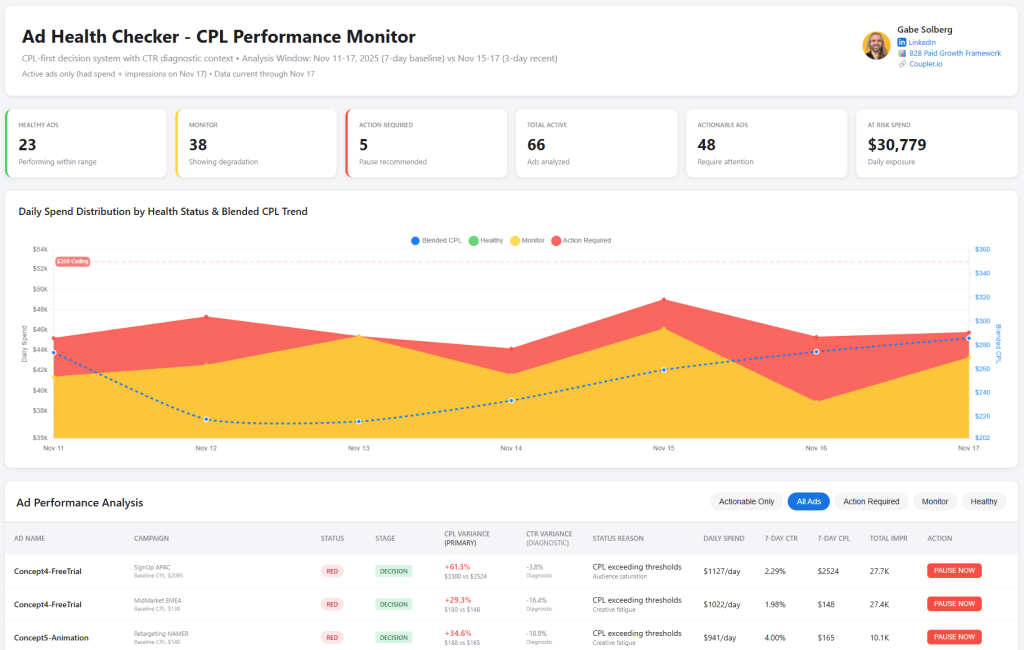
Example: Ad health checker artifact in Claude
Check out our guide on how to analyze PPC campaign performance in Claude with examples of querying connected campaign data.
Investigate PPC results by channel with Coupler.io
Get a demoPPC report metrics and what they tell the client
Choose PPC report metrics based on the client’s objective, then use supporting performance metrics to diagnose performance. Best practice is to group the metrics by purpose so the client understands the report better.
Here’s a cheat sheet grouped by cost, outcome, engagement, and brand:
| Metric | Explanation | What it tells the client | Group under |
|---|---|---|---|
| Ad spend | Total amount spent on advertising during the reporting period. | How much budget has been used and whether spending is on track. | Cost |
| Cost per click (CPC) | Ad spend ÷ clicks. | How much you pay to bring someone to the website. Lower CPC is useful only if the traffic converts. | Cost |
| Cost per acquisition (CPA) | Ad spend ÷ acquired customers. | How much advertising costs per new customer and whether that cost meets the target. | Cost |
| Cost per lead (CPL) | Ad spend ÷ leads generated. | How efficiently campaigns generate leads. Separate raw leads from qualified leads to show quality. | Cost |
| Conversions | Number of tracked actions, such as purchases, demo requests, or signups. | How many desired outcomes the campaigns generated. Always name the conversion being counted. | Outcome |
| Conversion rate | Conversions ÷ clicks × 100 for a click-based rate. | How effectively ad traffic turns into the desired action. A decline can signal a mismatch between the audience, offer, and landing page. | Outcome |
| Attributed revenue | Revenue credited to advertising under the selected attribution model and window. | How much sales revenue is credited to the campaigns. Platform totals may overlap, so avoid adding them together as unique revenue. | Outcome |
| Return on ad spend (ROAS) | Attributed revenue ÷ ad spend. | How much revenue each advertising dollar generates. A 4× ROAS means $4 in revenue per $1 spent, before costs. | Outcome |
| Impressions | Number of times ads were displayed, including repeat views. | How much exposure the campaigns received. Helps explain delivery changes but does not measure unique people or business results. | Engagement |
| Clicks | Number of clicks on the ad. For website traffic, use link clicks consistently. | How much traffic the ads attracted and whether traffic volume changed. | Engagement |
| Click-through rate (CTR) | Clicks ÷ impressions × 100. | How often people click after seeing an ad. Helps assess whether the message attracts attention from the target audience. | Engagement |
| Branded searches | Searches containing the company or product name, tracked consistently over time. | Whether interest in the brand is growing. Use as supporting context; an increase does not prove paid campaigns caused it. | Brand |
How to create a PPC report for clients
Before choosing how to create a PPC report, you need to know what the client wants to decide and which PPC KPIs will help them decide it. A client asking whether to increase the budget needs a different analysis from one trying to improve lead quality.
The other constant is the data. Whichever approach to PPC reporting for clients you choose, someone has to bring the numbers together and keep them updated. Automating data collection and preparation with Coupler.io helped ClaritySeed deliver client reports five hours earlier.
Once that foundation is in place, you have four ways to turn the data into PPC reports for clients.
Create PPC reports for clients with Coupler AI
The monthly report rarely answers every question. The client sees a higher CPA and asks which campaigns caused it, whether it happened before, and what you plan to change. Investigating those questions on the spot is where AI earns its place in the workflow.
With Coupler AI, you describe the report instead of building it. Tell AI Agent inside Coupler.io, or any AI tool connected through AI Integrations (Claude, ChatGPT, Gemini, Perplexity, Cursor), what you need and who it’s for. Coupler AI pulls the data, runs the calculations through the Analytical Engine, and produces a written summary, a set of charts, or a Claude Artifact.
At Right Percent, Gabe Solberg uses a Coupler.io and Claude workflow for his PPC client performance report. This let him cut reporting time by 60%, with daily reviews taking under 10 minutes.
Let Coupler AI do the data work for you
Tell Coupler AI what you need to know, from which source, and how often. It connects your account, sets up the data flow, keeps it refreshed, and lets you analyze the results inside Coupler.io or another AI tool.
Try for free

Two things make the output reliable enough to send.
Context. Every PPC client has their own definitions. What “qualified” means for their sales team. Which conversions count toward ROAS. Why CPL spikes in Q1 in their niche. What happened in November that broke the year-over-year comparison. Which CRM values are placeholders instead of real deals. Without those in front of it, the AI fills the gaps with generic assumptions, and the report comes back sounding fluent but off in ways the client will catch.
Write those definitions down once, so you’re not re-explaining them every month or catching them in QA on the day of the send. Coupler.io handles the technical schema for you: columns, types, metric formulas. The business rules live in your head and your client’s SOP, nowhere else. Write them once, attach them to the data set, and every future analysis picks them up.
Skills. For PPC client reporting, Skills are how you stop rebuilding the same report every month. The library ships ready-made Skills that map to the specific work you do across a monthly reporting cycle.
The core reporting Skills anchor the write-up. Paid Ads Performance Analysis covers the multi-channel view: spend, CPA, ROAS across Google, Meta, LinkedIn, and TikTok in one pass, ready to become the top of the report. For clients concentrated on one platform, here are some examples of useful skills:
- Google Ads Client Report and LinkedIn Ads Client Report produce the end-of-month write-up an agency would normally build by hand, such as performance vs target, campaign-level changes, what to raise in the review call, etc.
- Facebook Ads Budget Pacing and LinkedIn Ads Budget Pacing answer “am I on track for this month?” mid-cycle, so budget surprises don’t land in the meeting.
- Google Ads Waste and Scale surfaces which campaigns to pause and which to double down on, so the “what we changed and why” section writes itself from what it flags.
- TikTok Ads Creative Fatigue and Velocity catches when hook rates are dropping and CPMs climbing, feeding the “what’s next” recommendations.
- Facebook Ads Pixel and Attribution Audit and LinkedIn Ads Conversion Tracking Audit catch conversion tracking issues before the report goes out with numbers the client will question.
- Microsoft Ads Client Report builds the monthly Microsoft Ads write-up with performance against targets, so Bing campaigns stop being the afterthought in a cross-channel report. LinkedIn Ads Client Report does the same for B2B clients, explains misses, and Amazon Ads Client Report – for users who sell on Amazon.
Ready-made Skills tailor to each client’s rules and cadence, and anything the library doesn’t cover, you build once and reuse across the team. Skills run in whichever AI tool your team already uses: Claude, ChatGPT, Gemini, Cursor, or Perplexity.
Ask, follow up on findings that matter, add your judgment, then pick the output that fits: recap, chart, or AI artifact.

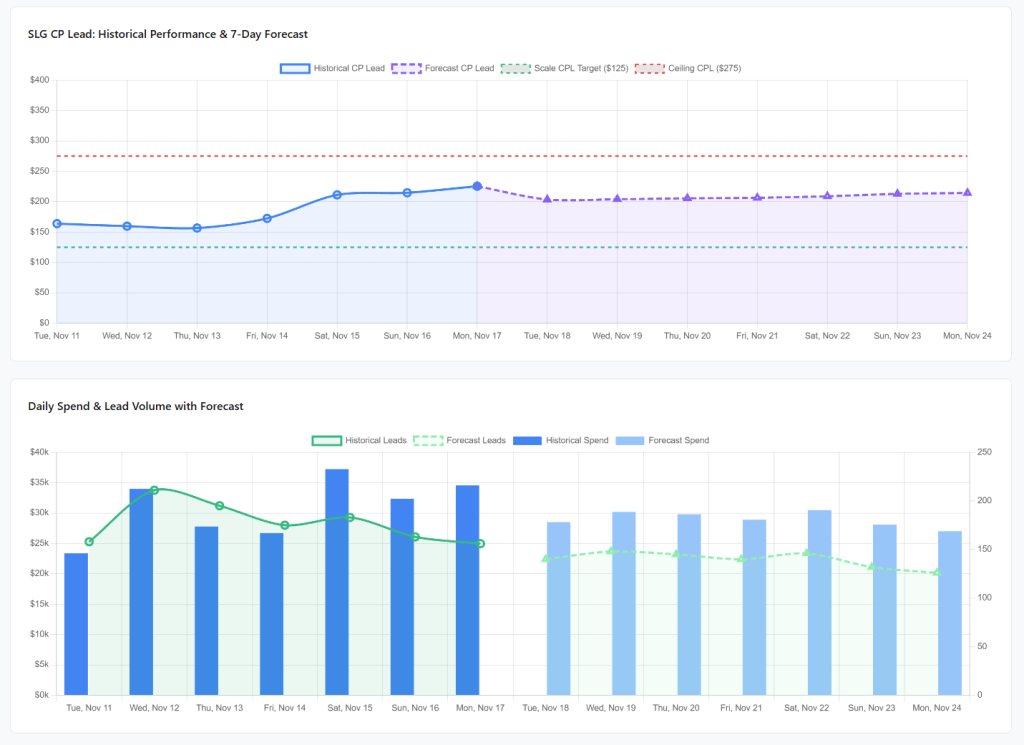
Example: CP Lead Performance & 7-Day Forecast artifact in Claude
Once the Skill is running, you can ask about tomorrow as easily as yesterday. Projecting CP Lead against the last 30 days of trend gives you a forecast; asking about performance by day of week gives you the pattern for a scheduling call. Each Artifact runs against the same connected data. The question is the only thing that changes.

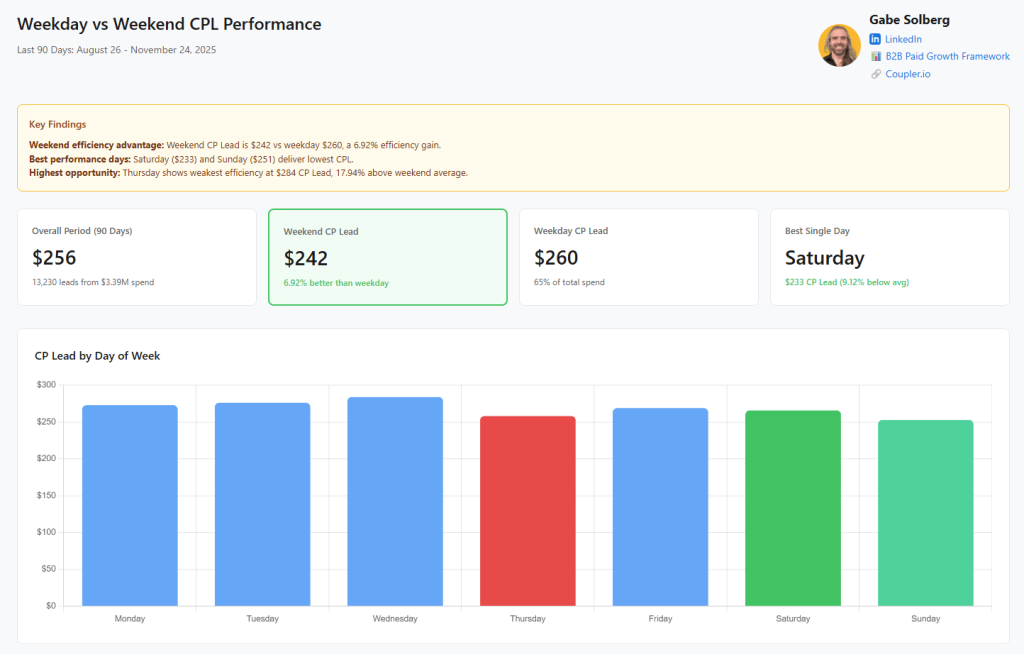
Example: Weekday vs Weekend CPL Performance artifact in Claude
Expect some adjustments to get the instructions and report layout right. And before calling the Artifact “live,” check how it refreshes: a downloaded interactive report may still show a fixed snapshot.
Use a PPC report template
If your client wants to open a link and see how campaigns are doing, a PPC report template is a straightforward starting point. The charts and layout are already there, so you can spend more time making the report useful to that client.
Coupler.io’s PPC dashboard gallery includes Google Ads reports, multi-channel performance dashboards, ROAS dashboards, creative performance reports, and other PPC reporting examples. Getting started comes down to two steps:

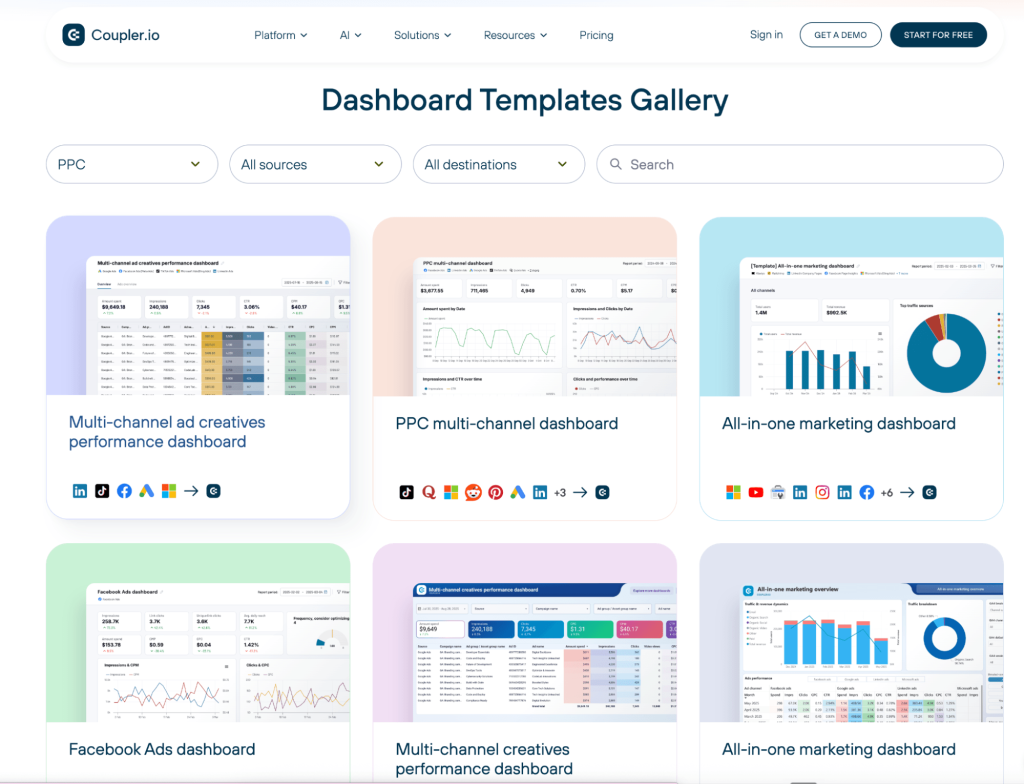
- Choose a template and destination: Pick the report that matches the account and where you want to use it, such as Coupler.io, Google Data Studio, or Power BI.
- Connect your accounts and make it yours: Set the refresh schedule, adjust the reporting period, and add the client’s targets. Remove metrics that don’t help explain their results.
For a lead-generation client, you’d want qualified leads and cost per qualified lead near the top. For ecommerce, purchases, attributed revenue, and ROAS will usually matter more. The template gives you a layout. Use the client’s goals to decide which charts, tables, and insights to include.
Clear Performance Ads uses Coupler.io to bring Google Ads, Meta Ads, and Amazon Ads into client dashboards, which saves them from having to do the work manually.
Before the first client review, compare a completed reporting period with the source platforms to catch mismatched definitions or totals. Then add the short summary and recommendations that explain what to do next. A dashboard makes results easier to see, but a follow-up question may still need a breakdown you haven’t built yet.
Tip: When using Coupler.io PPC dashboard templates, you can always talk to the AI agent about them. As a result, you get AI-powered answers that a dashboard can’t provide.
Build your own PPC campaign report
Some agencies already have a preferred setup for PPC reporting for clients: a Google Data Studio dashboard the team knows or a Google Sheets report the client asks for by name. Coupler.io fits underneath as the data layer for your PPC campaign report and lets you go from raw platform data to a ready-to-report data set:
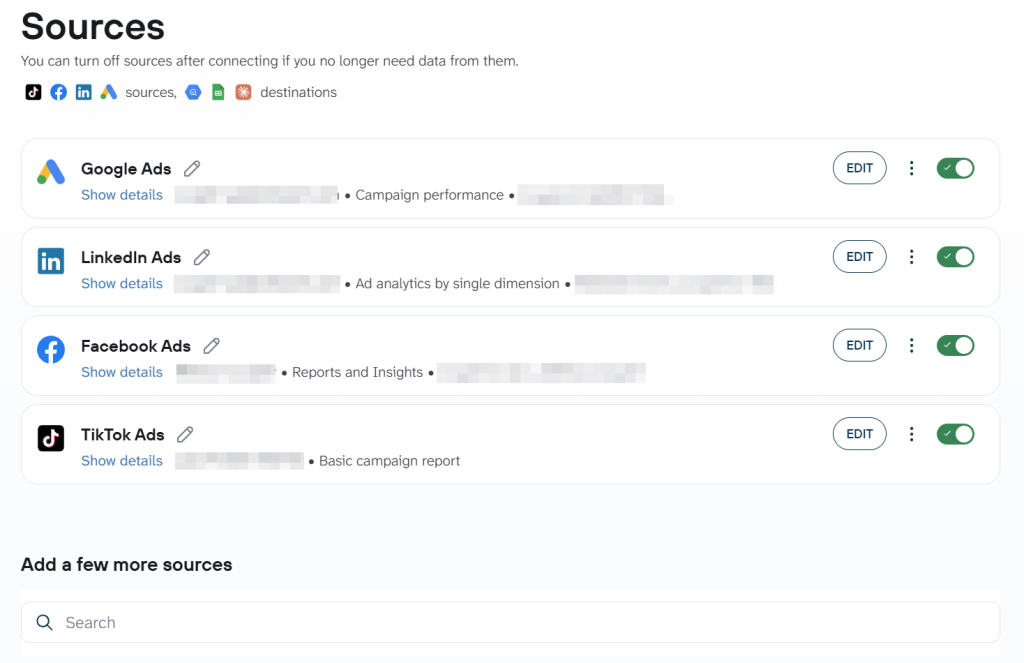
Connect data. Pick the ad platforms you report on, and add whatever else the client’s stack needs. Coupler.io supports Google Ads, Meta, LinkedIn, TikTok, Amazon Ads, and over 420 other sources, including CRMs, ecommerce platforms, and analytics tools. Each data flow can contain multiple data sources, which is crucial for multi- and cross-channel reports.

Organize the data set. Shape the connected data into the analysis-ready data set with supported data transformations. Join campaigns across platforms into one blended view. Aggregate by week, month, or campaign group. Filter out test campaigns, internal traffic, and unqualified conversions. Add calculated metrics like blended CAC or your own ROAS definition. Rename fields to the vocabulary the client’s team uses.

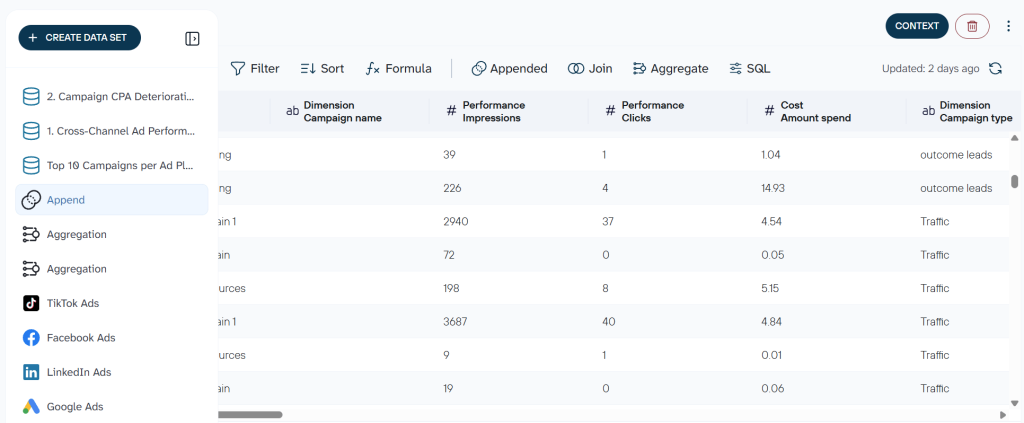
In addition to custom transformations, you can choose from over 150 data set templates that provide ready-to-load data sets.
Send it to your reporting tool. Push the prepared data set to wherever the reporting lives: Google Sheets or Excel for spreadsheet-based reports, Data Studio or Power BI for standing client dashboards, BigQuery or Snowflake when the analysis needs SQL, and more. The best part is that you do not have to choose between them. Each Coupler.io data set can be connected to multiple destinations. This way, you will have the same data across different reporting tools and dashboards you use.

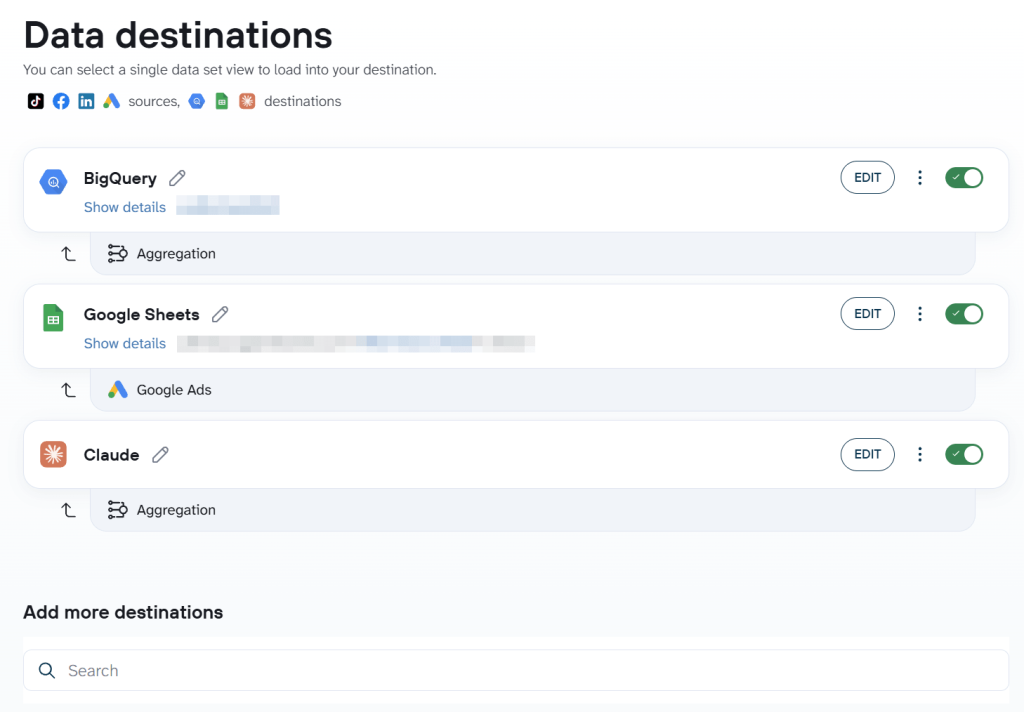
Automatic data refresh ensures your report stays up to date on the set schedule.
Get PPC reporting done for you by Coupler.io
Not every agency wants to run its own data infrastructure. Some don’t have the in-house team even if they wanted to. Coupler.io’s Data Analytics team builds and maintains the reporting setup for you.
They handle the full stack: connecting sources, defining metrics, setting up transformations, building the dashboard or scheduled deliverable, and adjusting the setup when the client’s rules change. Fifteen years of consulting experience across 100+ data specialists and domain experts means the same team can ship a single custom dashboard for one client, or full data infrastructure for an agency running many clients across many destinations.
You brief them on what the client needs, they own the delivery, and the finished PPC performance report shows up on the schedule you set. It works best when your value to the client is judgment and account management, not the reporting build.
Tailor PPC dashboards to every client with Coupler.io
Book a demoPPC report examples and templates
Coupler.io’s PPC reporting gallery includes ready-made PPC performance report templates for different needs. Here is a PPC report example for a common client setup:
- Multi-channel PPC performance report: Compare spend, clicks, and campaign performance across ad platforms when the client needs an overview of their paid marketing.





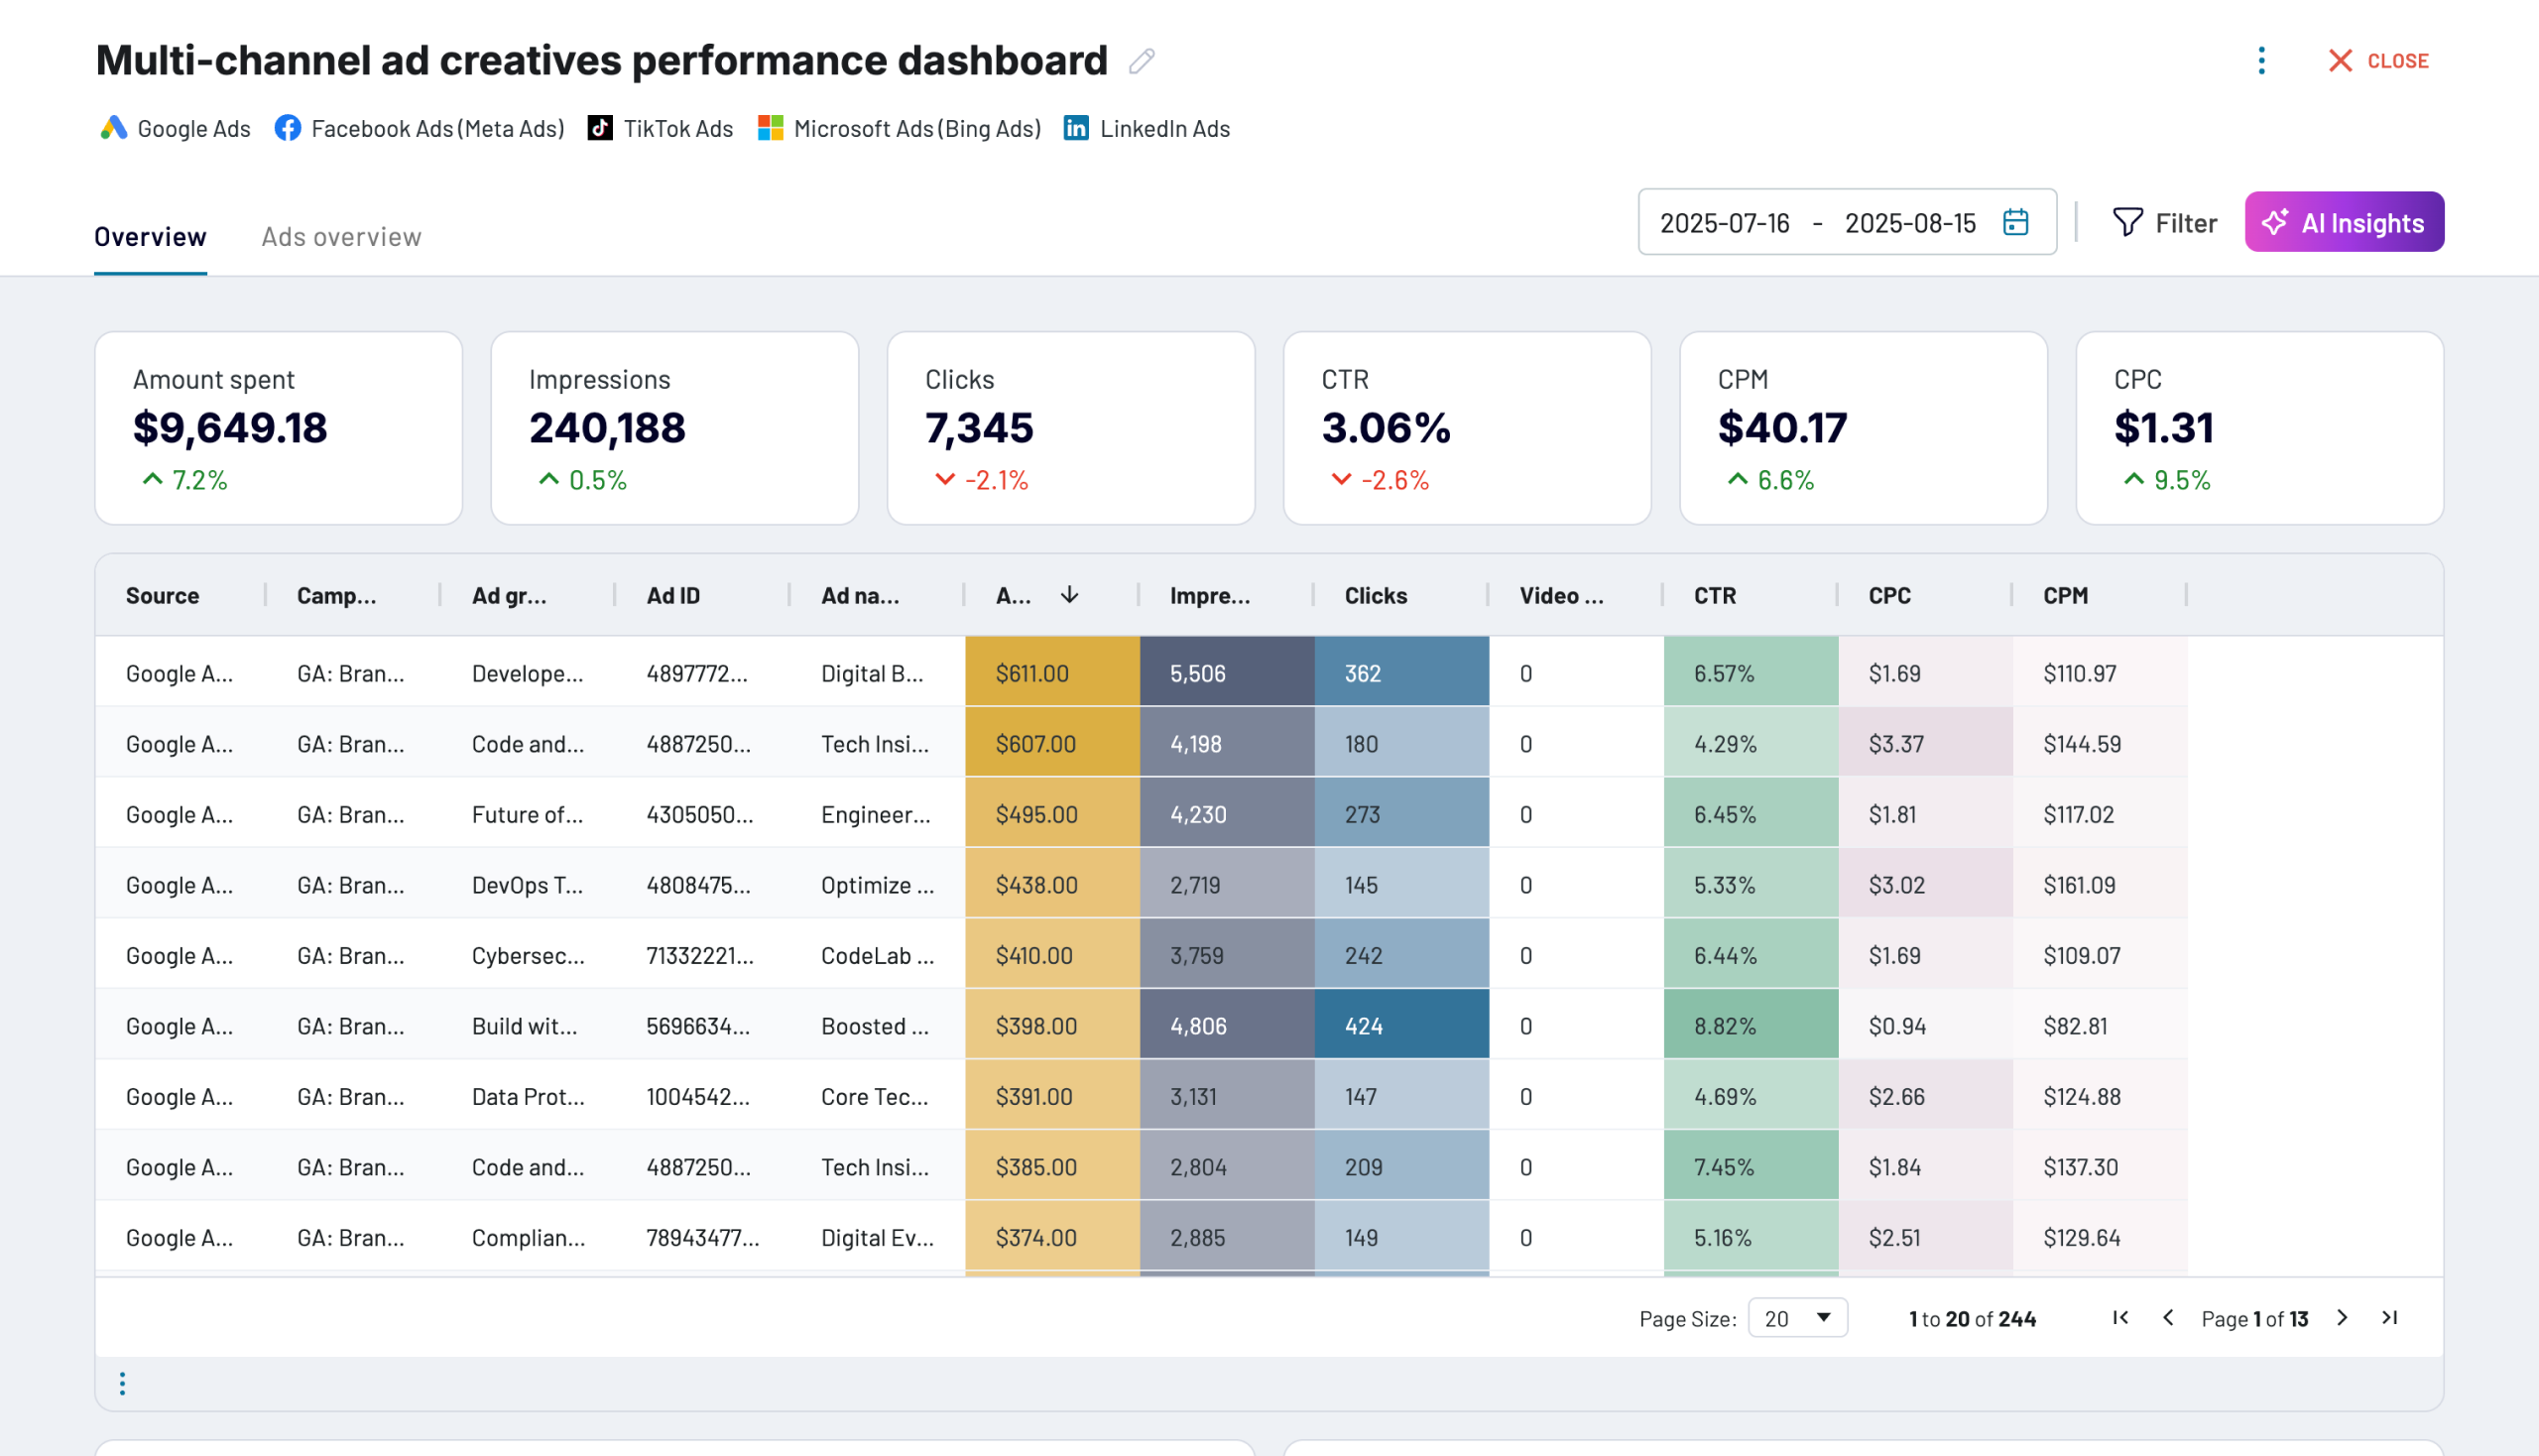
- Multi-channel creative performance report: Compare individual ads across channels when you need to explain which creatives attract engagement and what to test next.
- Multi-channel ROAS dashboard: Review purchases, purchase value, and return on ad spend when an ecommerce client wants to understand sales efficiency.



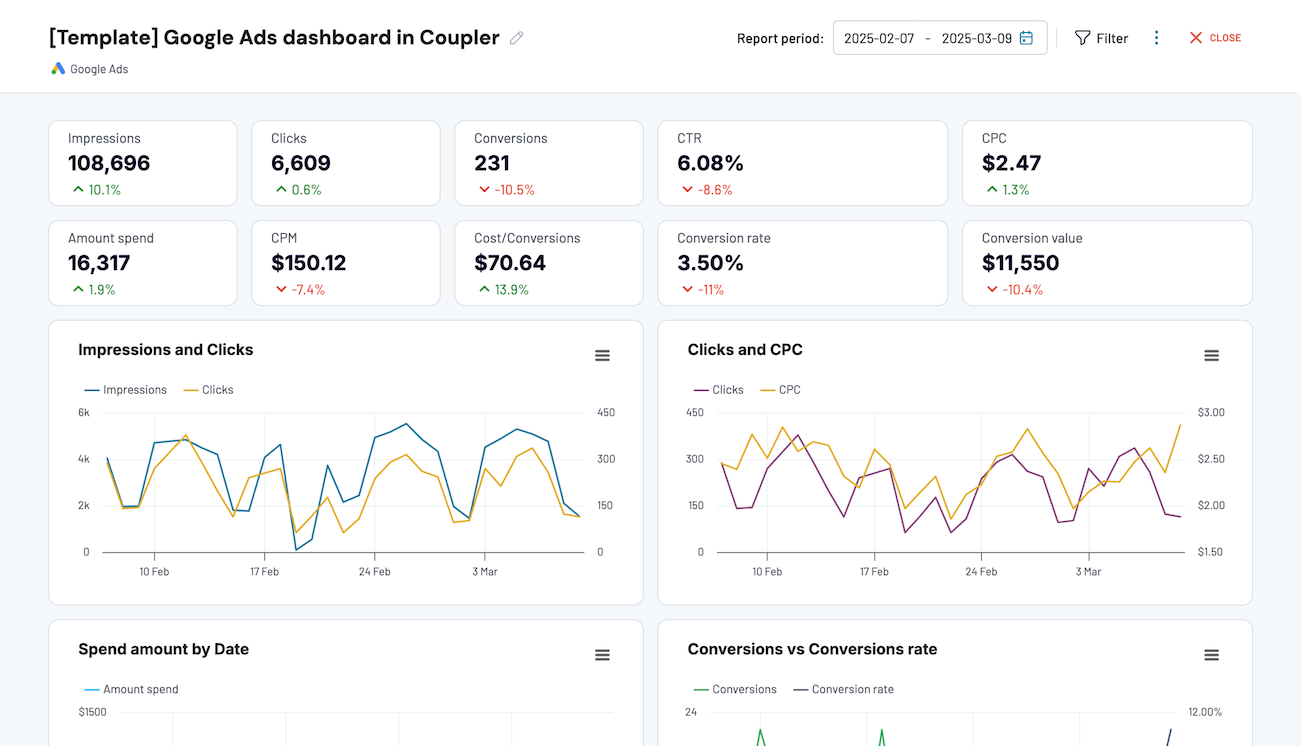
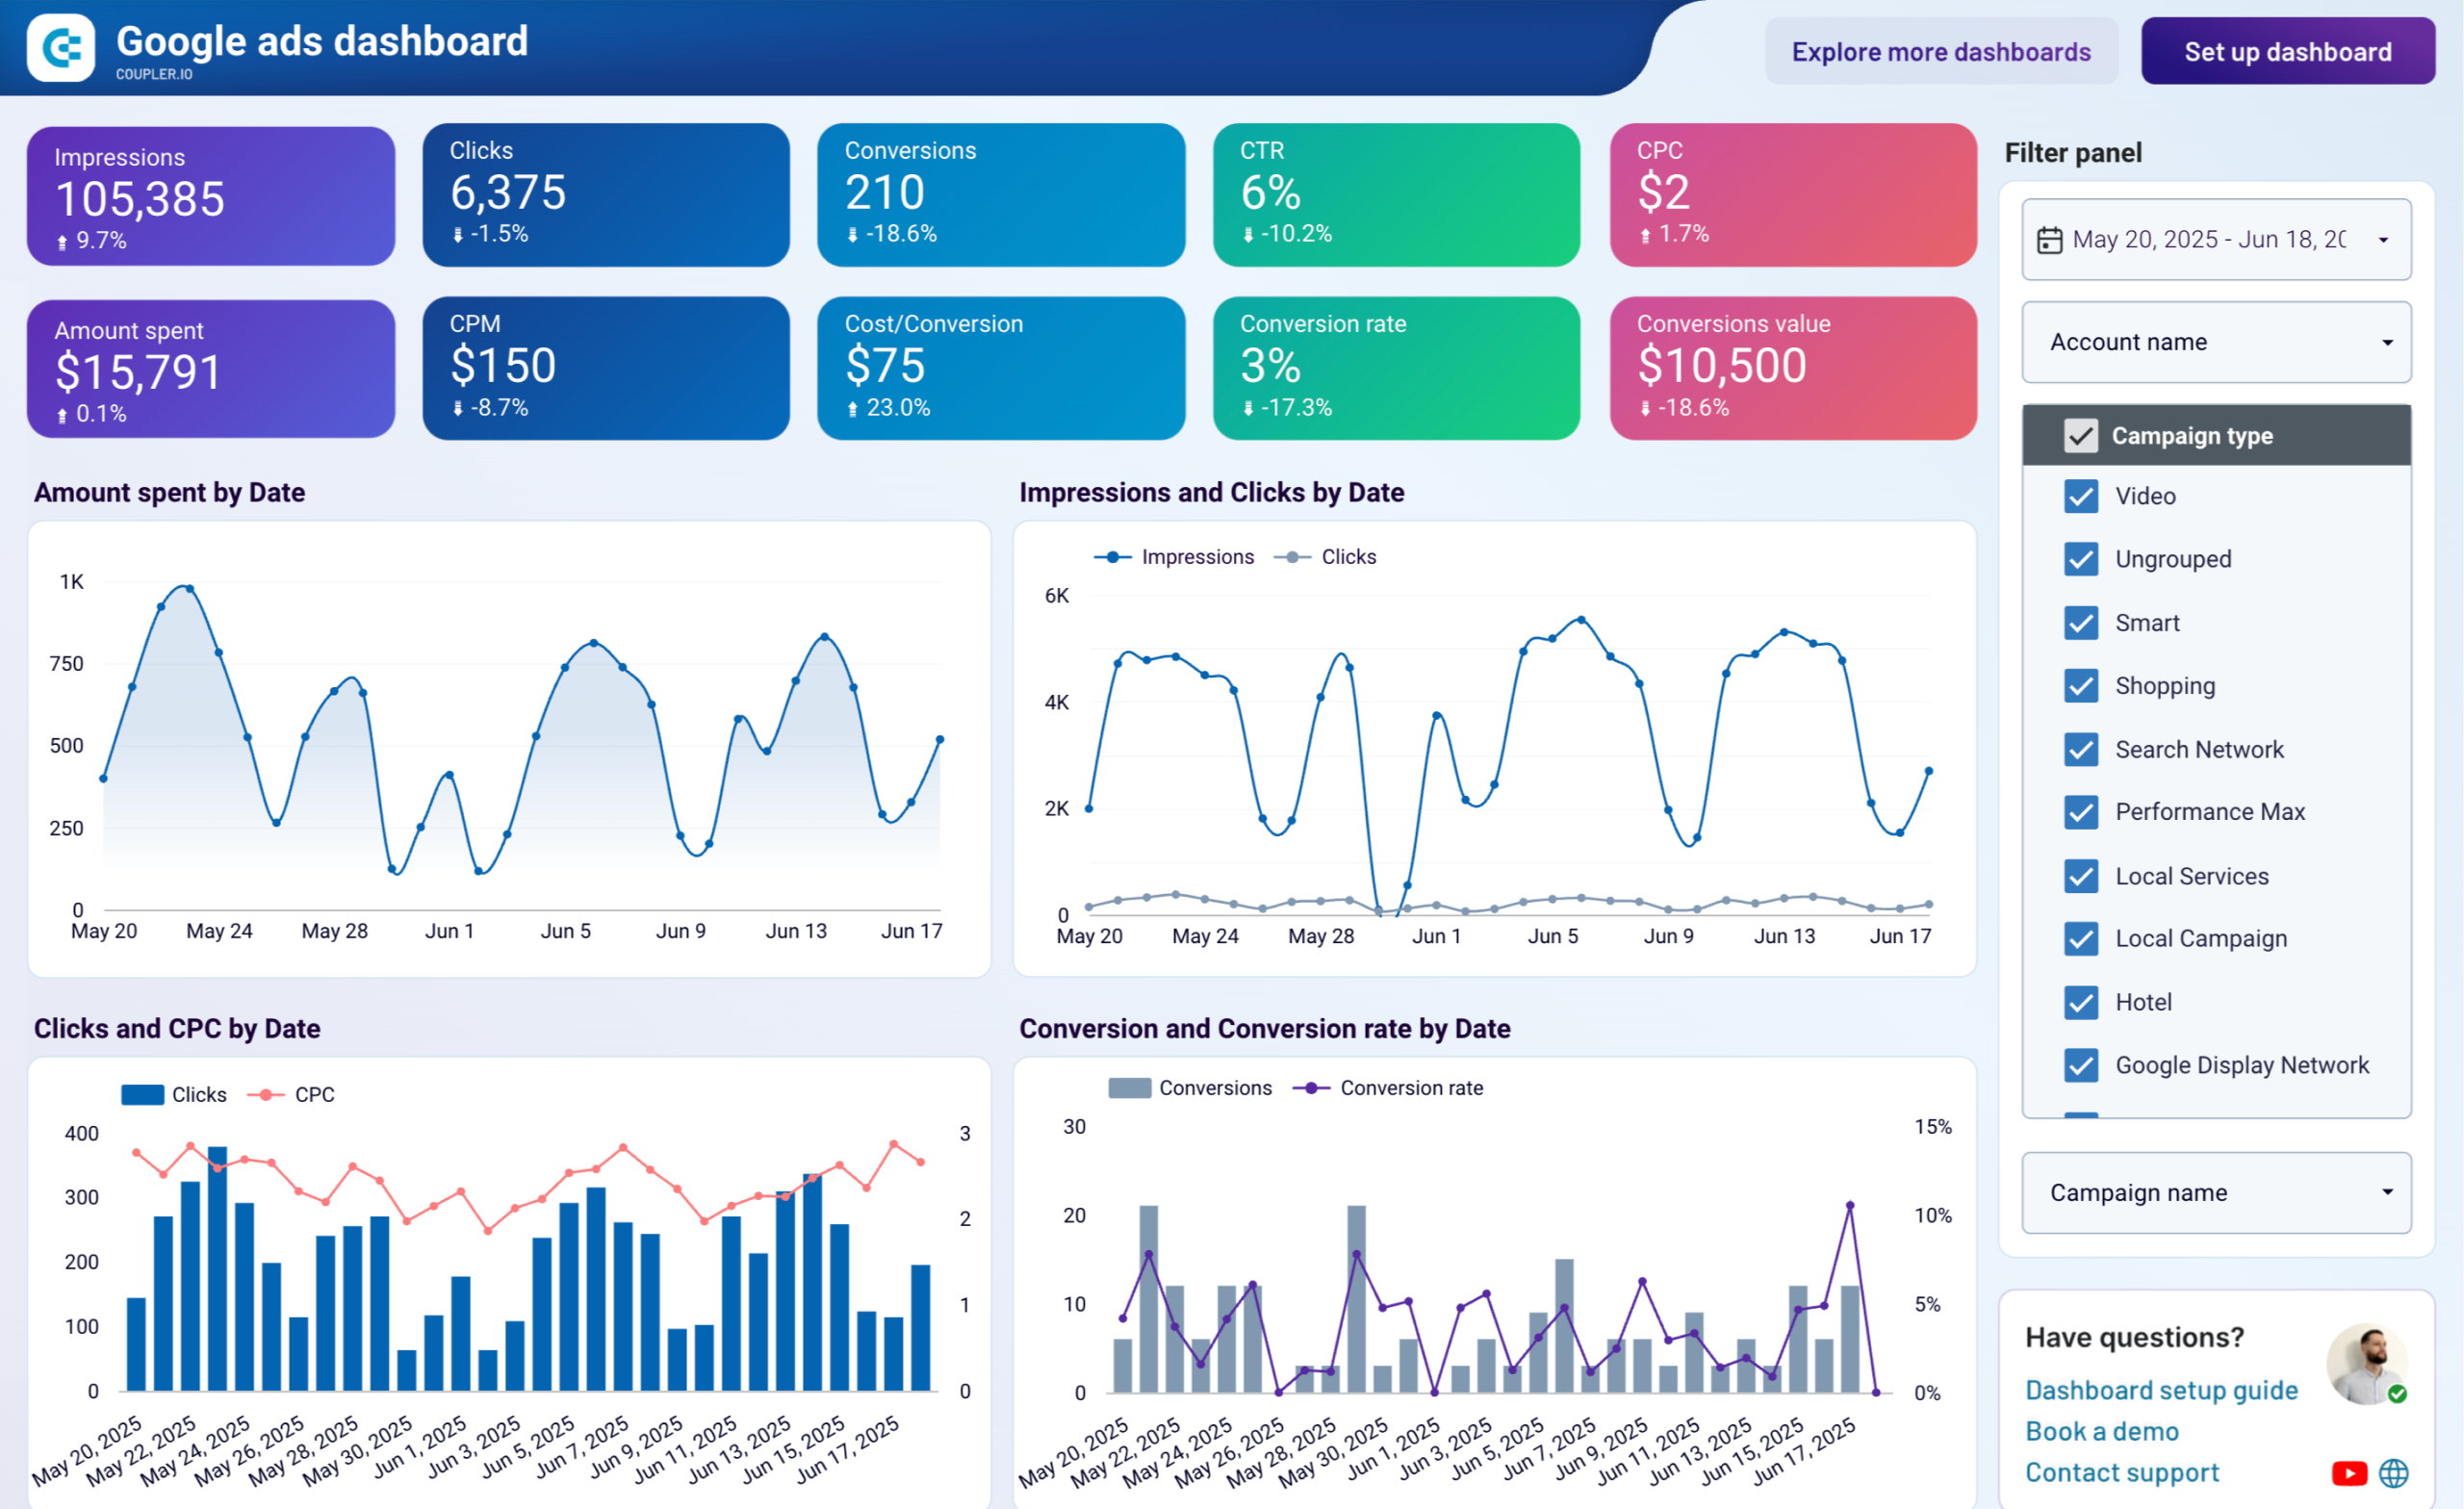
- Google Ads dashboard: Track spend, conversions, CPC, and conversion rate when Google Ads is the focus of the client report.


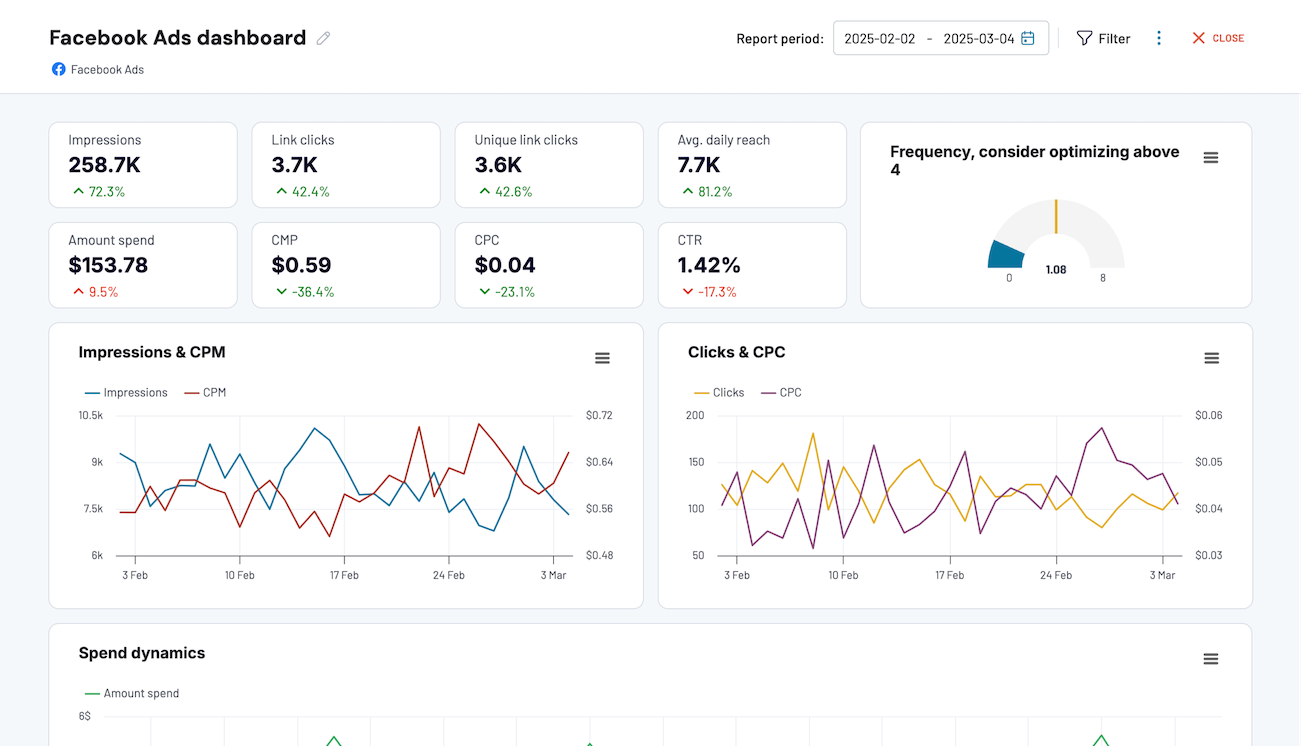
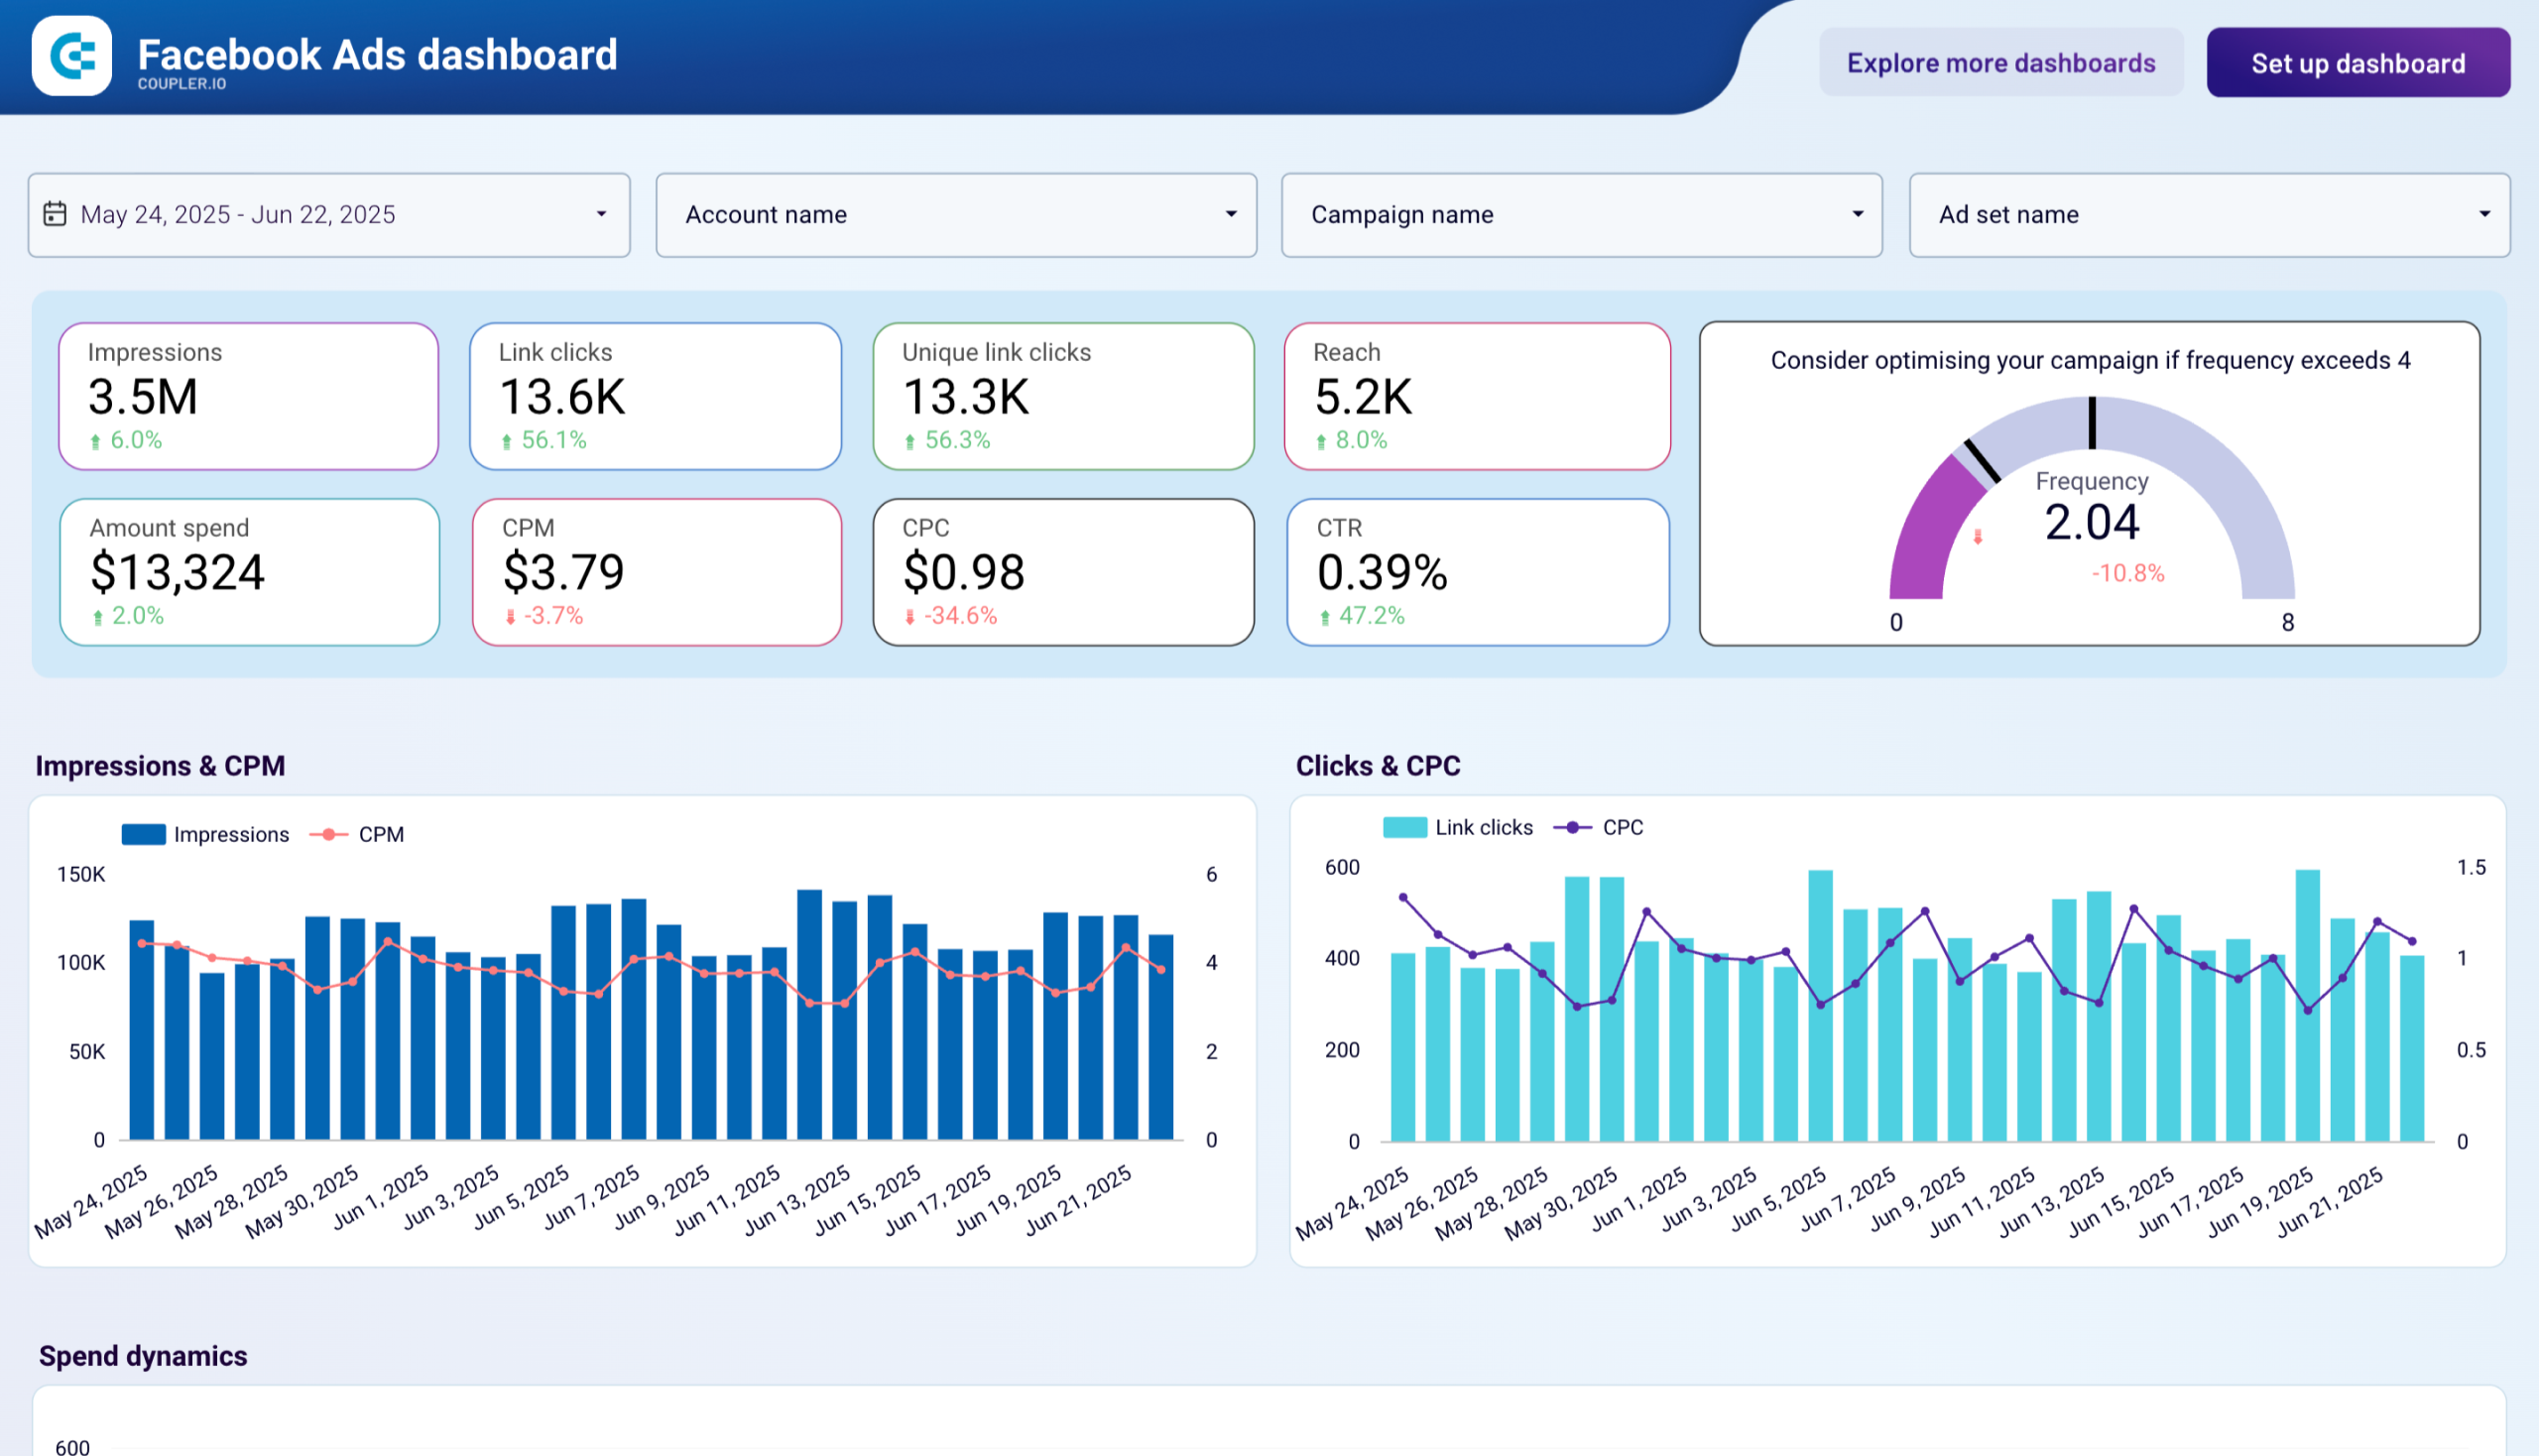
- Facebook Ads dashboard: Review reach, frequency, clicks, and costs when you need to explain Meta campaign delivery and audience response.
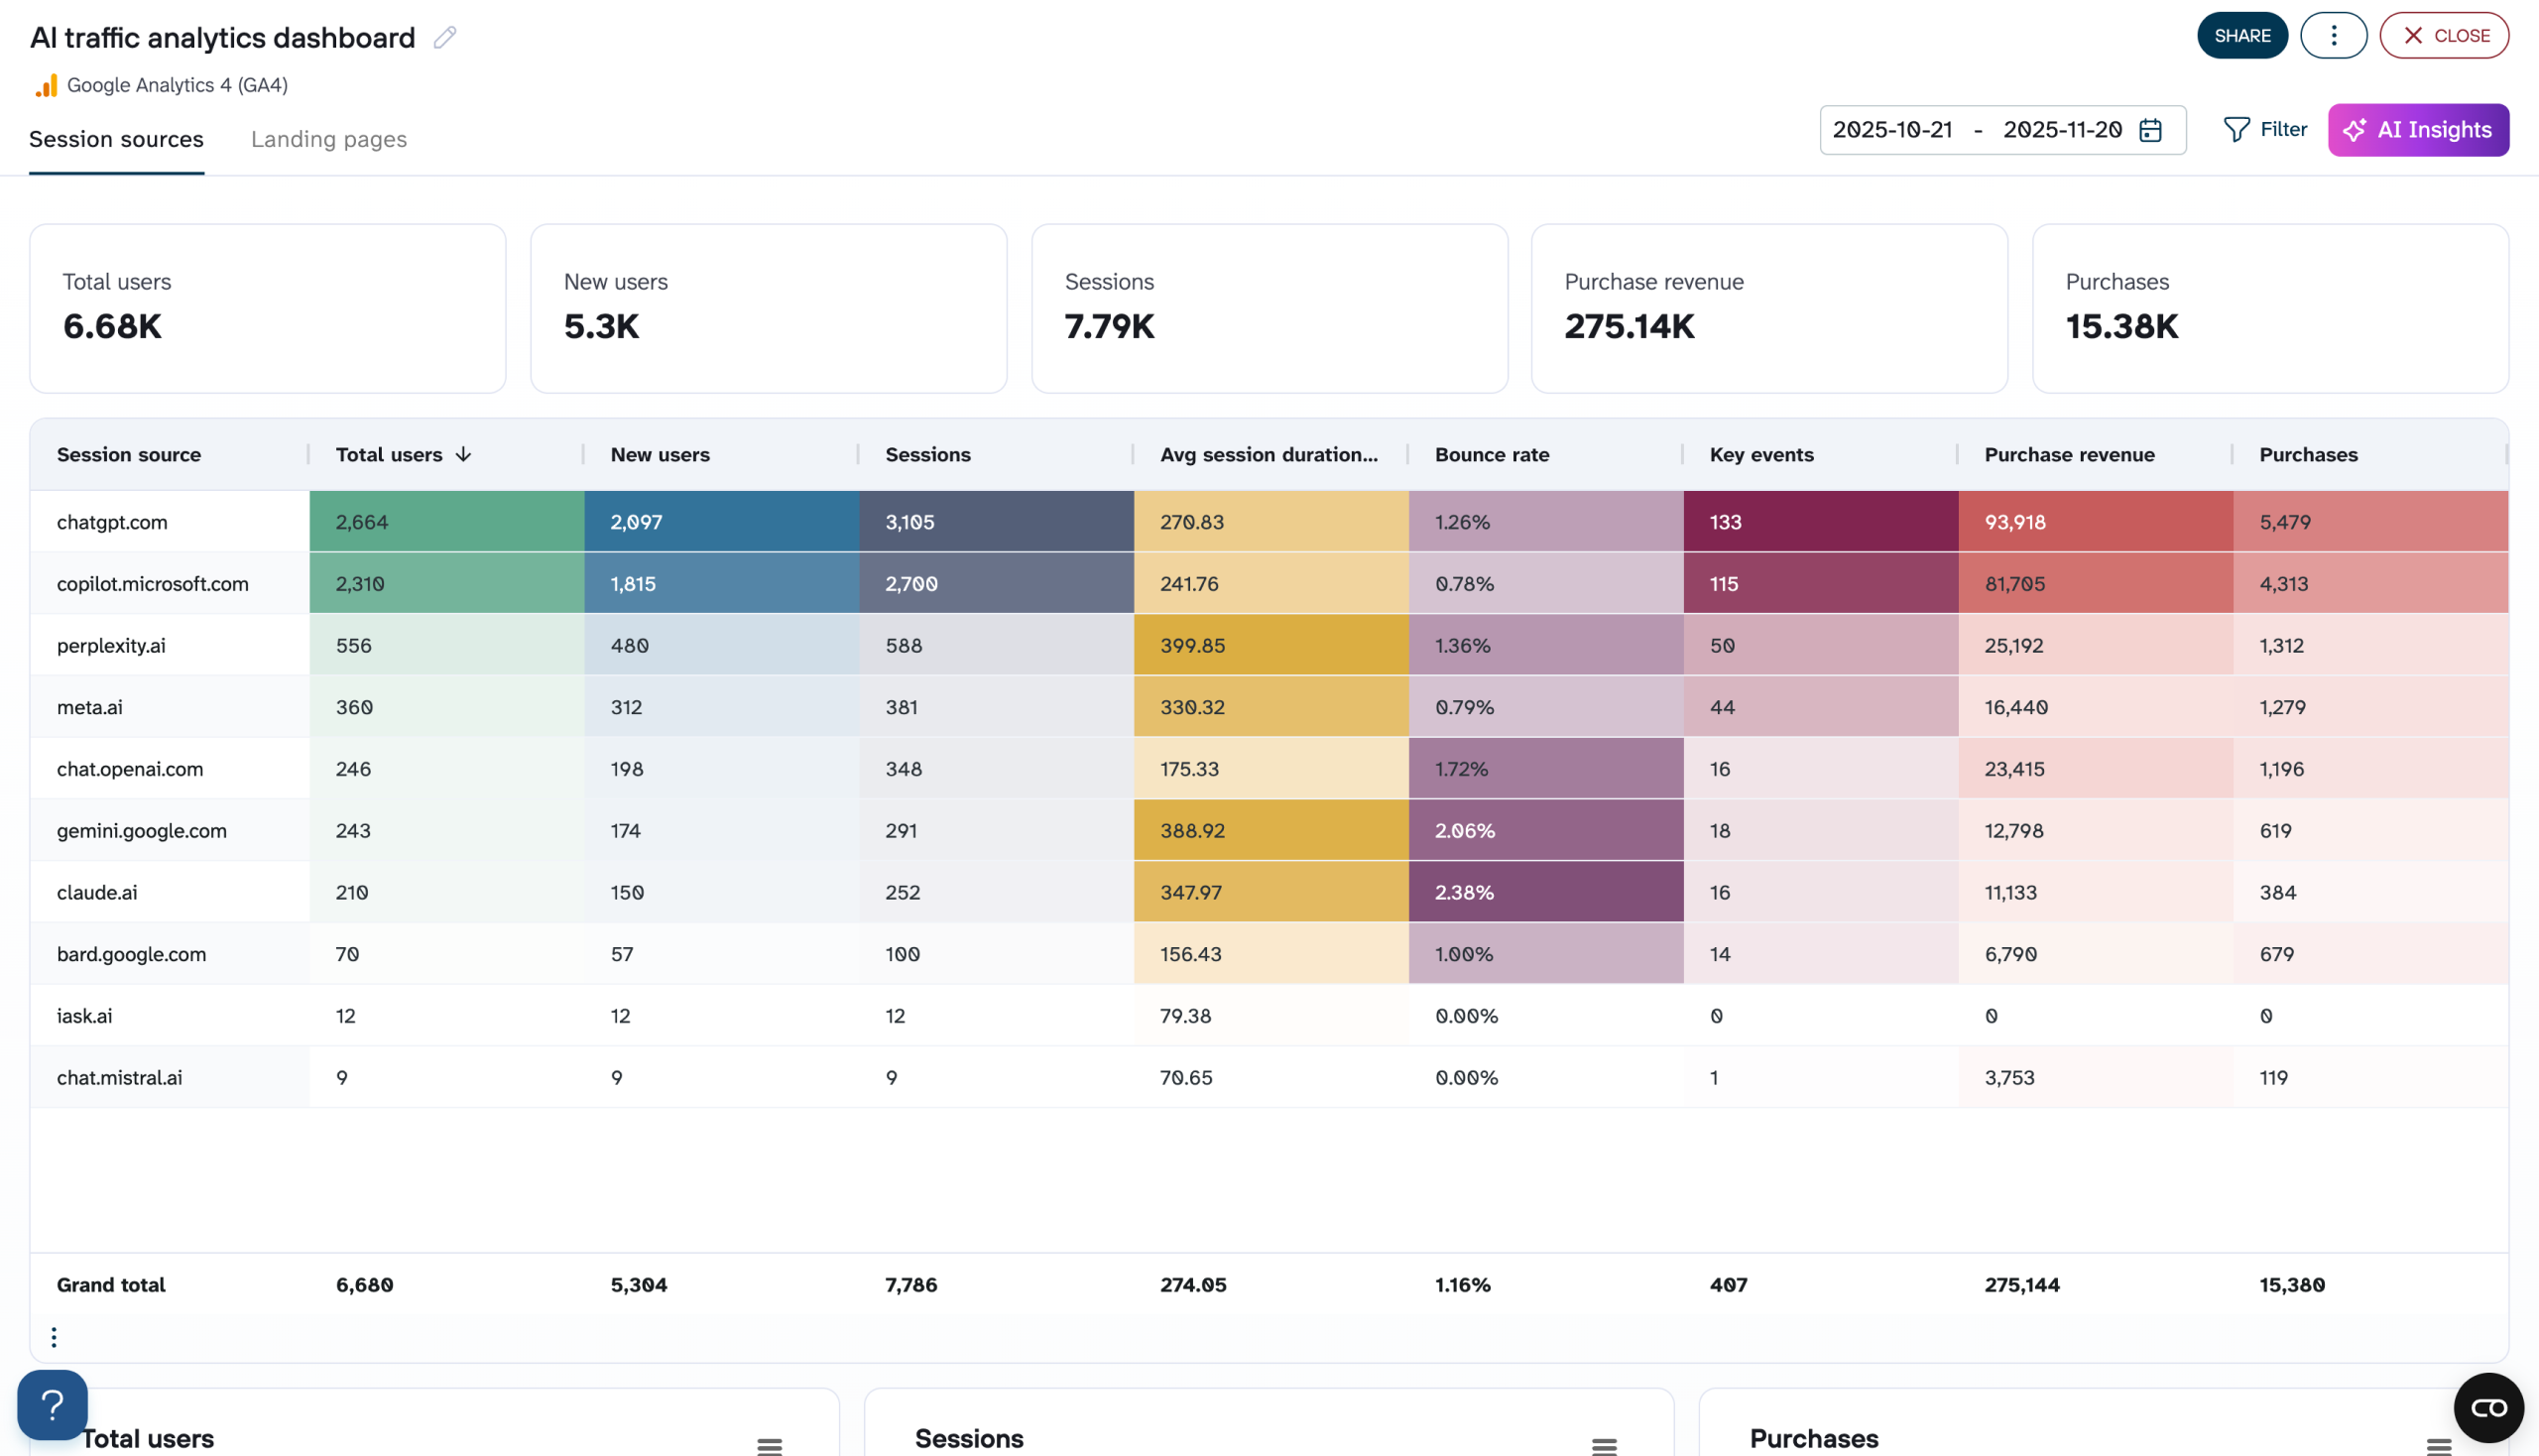
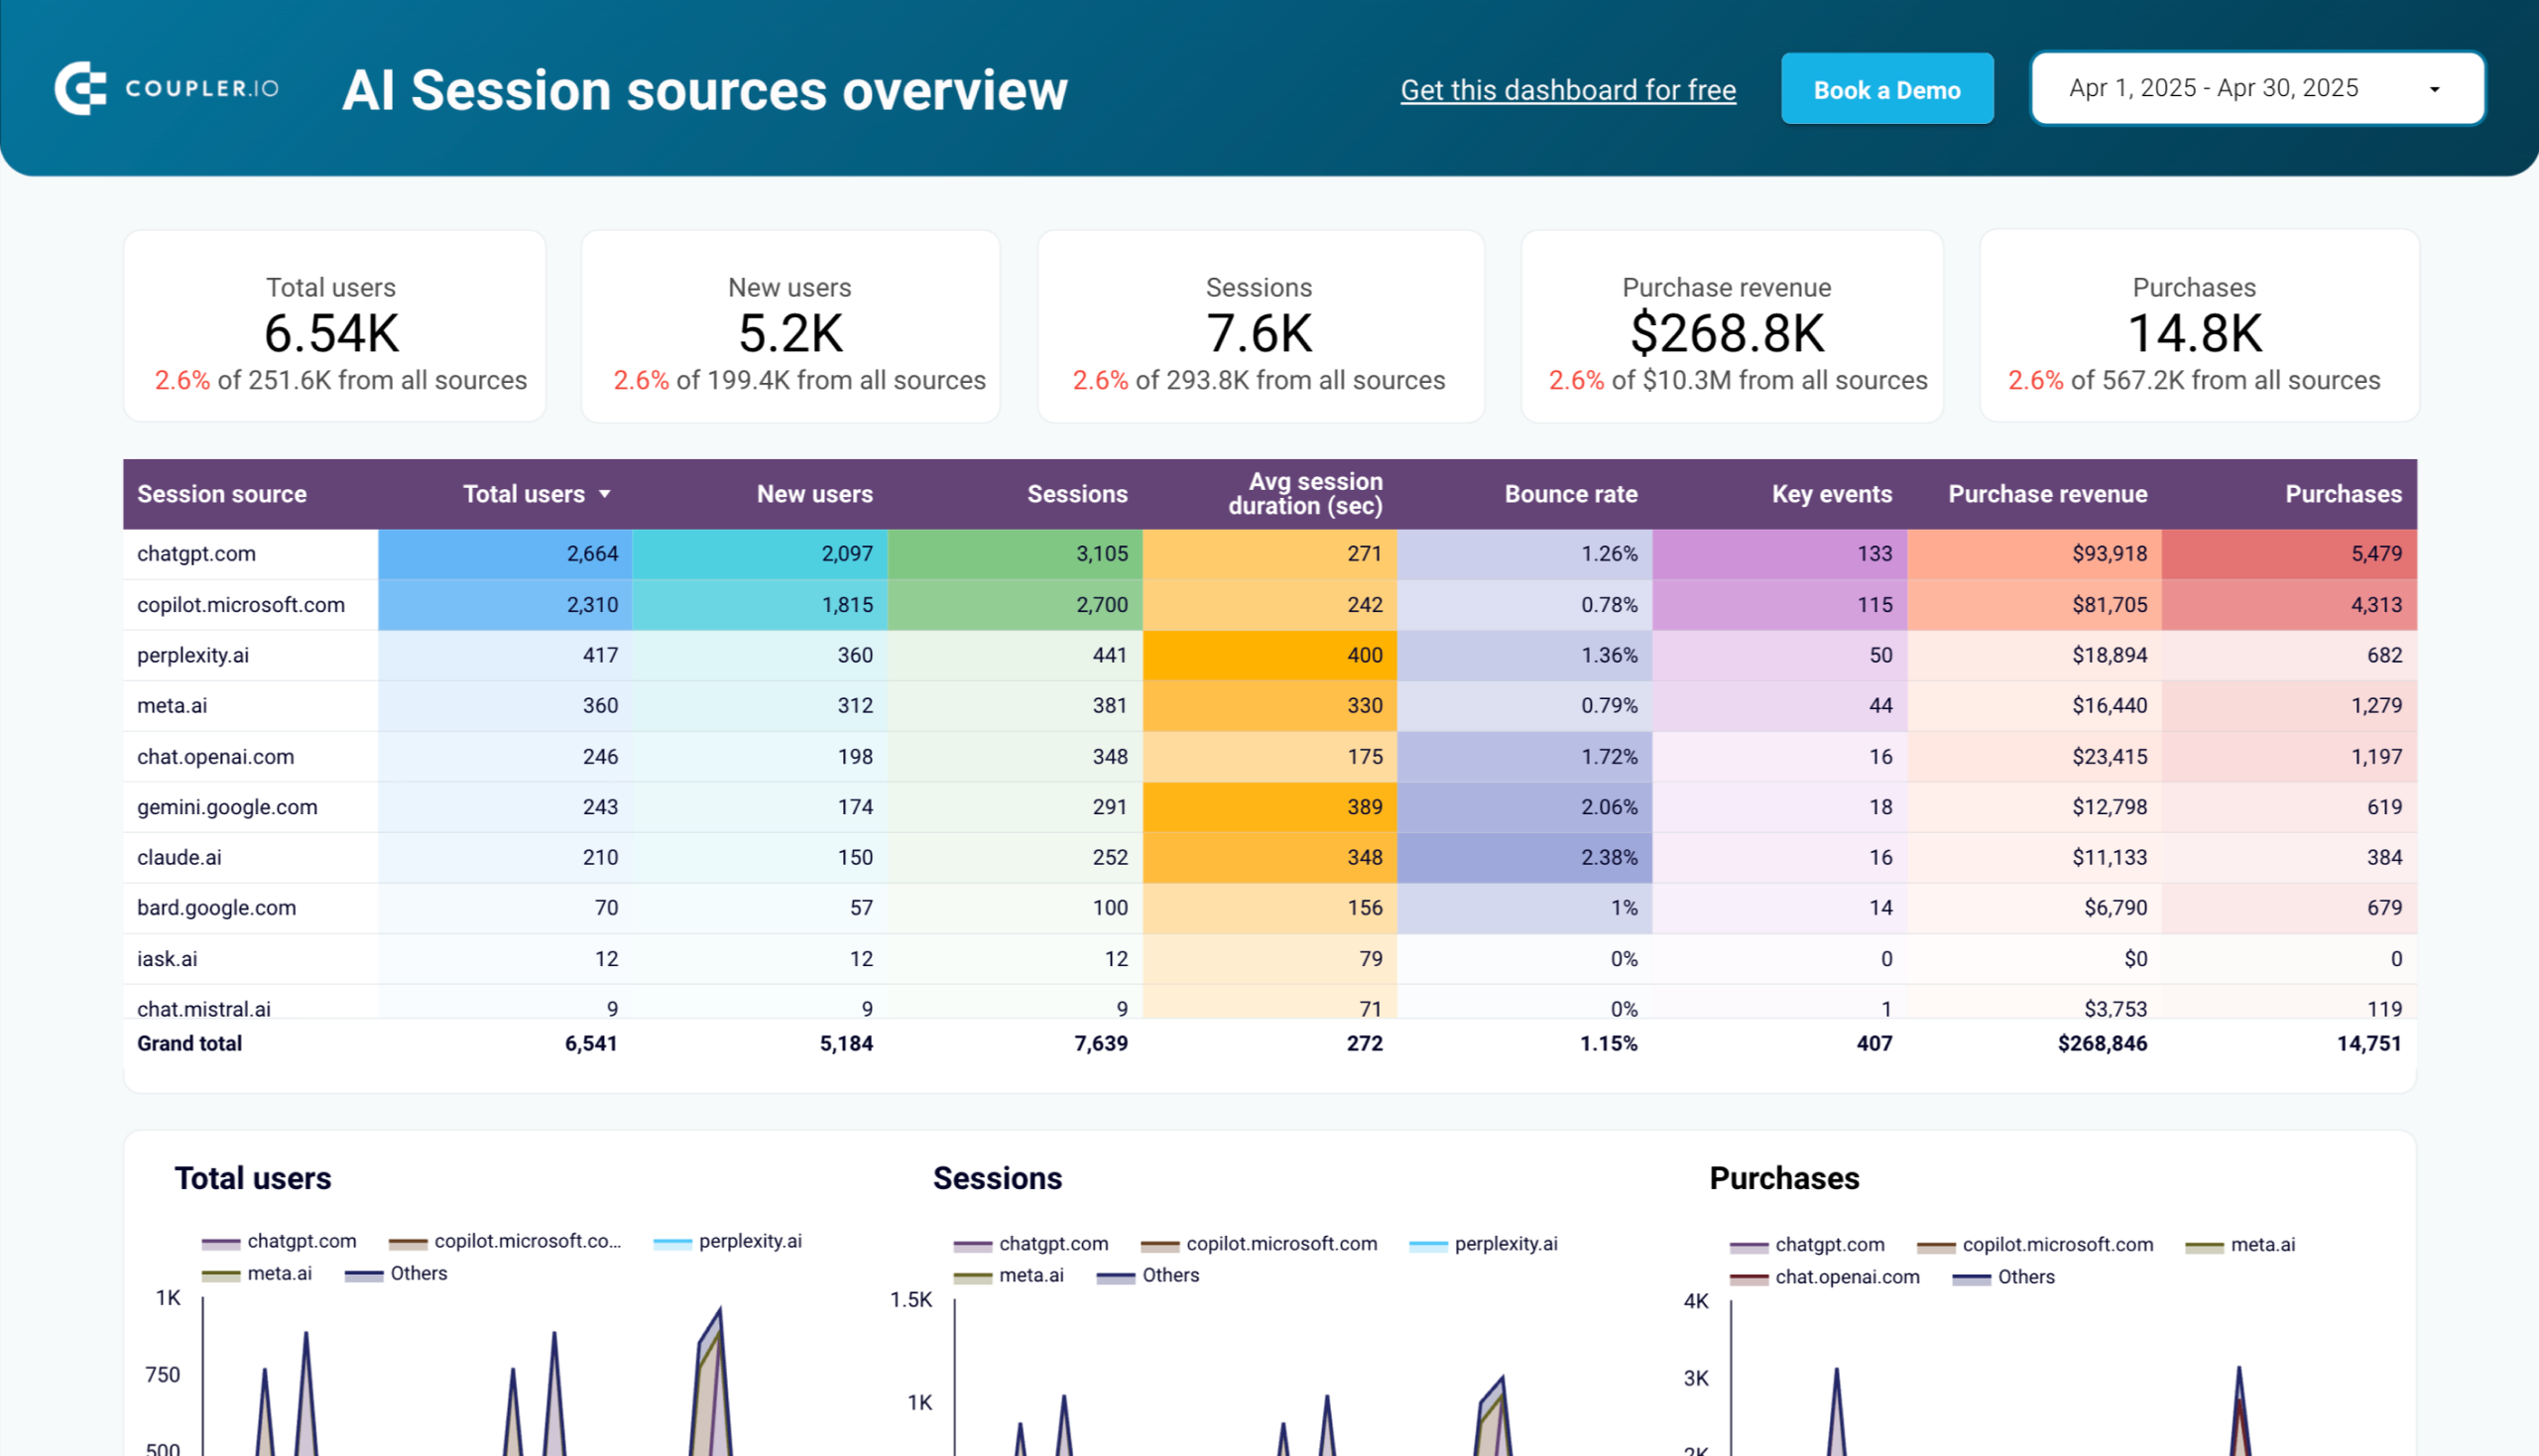
- AI-powered client report: one of the newer PPC reporting examples is Claude Artifact + Coupler.io PPC Skill combo, refreshed against connected data. It’s a fit for agencies running high-volume or high-spend accounts where the value is in ad hoc questions between weekly reports.


PPC reporting tools and software for client reports
Choose a PPC reporting tool based on the work you need to automate: importing data, visualizing results, or investigating changes.
For ongoing PPC management, these options can work together. Your reporting setup may use a spreadsheet for custom reports, a dashboard for regular monitoring, and AI for follow-up analysis.
| Approach | Strengths | Limitations | Best fit |
|---|---|---|---|
| Spreadsheets: Google Sheets or Excel | Flexible calculations, easy annotations, familiar review format | Manual imports and fragile formulas become harder to maintain as accounts grow | Custom analysis and smaller reporting setups; automate imports for recurring work |
| Looker Studio / Data Studio | Interactive charts, filters, reusable dashboards | External sources may need connectors; charts still need interpretation | A standing visual report clients can explore |
| Automated reporting tools and connectors | Scheduled imports, repeatable data preparation, multiple sources and destinations | Require setup, monitoring, and agreed metric definitions | Agencies repeating reports across accounts |
| Coupler AI | Follow-up questions, custom breakdowns, draft narratives | Needs sufficient source detail and review of query assumptions and conclusions | Analysis between reports and faster preparation of the written review |
For a scalable setup of PPC reporting for clients, start by automating the data connections that keep your dashboards up to date. SellThru agency automated more than 35 client dashboards, improved performance-tracking reliability above 95% and managed to cut onboarding from weeks to two to three days.
Coupler AI can work alongside your dashboard when you need to investigate a result or answer a new client question. For conversational analysis, connect the same data to Claude (MCP), ChatGPT (approved App + MCP), Gemini (MCP), Perplexity (MCP), or Cursor (MCP).

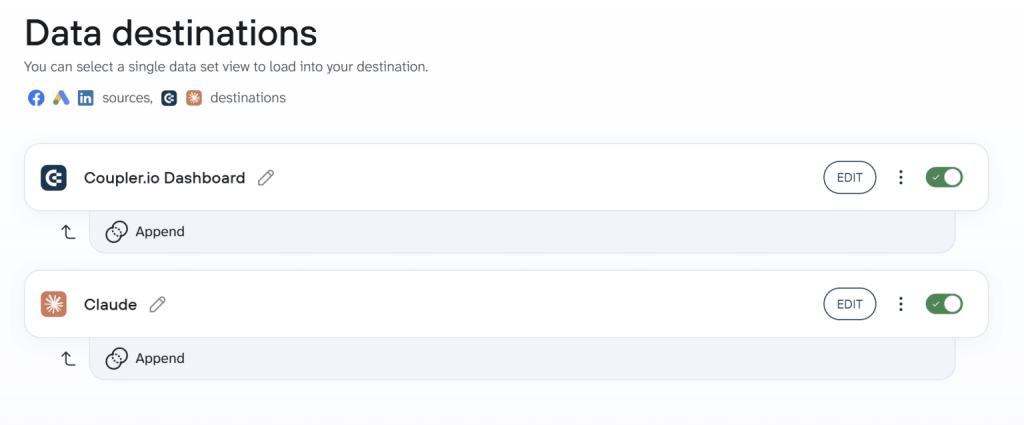
Once your data is flowing both into your dashboard and Claude, you can ask questions, reuse saved Skills, and create reports as Artifacts.
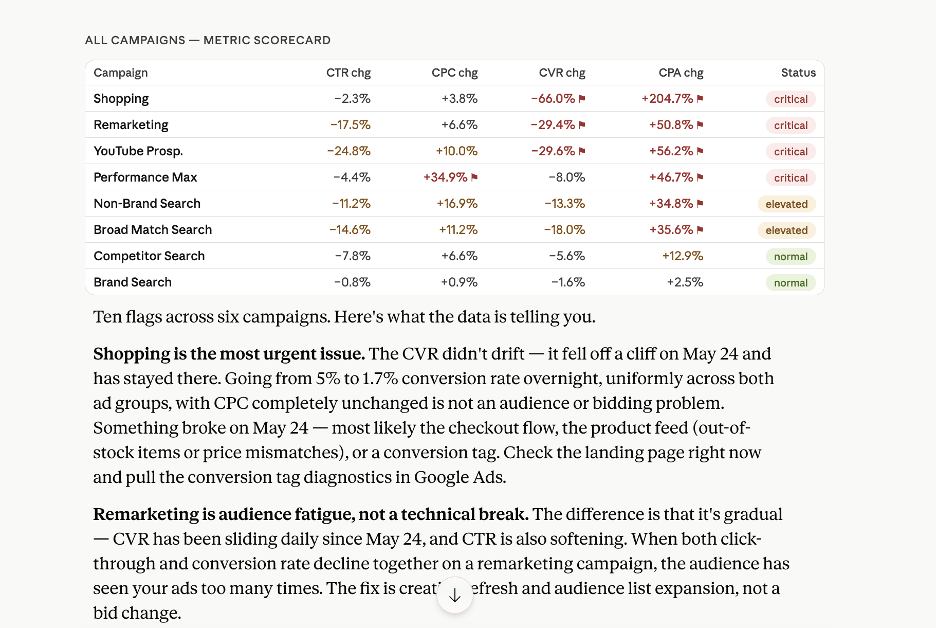
Example: “Review my campaign performance for the last 7 days. Compare each campaign's key metrics, such as click-through rate (CTR), cost per click (CPC), conversion rate, and cost per acquisition (CPA) against its 30-day average. Flag any campaign where a metric has moved more than 25% in either direction. For each flagged item, suggest the most likely explanation and whether I should investigate further.”

Run PPC reporting for every client on Coupler.io
Schedule a callWhat separates a strong PPC client performance report from a weak one
Before sending the PPC client report, review it from the client’s perspective.
A client should be able to read the first page and understand whether the account is on track. If you provide a PPC reporting dashboard, apply the same standard to its opening view. They should also be able to inspect the evidence when they want more detail.
| Check | Strong report | Weak report |
|---|---|---|
| Opening | Shows progress against the business goal | Starts with a wall of platform metrics |
| Comparisons | Uses consistent periods and definitions | Compares incomplete and complete periods without explanation |
| Metrics | Connects cost and volume with outcome quality | Treats cheaper clicks as sufficient evidence of success |
| Analysis | Identifies the campaigns behind the change | Restates percentages already visible in the chart |
| Attribution | Labels platform results and explains the combined view | Adds overlapping platform conversions as unique customers |
| Recommendations | Names the action, owner, deadline, and review point | Ends with “continue optimizing” |
| AI review | Checks totals, definitions, and supporting evidence | Accepts a polished narrative without checking its basis |
| Transparency | Explains weak results and tracking limitations | Omits the numbers that make performance look worse |
Build your next PPC report from one repeatable workflow
Start with the PPC reports for clients you already send most often. Agree on the decision it should support, define the PPC KPIs, and connect the data needed to answer it. Use the same structure each period so the client can follow what changed.
Then use AI for the investigations that usually delay the write-up: which campaigns drove the increase, whether lead quality changed, and what needs a closer look. Review the evidence, add your recommendation, and save the process for the next reporting cycle.
Choose a PPC report template or start with Coupler.io to connect your ad data. Build the standard PPC client report first, then add conversational analysis for the questions that come after it.