Cost per click, impressions, link clicks. These are just a few PPC metrics that marketing specialists need to monitor. But how do you know which ones are crucial for measuring the performance of your ads?
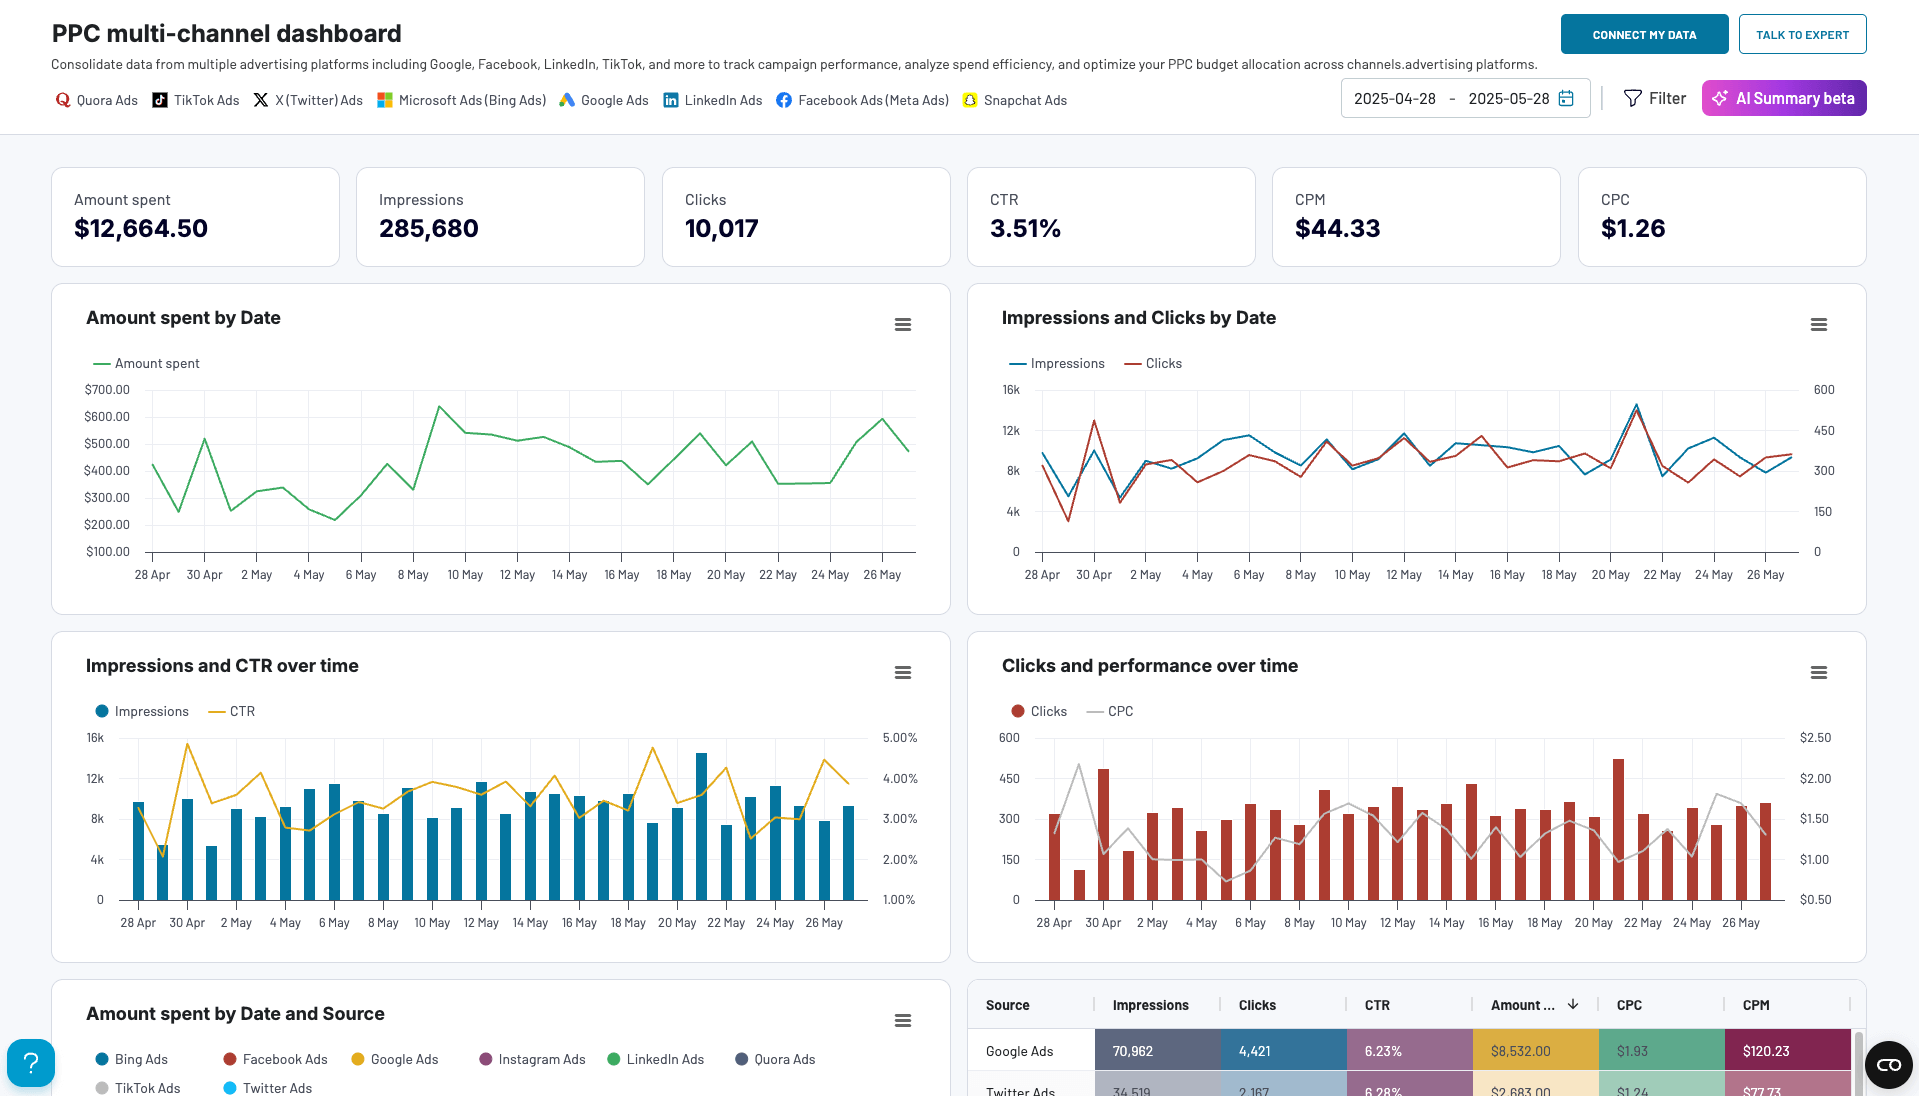
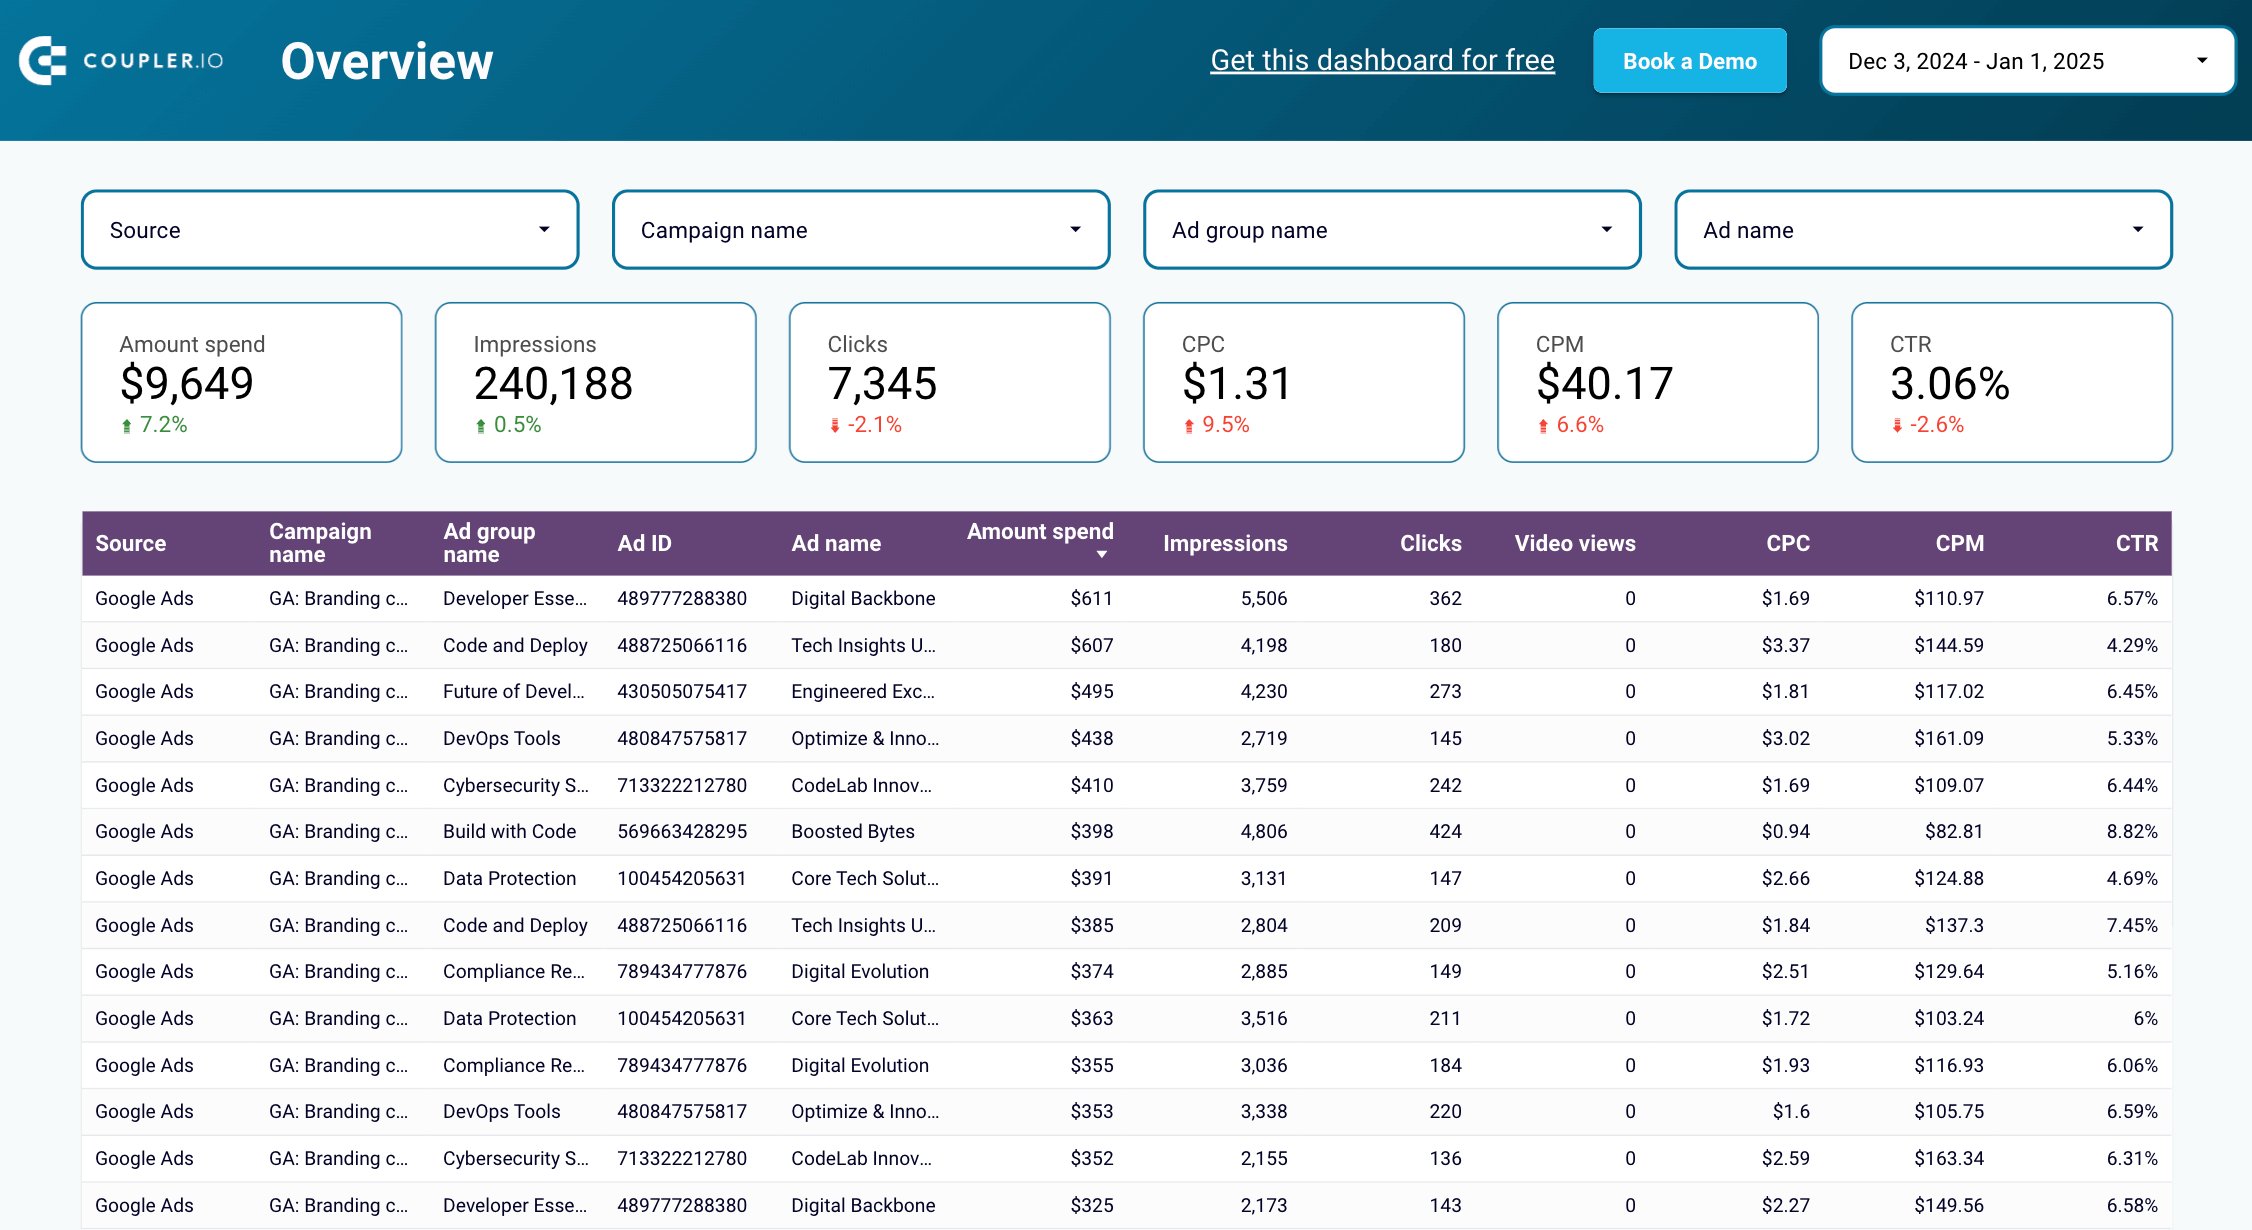
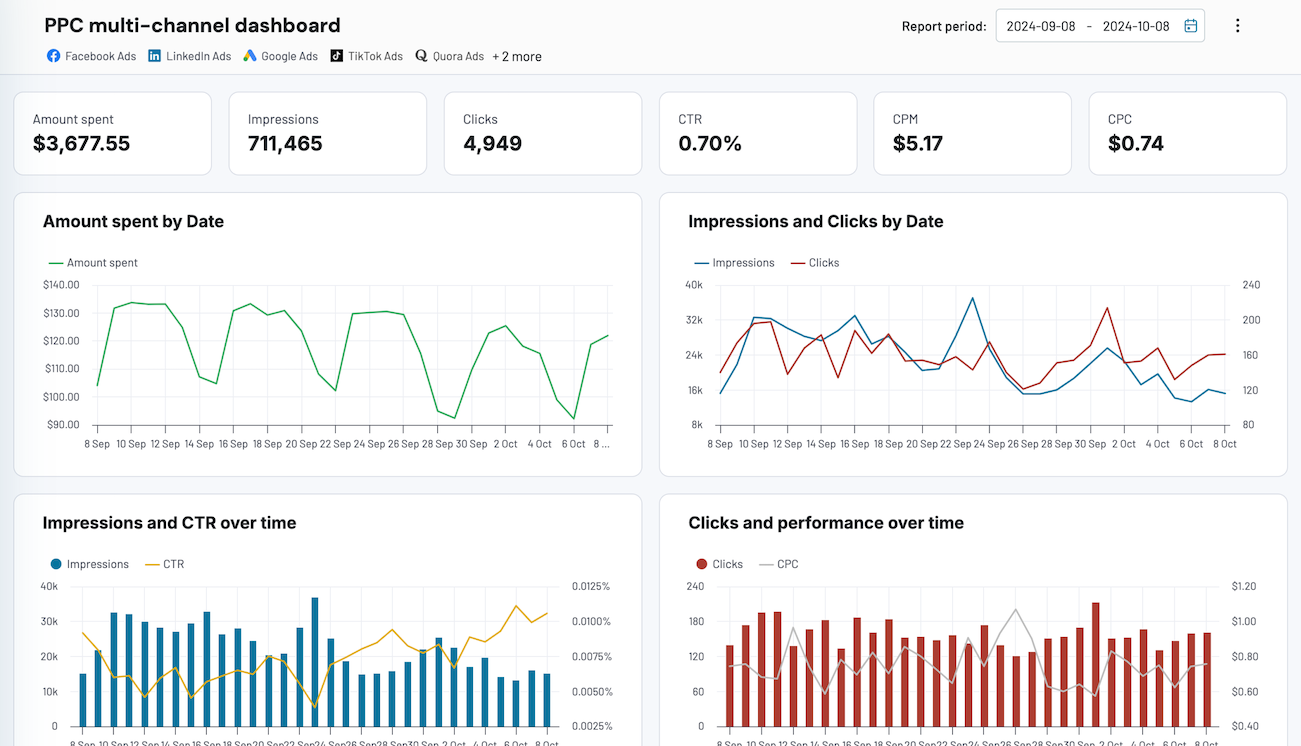
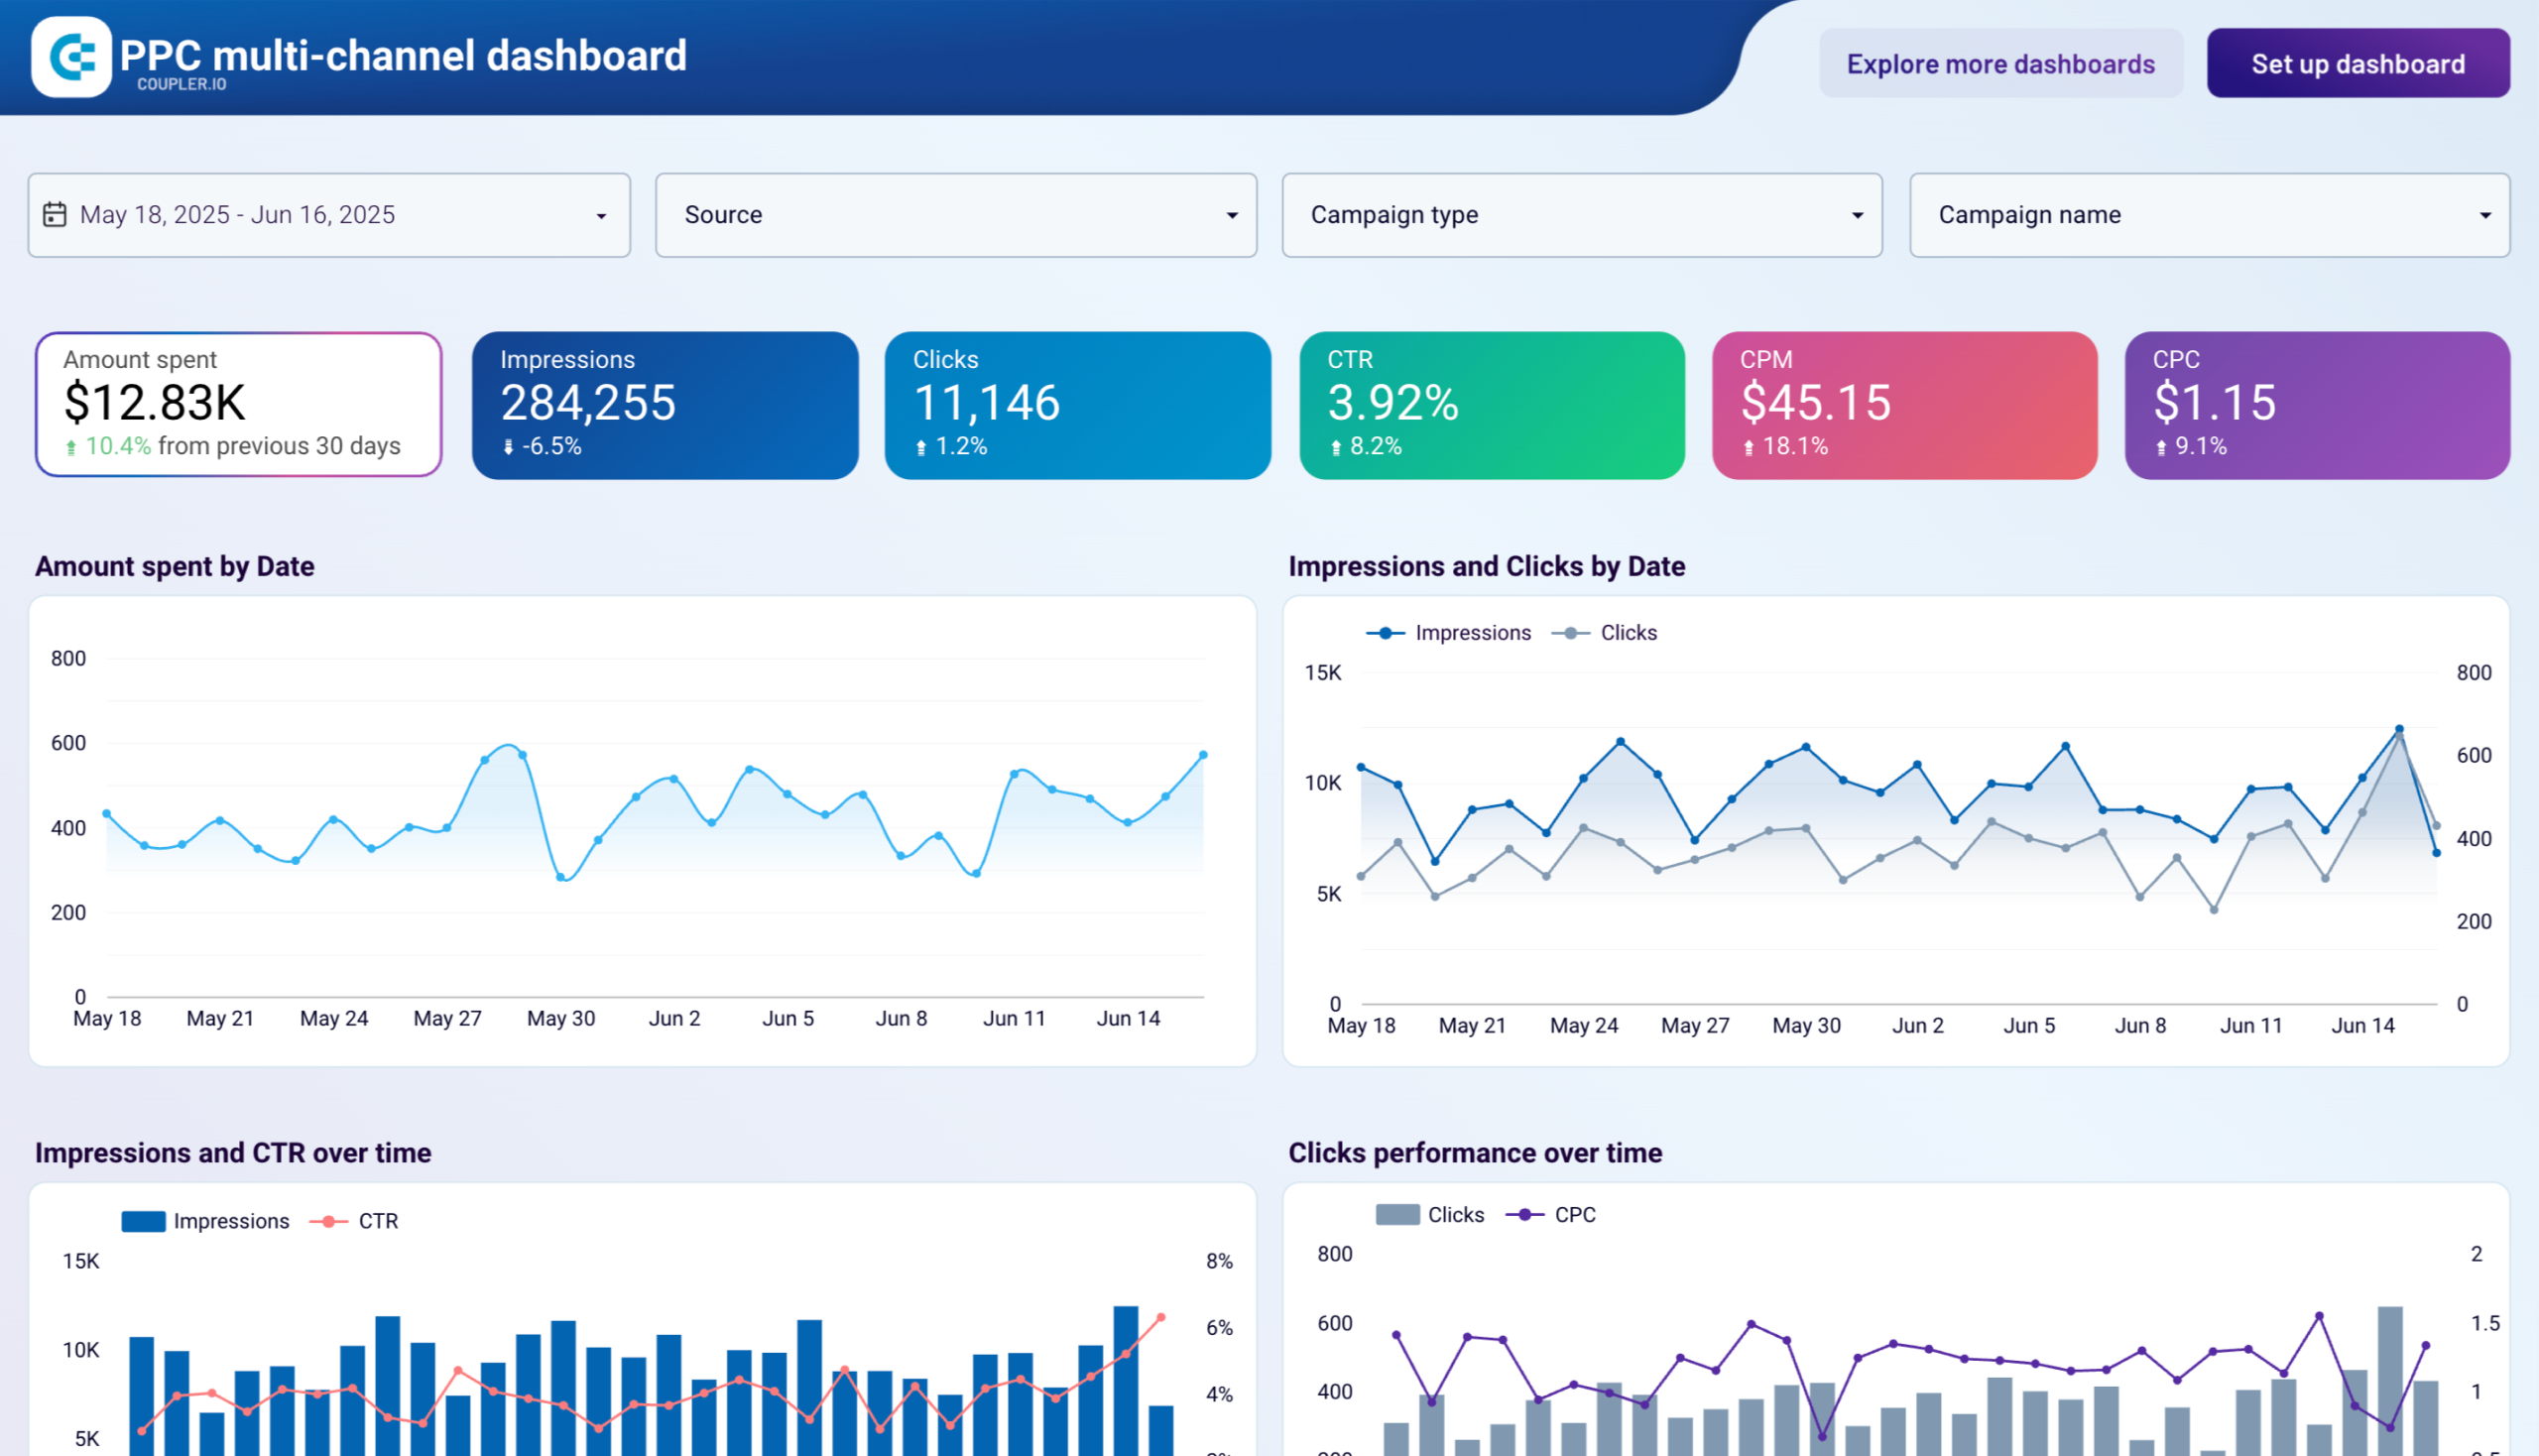
We created an in-depth list of the most important key PPC metrics that will help you sort this out. Also, we show you how to effectively measure these metrics with a PPC multi-channel dashboard like the one below.
The most important PPC metrics to measure
1. Impressions
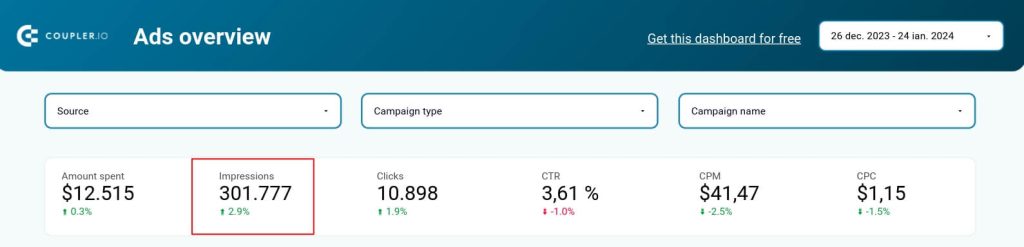
This PPC metric indicates the number of times your ad appeared on a screen. Whether or not the user actually clicked on the ad, it will still be counted as an impression. Additionally, it’s possible for one user to see the ad several times, and each instance would be considered a new impression.
You should keep an eye on impressions because this metric shows the reach of your ad. If the ad has a lot of impressions, it means that it is shown frequently. This can have a great impact on brand awareness. Also, keep an eye on impression share. This shows how many potential impressions you could have earned against how many ad auctions included your ad.
How to optimize
You need to choose attractive visuals and catchy headlines to increase the number of impressions and impression share. Also, you can expand your target audience, optimize the ad placement, or increase the bid in campaigns for a higher reach.
2. Link clicks
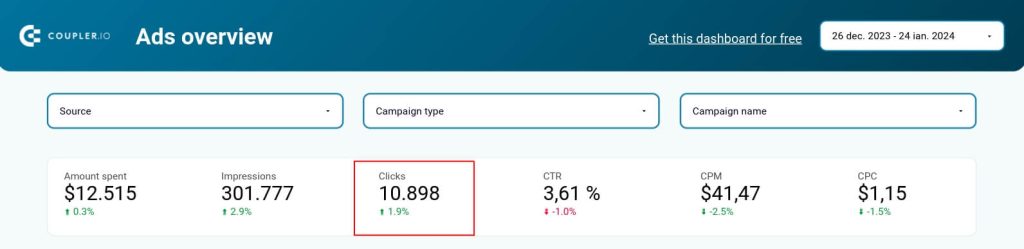
Like its name states, this PPC metric shows how many times a user clicked on your ad. This includes all clicks made by a user that moved them to a landing page. It doesn’t matter if they clicked on the call to action, banner, or another linked element.
Link clicks show you if your ad is engaging enough for users. This PPC metric highlights the user’s interest in learning more about your product or services.
How to optimize
If your ad does not have many link clicks, you can increase this number with a few simple things. Add more creative visuals, use stronger call-to-action messages, and ensure your ad’s message reaches the right audience.
3. CTR (Click-through rate)
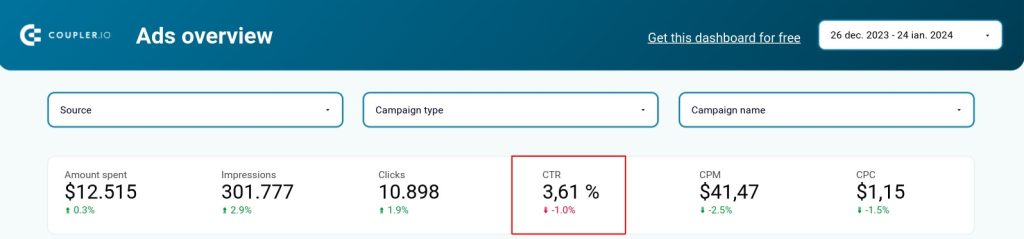
Short for click-through rate, this metric shows the percentage of people who clicked on the ad. Divide the number of clicks by the number of impressions, then multiply it by 100, and you’ll see the CTR.
CTR Formula
CTR = (Clicks ÷ Impressions) x 100
The click-through rate shows the effectiveness of your ads. The bigger the CTR, the better and more engaging your campaign is for the audience.
The standard benchmark for this PPC metric varies from 0.5% to 1% in social ads to 5%-6% in Google Search Ads. Of course, this number varies depending on the industry, ad platform, and target audience.
How to optimize
For a high CTR, you should consider optimizing your target audience to reach more relevant customer segments. Also, you can perform A/B testing to see which variation of your ad is performing better.
4. CPC (Cost per click)
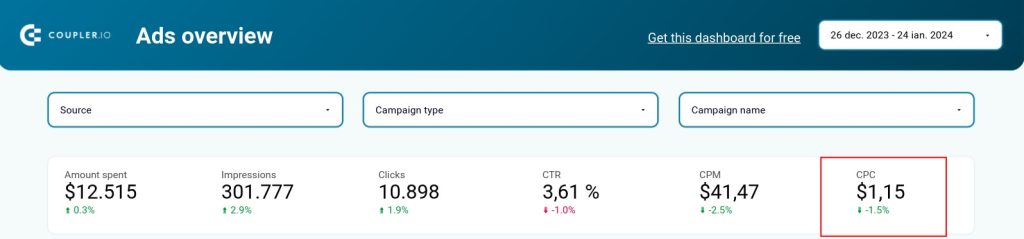
This metric shows how much you spend for each click on your ad. To calculate CPC, you divide the total number of clicks by the total cost.
PPC specialists should track this metric because it can help them manage ad budget effectively. The cost per click helps you understand how much you pay for users’ engagement with your ad.
There are different benchmarks for each ad platform for this PPC metric. For instance, for Google Ads, a good CPC is around $2.5, while for LinkedIn Ads it can reach $5. The lowest cost per click is on Facebook Ads, where a good CPC is less than $2.
How to optimize
Here are some tips that can help you lower CPC and effectively manage your ad budget:
- Enhance the ad relevance
- Try different bidding strategies
5. CPM (Cost per mille)
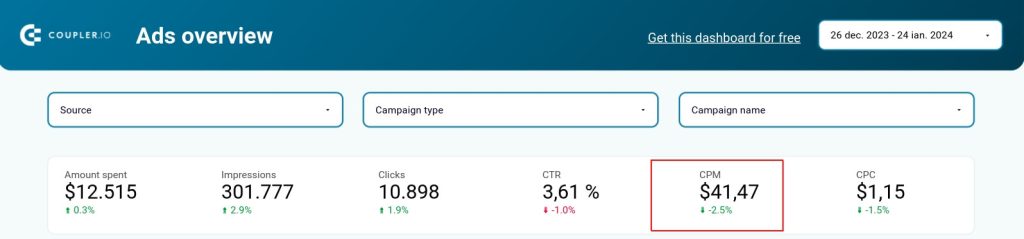
This metric shows you the amount spent for 1000 impressions. It is a metric used especially for branding campaigns where the goal is to increase the brand’s visibility.
Keep track of your CPM for awareness campaigns to effectively manage the ad budget.
How to optimize
To decrease the CPM, you should adjust the target audience and broaden it. Also, using A/B testing to see which ad performs better is helpful.
6. Amount spent
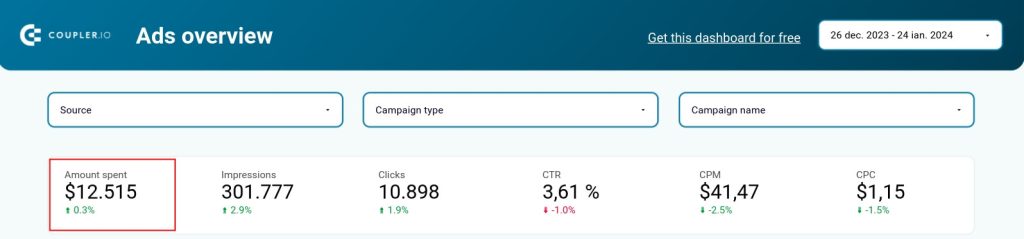
Amount spent shows you how much money you spent on your ad campaign in a period.
Of course, this is a crucial PPC metric because it shows if your budget aligns with your overall marketing strategy and plan.
How to optimize
To lower the amount spent, you will need to review your ad’s performance compared to your top-performing campaigns. Make sure to pause any underperforming campaigns and adjust the budget of high-performing ads.
Learn more about performance marketing for SaaS.
7. Conversions
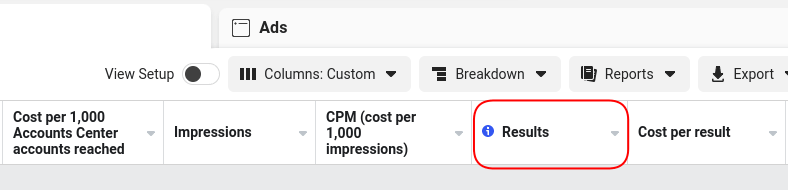
This measurement indicates how many users performed the desired action after seeing your ad. For instance, if you have an ad promoting the download of an e-book, this metric will reveal the number of users who actually downloaded the content. Of course, the specific action varies based on the objectives of your campaign. This can include various activities, such as subscribing to a newsletter or completing a purchase.
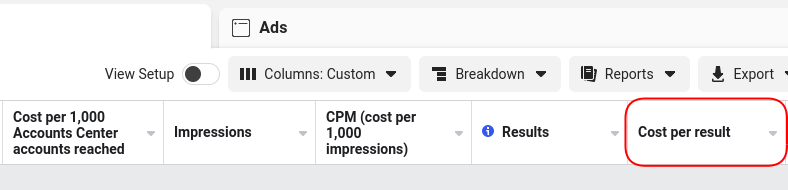
On different ad platforms, you can find marketing conversion metrics under different names, such as results or website conversions.
Total conversions show you the effectiveness of your ad. Also, conversions give you insights about the ROI (return on investment) of your campaigns.
How to optimize
To increase conversions, you should optimize your landing pages. Modify the ad message to match the one from the landing page. If you make a statement in the ad copy to attract users but don’t follow through on the landing page, you risk having a high number of clicks with no conversions. Also, you can A/B test your creative assets, experiment with different audience settings, and try different bidding strategies. Use the dedicated dashboard by Coupler.io for ad creatives performance tracking.
Multi-channel creatives performance dashboard
 Preview dashboard
Multi-channel creatives performance dashboard
Preview dashboard8. Cost per conversion
This metric shows you how much you spend for every conversion. To calculate the cost per conversion, divide the total cost of the campaign by the number of conversions.
This key metric shows how profitable and effective your campaigns are.
How to optimize
Improve the conversion rate and target the right audience to lower the cost per conversion. Also, ensure that your bidding strategy is focused on conversion, not visibility.
9. ROAS
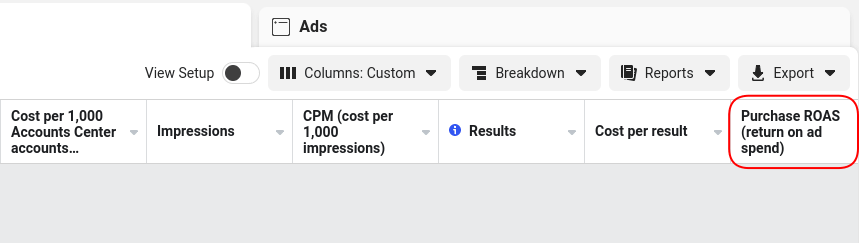
Short for Return on ad spend, ROAS is a major metric for every marketer. Like conversion, ROAS tracks the overall revenue your ads bring in. It then takes that revenue number and puts it up against your spending.
The higher the ROAS, the more effective your ads are. This metric is critical for monitoring the performance of your campaigns and seeing what tangible results you receive for your ad budget.
A good ROAS is 4:1. This means $4 revenue for every $1 spent.
10. Conversion rate
Another important metric you should be tracking is the conversion rate. This metric used in PPC ads looks at how often you pull in a conversion in relation to your clicks.
This metric is the cornerstone of any ROI-driven advertising strategy. If you don’t have a healthy conversion rate, you know you’re paying for clicks that aren’t converting. The benchmarks vary a lot depending on the industry and type of conversion. However, the average conversion rate for ecommerce is 2-3%.
How to optimize
To increase the conversion rate, optimize the landing page and provide a seamless user journey from ad to conversion. Also, make sure that your ad content is both relevant and targeted.
11. Customer Acquisition Cost (CAC)
This metric shows you the cost of acquiring a customer. It’s calculated by dividing the total cost of the campaign by the number of acquisitions.
You need to track it closely to optimize your ad budget and get an overview of your PPC performance.
How to optimize
Reduce the cost per customer acquisition by refining your target audience. Also, improving the conversion rate and enhancing the quality score of your ad will help with CAC as well.
How to optimize
To increase return on ad spend, you should target high-value customers and improve the conversion rate. Also, you should optimize the customer journey to increase the average order value.
Other key PPC metrics
In addition to the most essential PPC metrics from our list above, you can also track and analyze some other metrics. They will provide you with more context and information for deeper PPC analytics.
12. Ad frequency
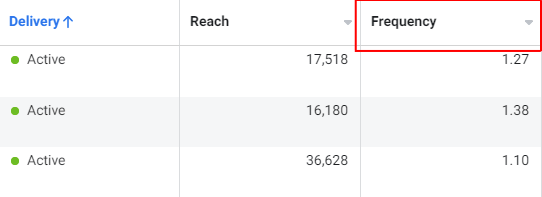
Since we talked about impressions, we also need to mention ad frequency. This metric shows how many times each person has seen your ad. You can calculate it by dividing the number of total impressions by the total reach.
Monitor this metric to see how frequently your audience is seeing your campaign. If the ad frequency is too high, then users might get tired of constantly viewing your ads. However, if the ad frequency is too low, this can mean underexposure. A good ad frequency is between 2 and 3.
How to optimize
To improve ad frequency, you should change your ad creatives regularly and segment your audience to prevent overlaps. Also, you can use frequency capping to avoid a situation when one person sees your ad too many times.
13. Lead form opens
Ad platforms have ad formats where users can leave their contact data directly in an ad via a lead form. This metric shows how many times users have opened the lead form attached to your LinkedIn ad, for instance.
This metric shows you if users are interested in your products or services.
How to optimize
To increase lead form opens, you need to make the ad as engaging as possible and use CTAs that are compelling for your target audience.
14. Leads
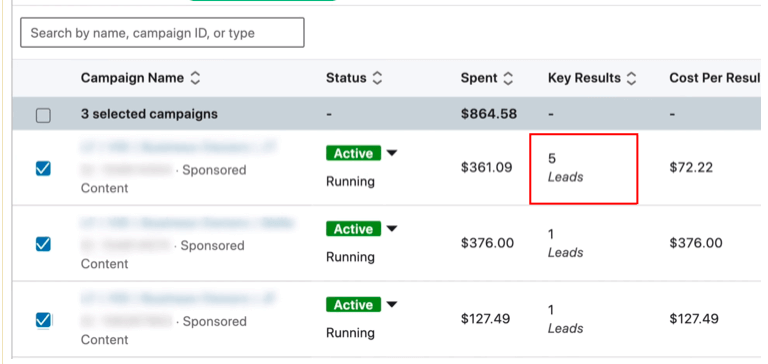
Leads is the next important PPC metric,. It shows the number of people who opened your Lead form, completed it, and submitted it.
Track this metric to check the effectiveness of your LinkedIn ads when it comes to generating qualified leads. Also, keep an eye on cost per lead to ensure you stay within budget while fulfilling your business goals.
How to optimize
To increase the number of leads, make the lead form as user-friendly as possible. Request only necessary data from your potential customers to avoid making the form intrusive.
15. VTA (View through Conversions)
A view-through conversion happens when a user sees your ad but does not take an action immediately. However, after seeing the ad, they can convert later by going directly to your website or by doing a separate organic search. In this case, you have a view-through conversion.
It’s useful to keep an eye on this PPC metric if you want to evaluate the effectiveness of your campaign.
How to optimize
To improve VTA, you will need to create engaging ads that will motivate users to take action and convert even some time later after seeing the ad.
16. Cost per view
This is the average cost you pay for each view of your ad. It only counts if the user looks at your ad (videos) for a certain amount of time. This duration can differ from one platform to another.
Measuring this metric will help you analyze the cost-effectiveness of video ad campaigns.
How to optimize
To lower the cost per view, create engaging videos, relevant to your target audience. It’s best to experiment with different video lengths and formats until you find the right ones for your audience.
Read this article for an in-depth look at PPC benchmarks and statistics across industries and platforms.
How to track PPC metrics with dynamic dashboard templates
Coupler.io is a reporting automation solution that turns raw data into simple reports. It lets you pull data from your add platforms and other analytics sources and create custom ads dashboards in spreadsheets or BI tools. In addition to that, Coupler.io offers a number of ready-to-use paid search dashboard templates to track the metrics mentioned above. This way, you don’t have to create a report from scratch. You only need to connect your source accounts and get a dashboard populated with your data. Let’s explore which templates you can make use of.
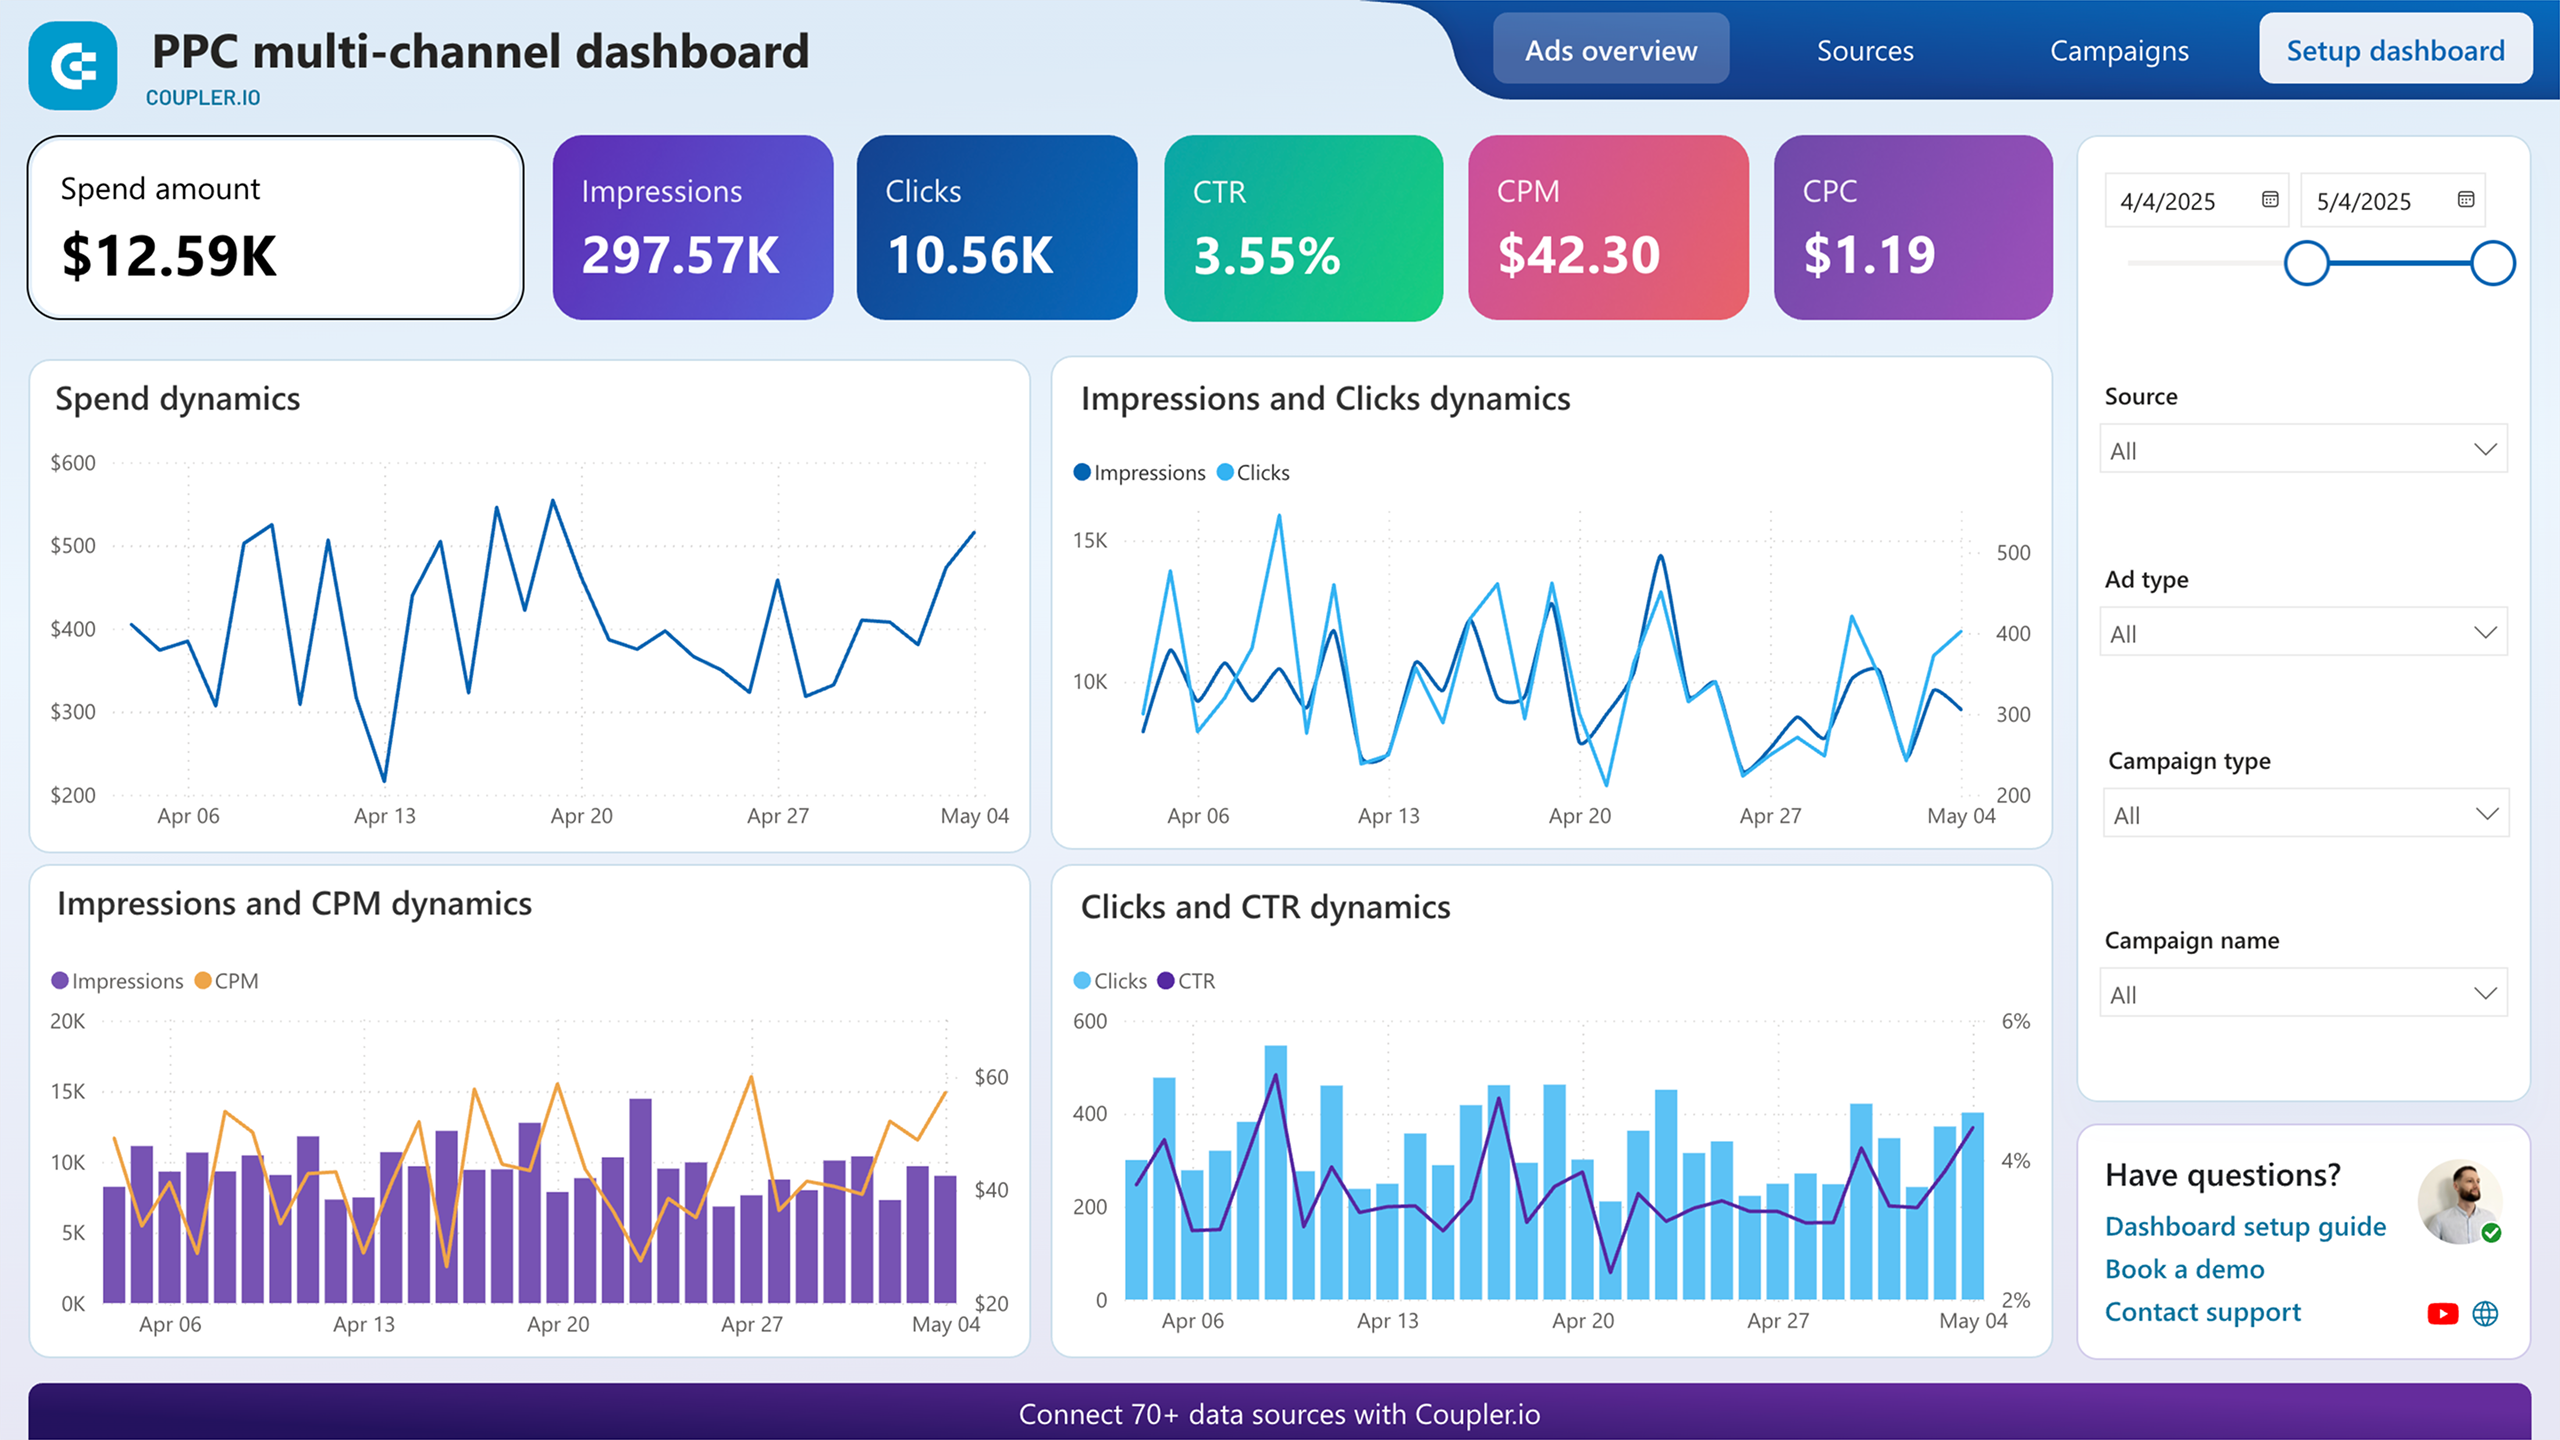
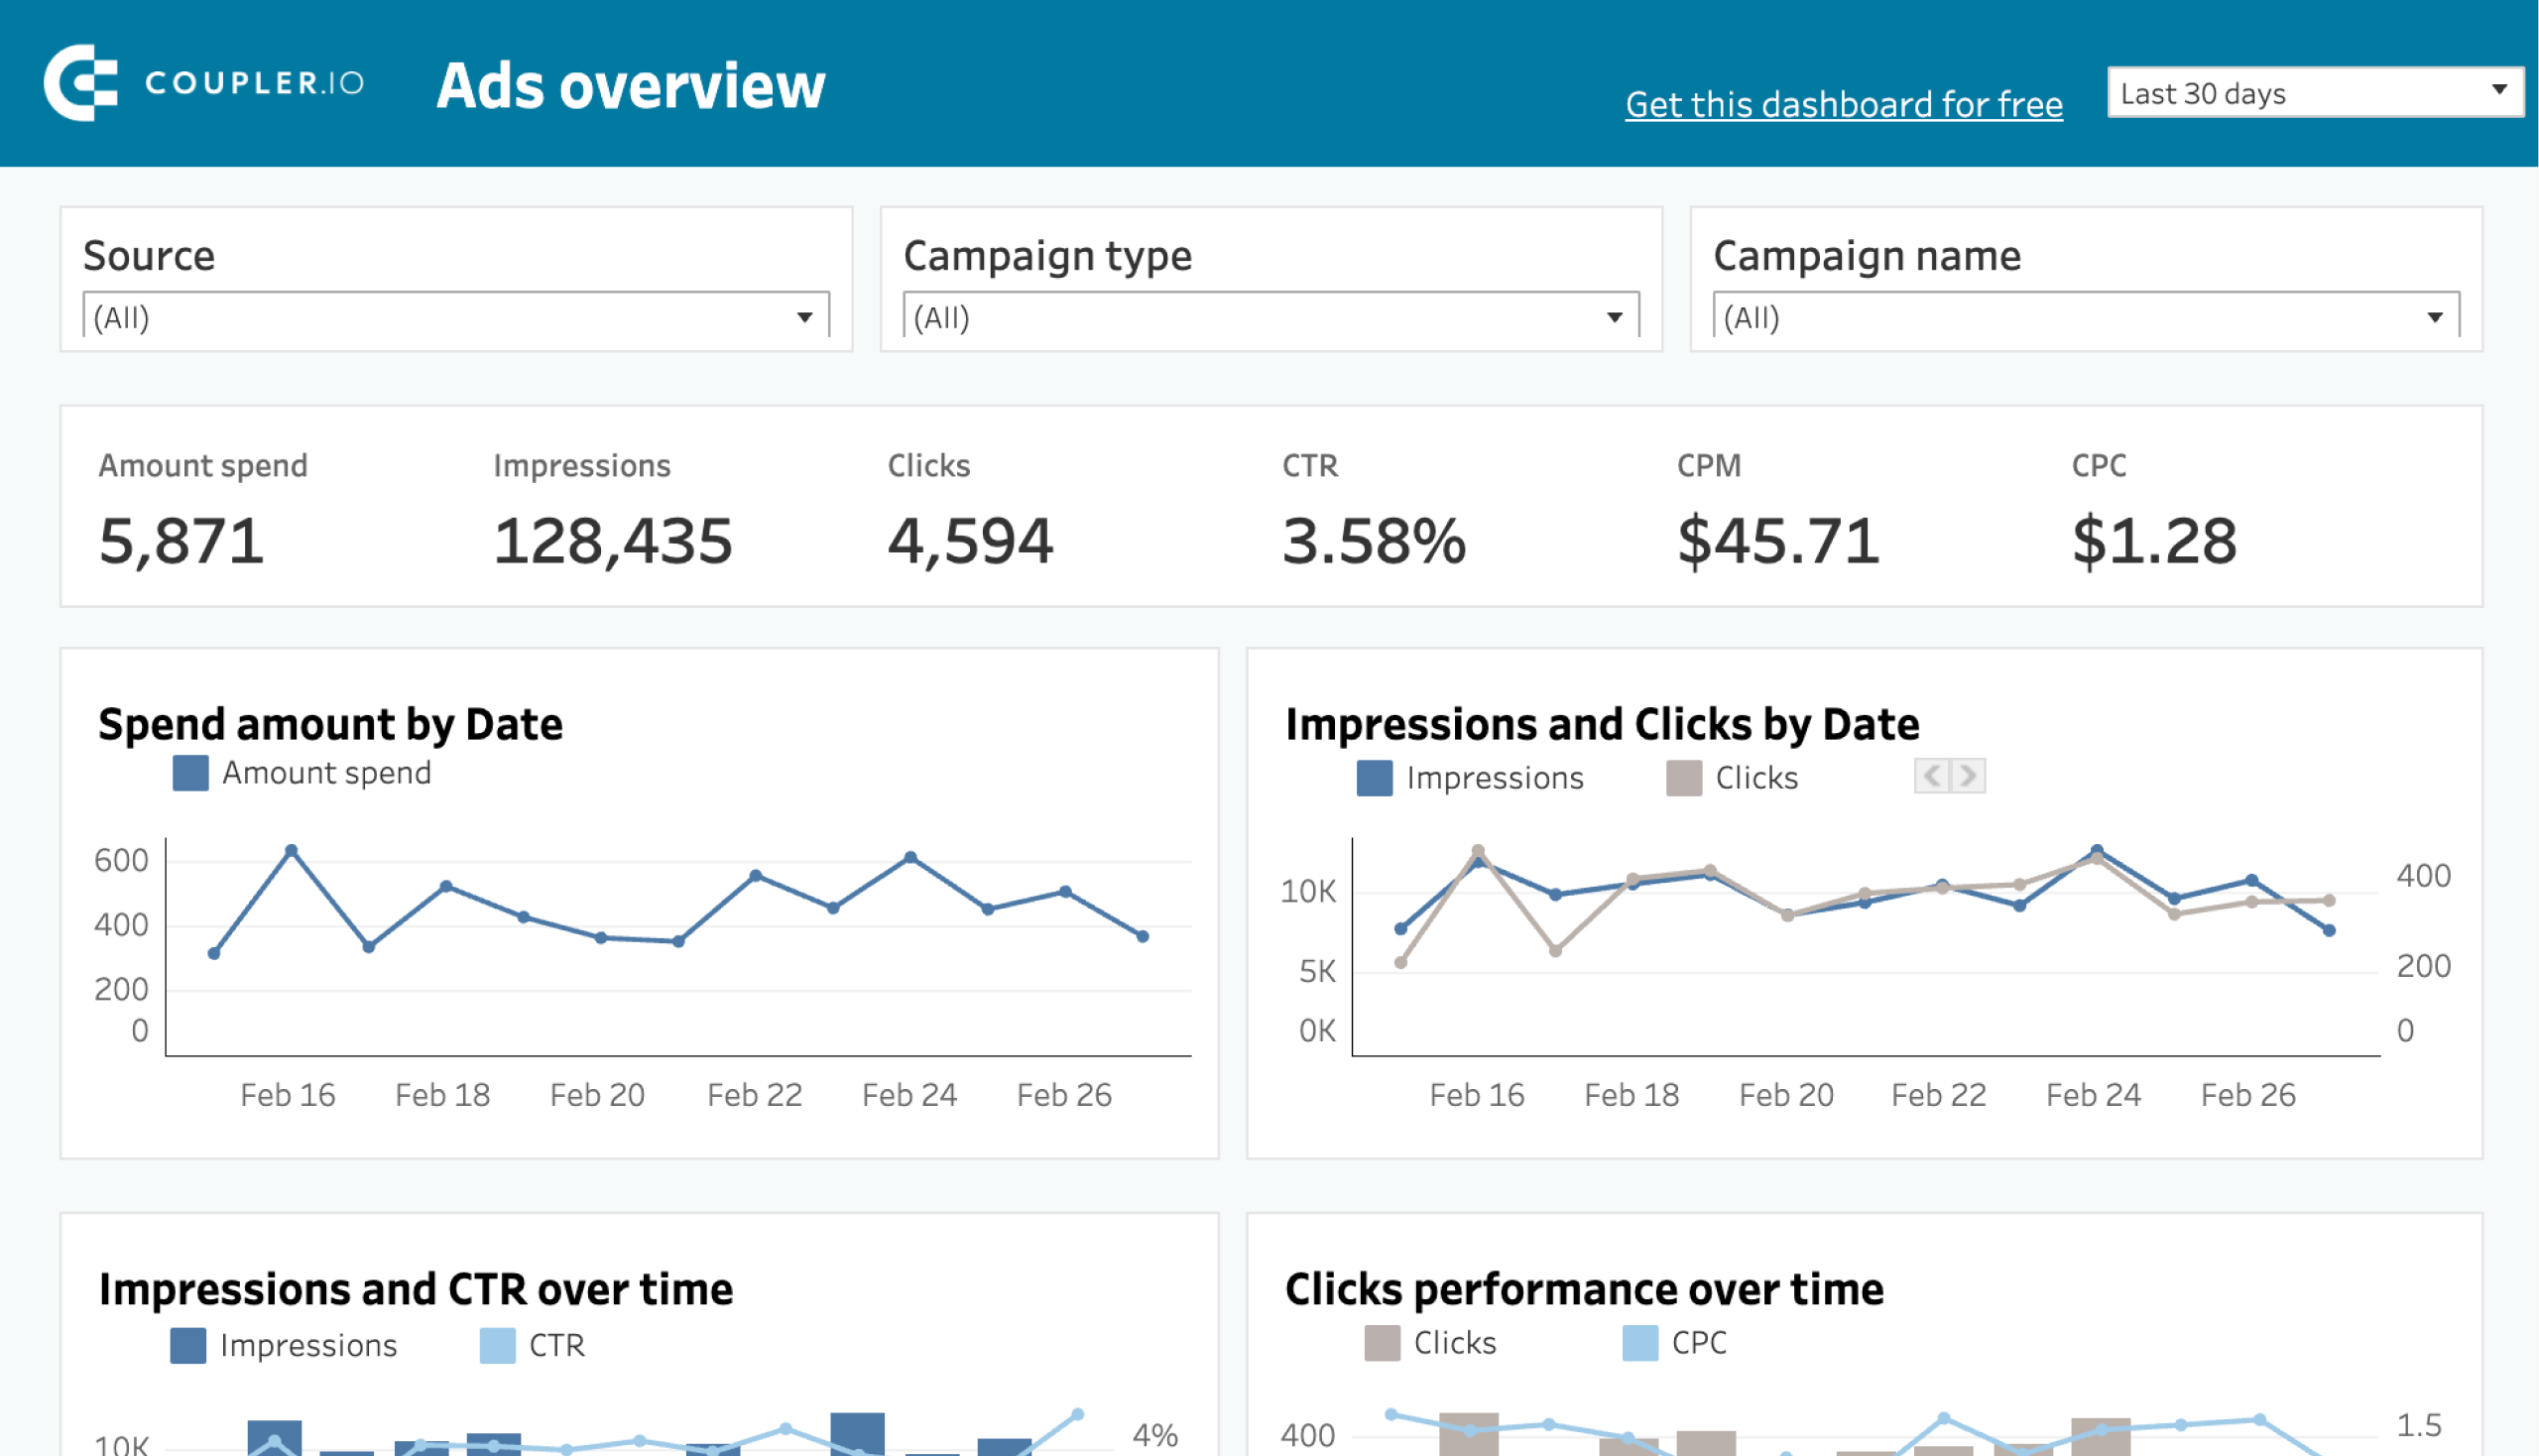
PPC multichannel dashboard template
You can get a self-updating dashboard with data from Google Ads, Facebook Ads, TikTok Ads, and other platforms in just minutes. It’s very convenient because you won’t need to check your metrics in each app separately to have a complete overview of your ad performance.
Plus, with this PPC multichannel dashboard, you will be able to conduct cross-channel analysis. This comes with many benefits, including better budget allocation and improved ROAS.
After creating a Coupler.io account for free, you can connect your ad sources one at a time. Follow the instructions in the setup wizard and only add the ad platforms that you use.
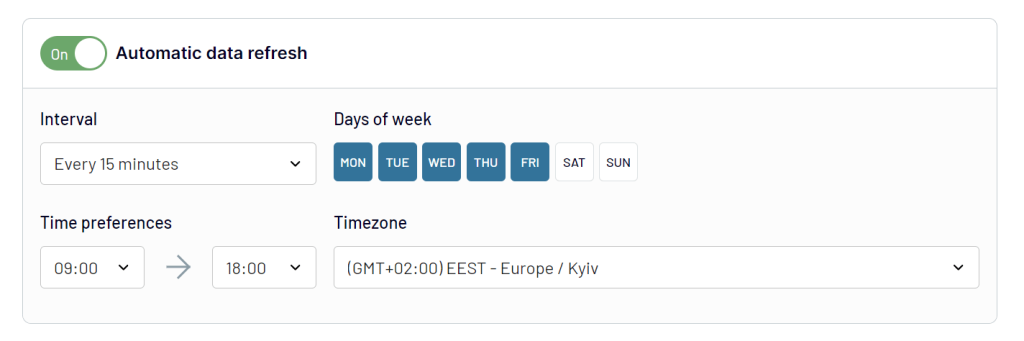
You will be redirected to a copy of the PPC report with your data shortly. The best part? This dashboard will update automatically every day. For a more frequent data refresh, you can go back to the Coupler.io integration you set up and modify the schedule. You can have your data updated as often as every 15 minutes.
For quick access, we recommend bookmarking this PPC dashboard. You’ll be able to have an overview of your ad’s performance in a matter of seconds.
You can also use this cross-channel PPC dashboard template in Looker Studio, Google Sheets, Power BI, and Tableau.


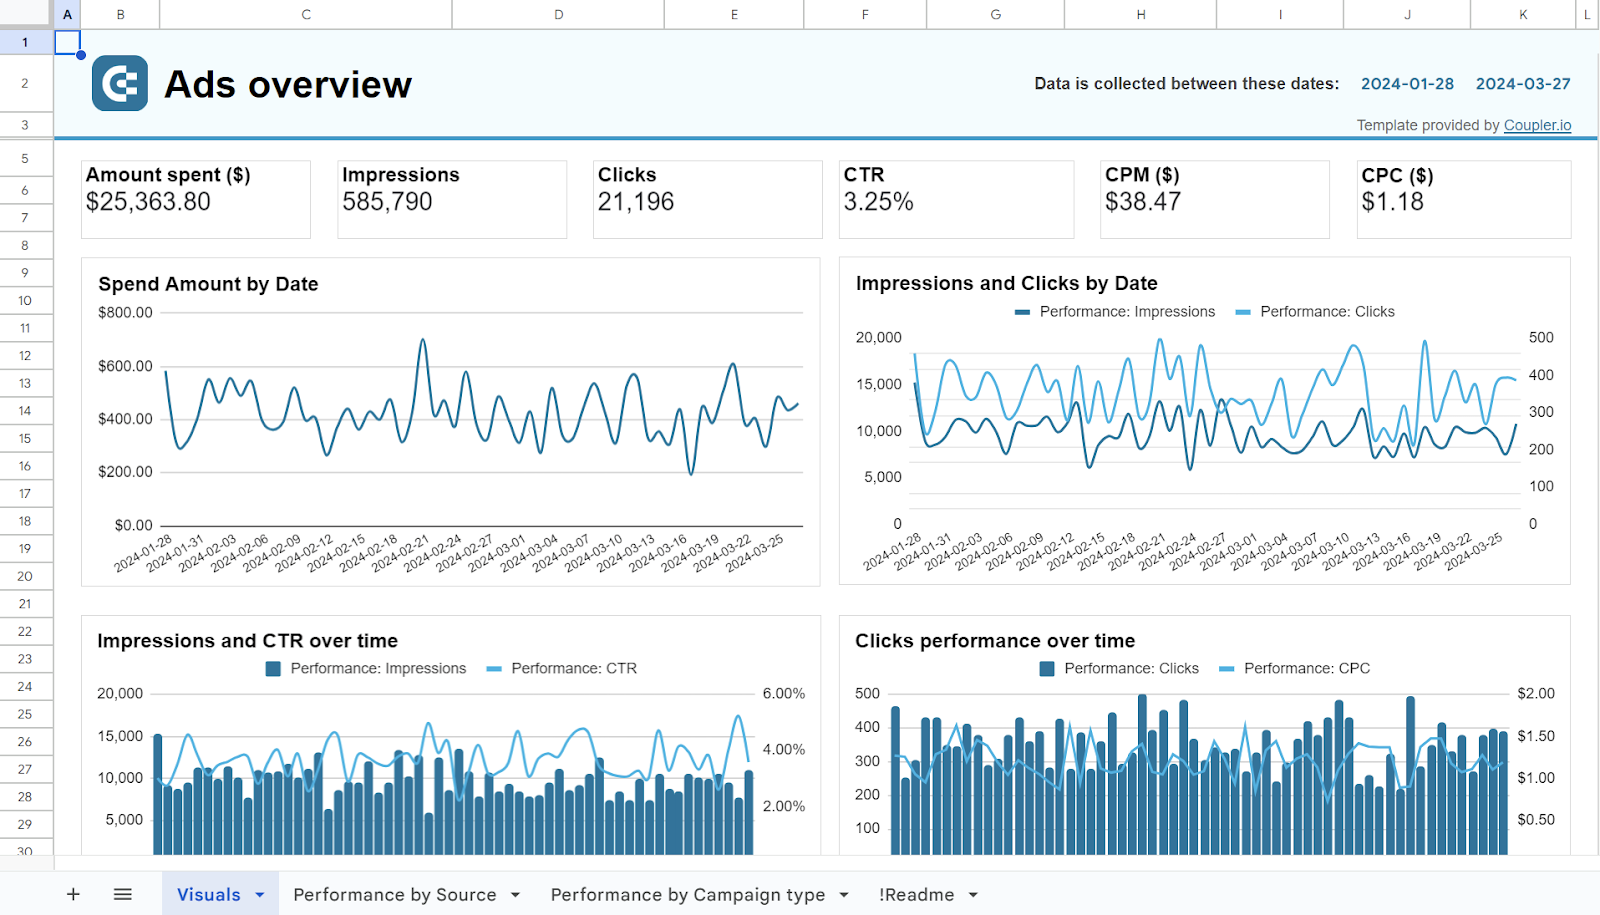


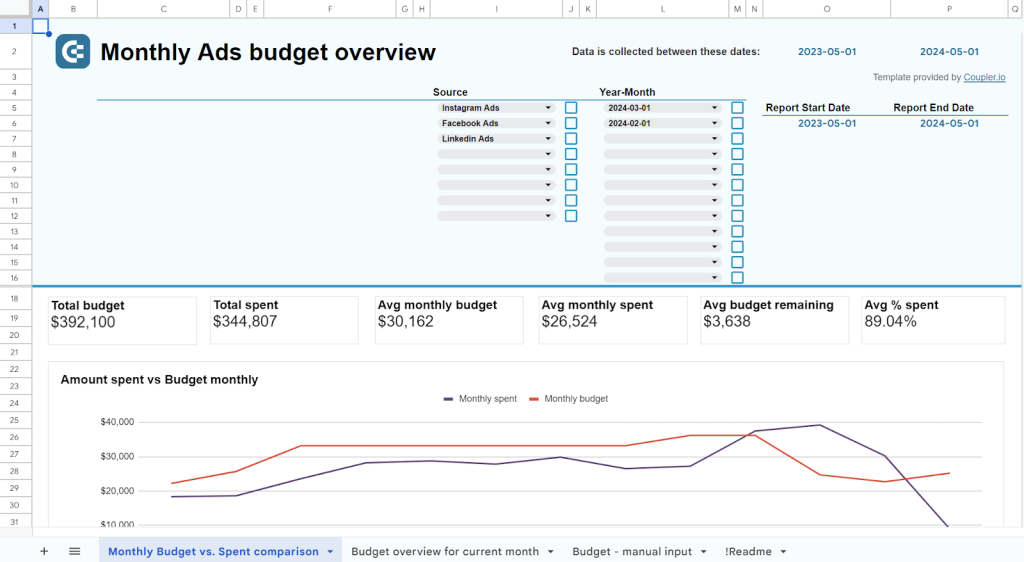
PPC monthly budget dashboard template in Google Sheets
Our PPC monthly budget dashboard template is mostly focused on financial metrics such as ad spend, monthly budget, and others. It lets you track the dynamics of spending on advertising and provides a budget overview for the current month with spending predictions and alerts to avoid budget overspending.
In addition to multichannel PPC dashboards, Coupler.io also offers one-source templates designed for reporting based on the data from specific da platform.
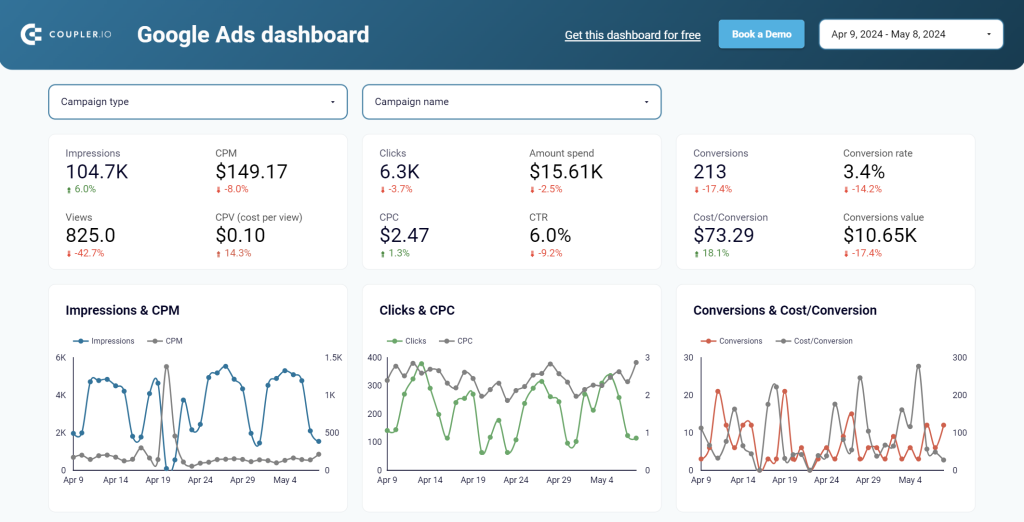
Google Ads PPC dashboard template
Using this dashboard template is very easy. You will only need to connect your Google Ads account to Coupler.io. All the settings are already pre-selected, so the relevant data will be extracted and visualized automatically in a matter of minutes. Once this is done, you will get your ad performance analytics in either Looker Studio or Power BI.
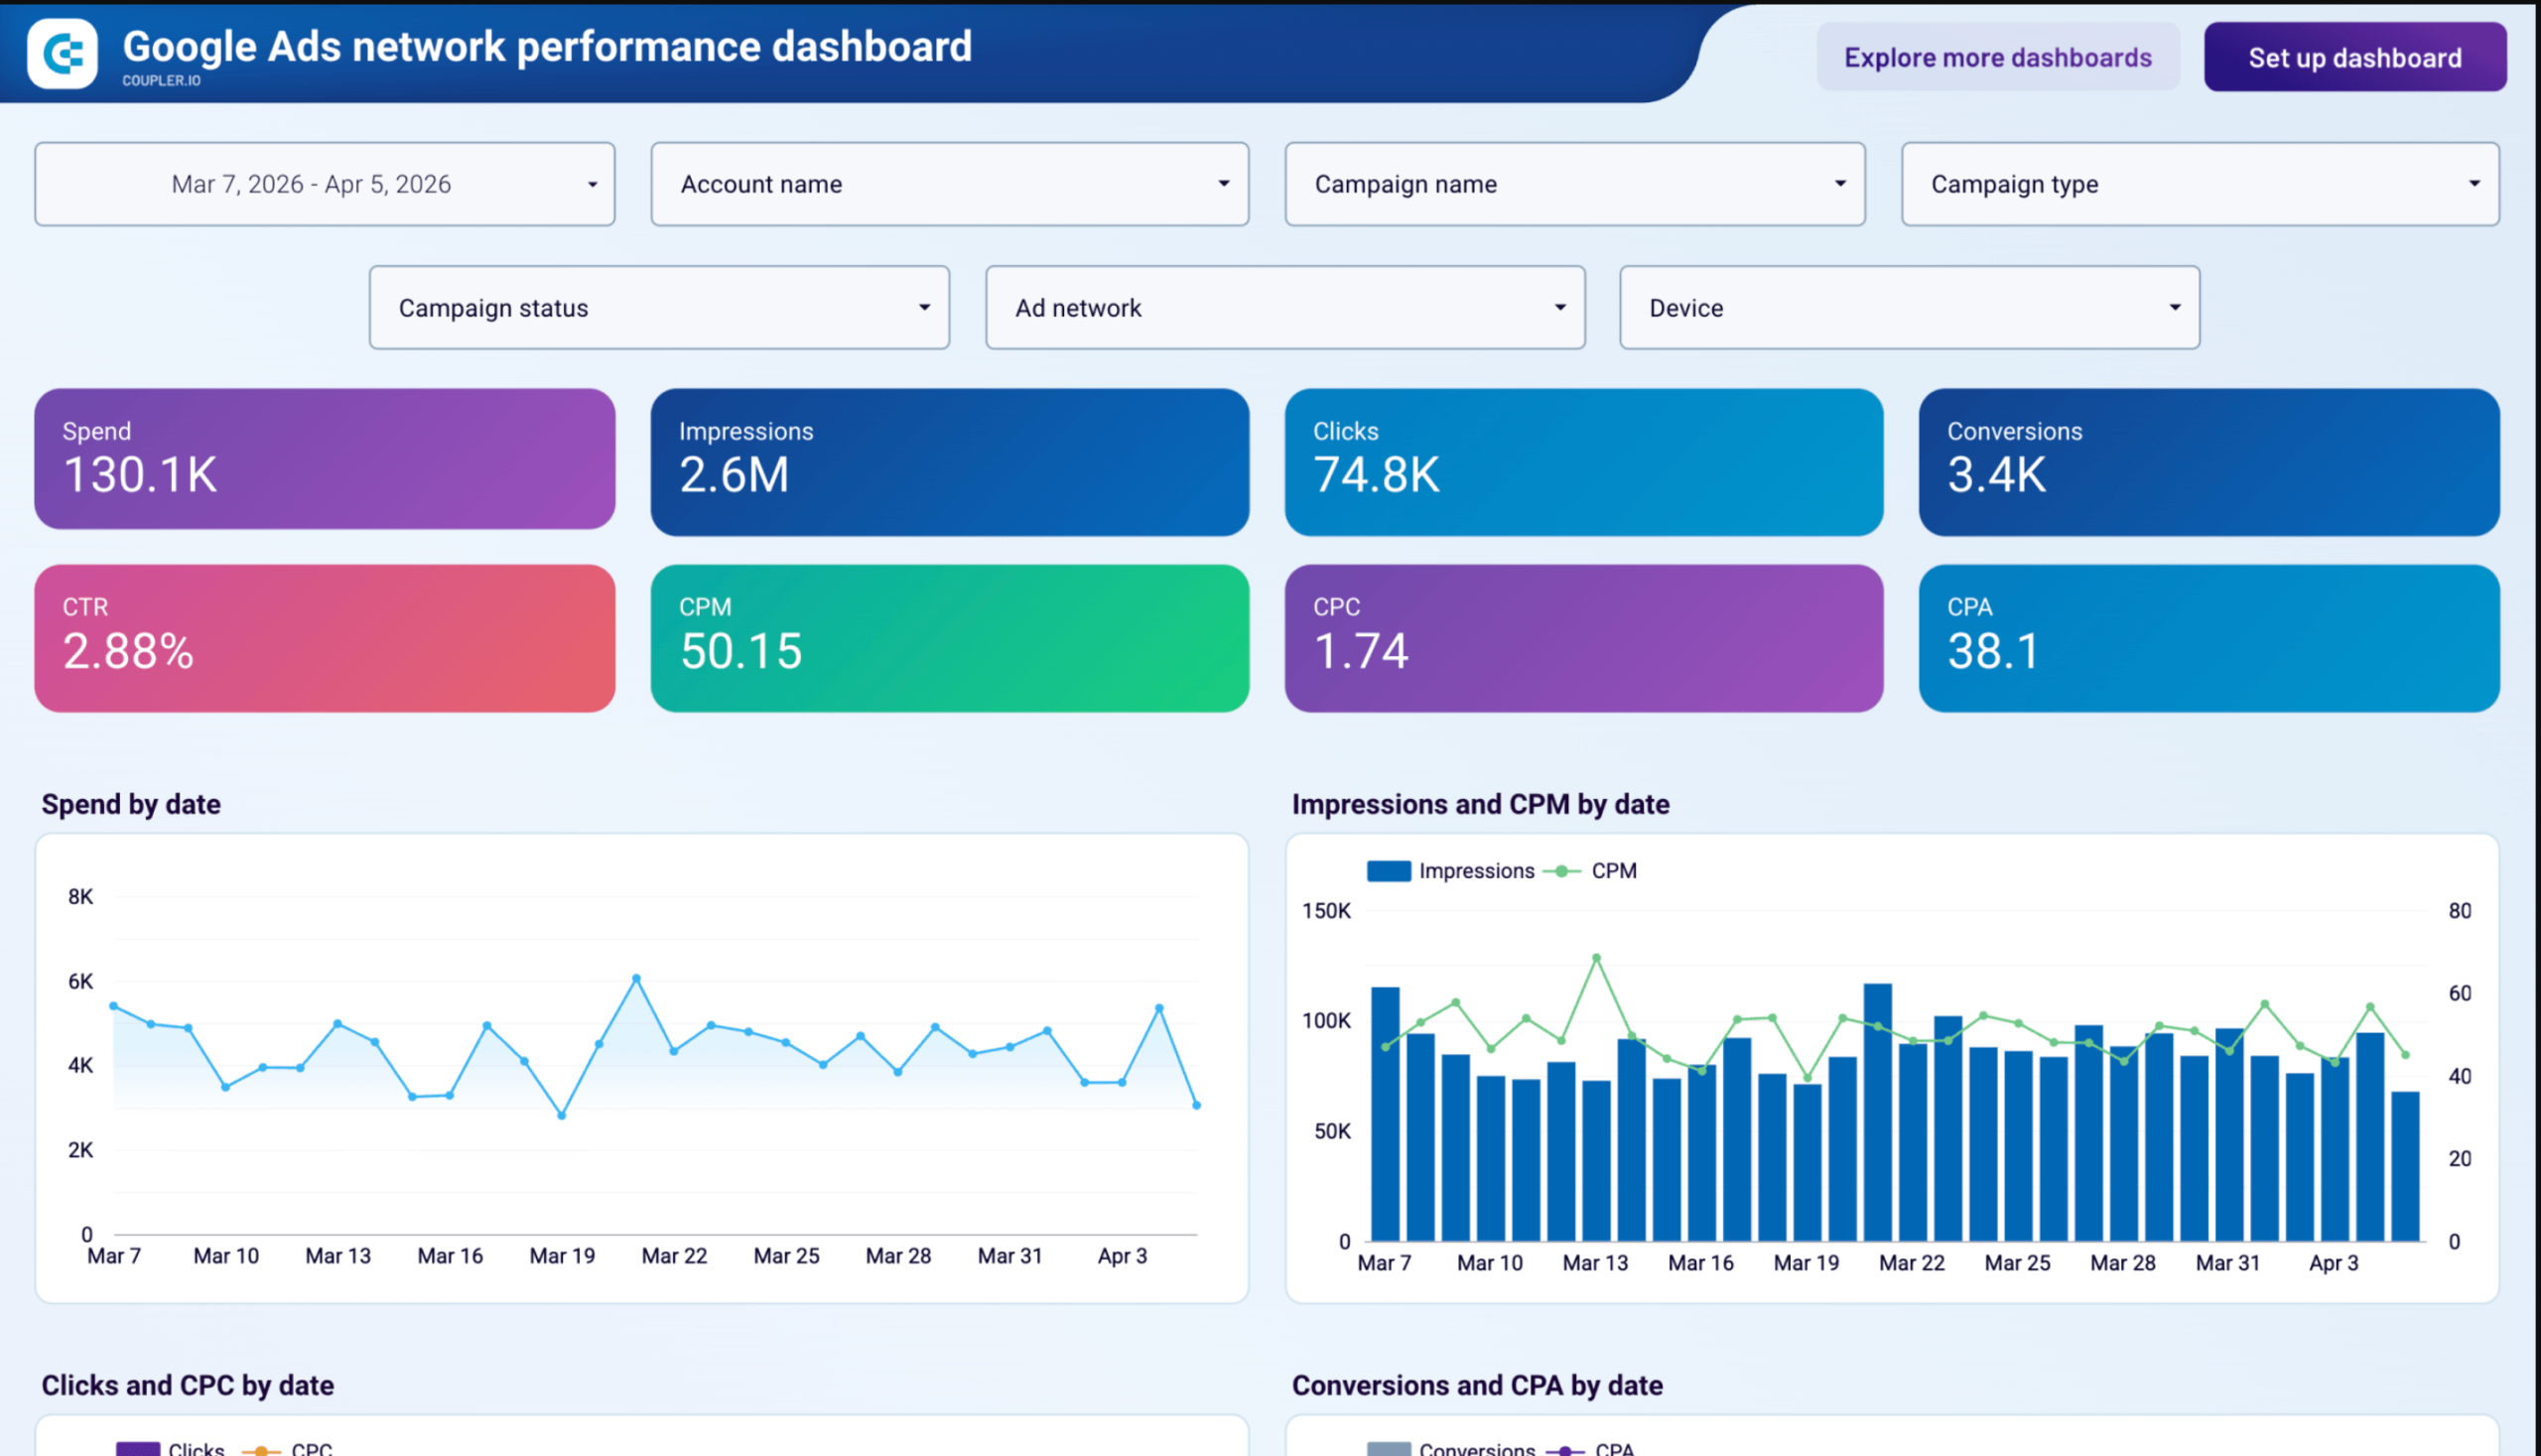
Google Ads network performance dashboard
Using this dashboard template is straightforward: you only need to connect your Google Ads account to Coupler.io. The dashboard tracks the eight core PPC metrics (spend, impressions, clicks, conversions, CTR, CPM, CPC, and CPA) and breaks each down by ad network (Search, Content, YouTube Watch, YouTube Search, Search Partners), device, and geography. The dashboard also covers impression share, video creative completion rates, and Performance Max asset quality ratings across five pages. Once this is done, you will get your ad performance analytics in Data Studio.
Google Ads network performance dashboard
 Preview dashboard
Google Ads network performance dashboard
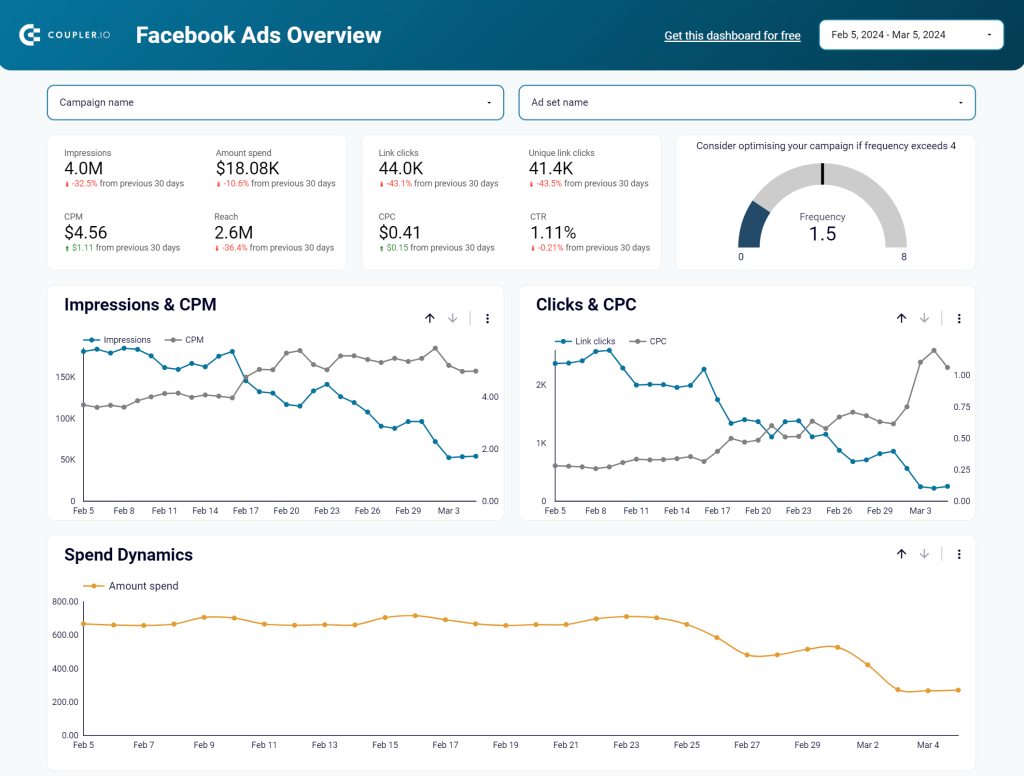
Preview dashboardFacebook Ads PPC dashboard template
Just like in our previous example, this live PPC dashboard is built with the help of Coupler.io and is available for free. Connect your Facebook Ads account to load your advertising performance data to the dashboard in either Power BI or Looker Studio.
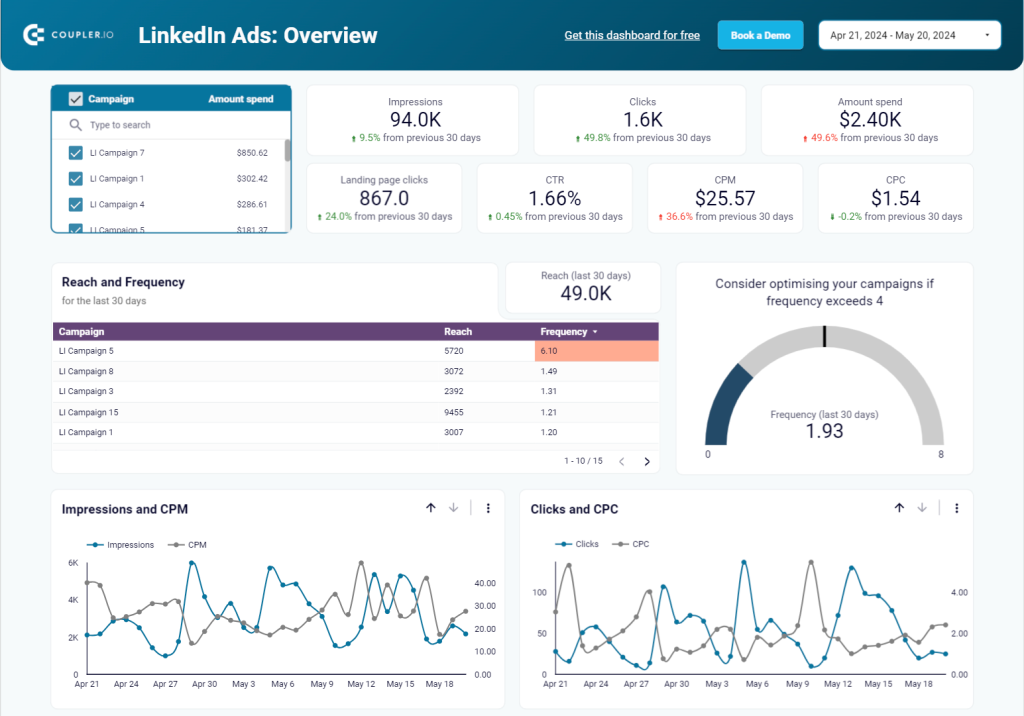
LinkedIn Ads PPC dashboard template
This automated dashboard allows you to monitor key metrics and gain valuable insights from your data. With this pre-built template, your LinkedIn Ads dashboard will be ready in minutes. It’s a valuable tool both for day-to-day monitoring and for scheduled PPC audits.
Keeping track of PPC campaign metrics
Even the most engaging ad campaigns need optimization from time to time. You should continuously monitor these crucial PPC metrics to ensure that your ads are performing the best they can. Impressions, CPC, CPM, conversions, and other PPC KPIs will show you how effectively your digital marketing efforts are paying off.
For more on this topic, see our other PPC guides:
If you want to always have an overview of your ad campaign performance, we recommend using Coupler.io’s free PPC dashboard. It allows you to connect all ad channels, and it updates automatically, which means you can spend less time creating reports and more time optimizing your ads.
Don’t forget to check out the top 10 PPC trends for 2025 so you can stay up-to-date with the latest industry changes.

Automate data export with Coupler.io
Get started for free