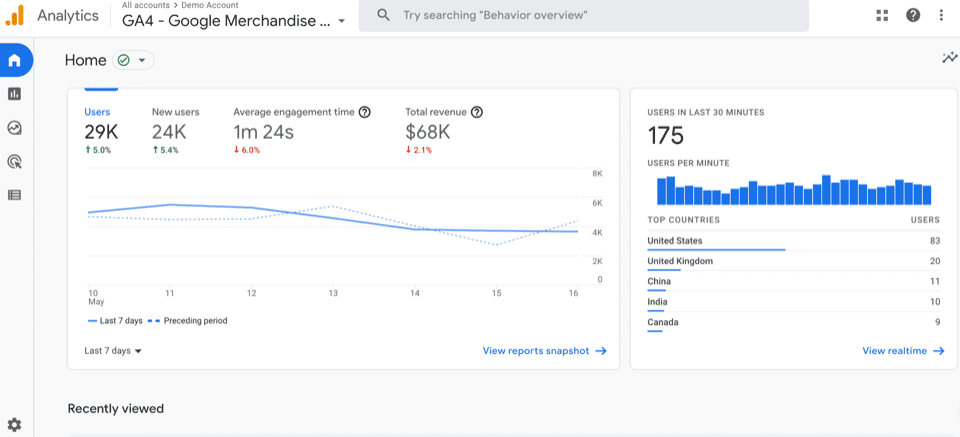
Your Google Analytics 4 dashboard shows 500+ daily users with 2.3 pages per session, but your Shopify conversion rate remains stubbornly at 0.8%. You’re not alone: many store owners experience the same issues – their GA4 traffic metrics look promising, but Shopify sales remain at zero. This article reveals the reasons why your traffic isn’t translating into sales. It also shows how to diagnose and fix problems in your conversion funnel.
How to see Shopify store sales and understand your traffic vs. sales gap
The buyer journey is the backbone of any marketing strategy. It begins once a person recognizes a need (1), followed by the exploration of options that satisfy it (2), and ends once a purchase is made (3).
The second phase of exploration is closely tied to internet surfing and e-commerce website traffic (tracked in GA4), while the third stage, purchase, is directly correlated with conversion (tracked in Shopify).
Understanding the data disconnect: GA4 vs. Shopify analytics
Your e-commerce success depends on insights from both platforms, but they serve different purposes:
GA4 shows you:
- Where your traffic comes from (organic search, social media, paid ads)
- How users behave on your site (bounce rates, session duration, page views)
- Audience demographics and interests
- Device and location data
Shopify Analytics shows you:
- Actual sales and revenue data
- Conversion rates and order values
- Cart abandonment rates
- Customer purchase patterns
To understand why your Shopify store not getting sales, it’s necessary to explore KPIs related to both traffic and conversion. They are interdependent, as conversion rates can tell much about the quality of traffic shown in GA4. At the same time, high GA4 traffic metrics don’t guarantee high Shopify conversion rates.
| Traffic (GA4) | Conversion (Shopify) |
| Sessions – the number of user interaction units, each of which comprises a set of actions on the website. Views – the total number of times the pages of your website were loaded. Total users – the number of users who have visited your website during a specific period of time. New users – the number of new visitors for a definite period of time. Time on site – the average amount of time a user spends on a website. | Conversion rate – the ratio between users who have completed a desired action compared to the total number of visitors. Bounce rate – the percentage of visitors who leave a website after viewing only one page. Cart abandonment rate – it shows the correlation between all initiated carts and the number of users who added at least one item to a cart but didn’t proceed to a purchase. Cost per acquisition (CPA) – the average cost to acquire a new customer. Average order value (AOV) –the average sum of money a customer spends per order. |
Shopify traffic tracking
To get data on your e-commerce website traffic, you need to connect your Shopify account to GA4. Please refer to the detailed Shopify guide explaining how to do that. Once completed, GA4 will track user behavior, traffic sources, and engagement metrics, while Shopify focuses on sales and conversion data.

Shopify sales tracking
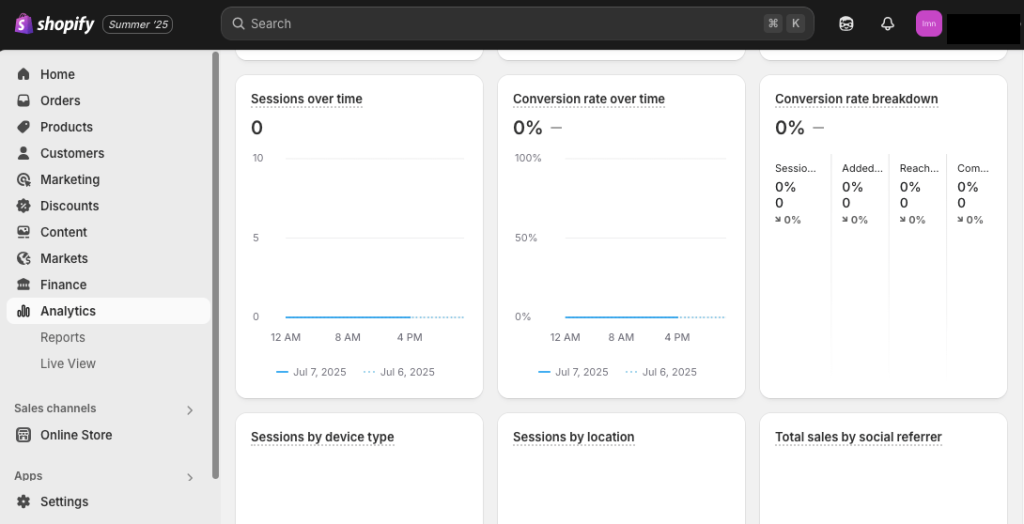
Go to the Analytics tab from your Shopify admin account to see how many sales a Shopify store has. On this sales reporting dashboard, you will find information on sales and conversion of your e-commerce store.
Note: Shopify counts conversion as the proportion of sessions that resulted in a purchase to the overall number of sessions.

But how do you know whether your conversion rate is good? According to Shopify, the average conversion rate in the e-commerce industry is 2.5%. For B2B sales targeting, this number might be even lower. If you got 50 sessions and two purchases, for instance, your conversion rate would be 4%. This number is above the industry average. Even though there are few sales, the conversion rate is rather promising.
Bridging the GA4-Shopify analytics gap
The challenge? GA4 and Shopify analytics live in separate dashboards. You’ll need to switch between platforms to monitor all metrics, making it difficult to see the complete picture of why your GA4 traffic isn’t converting in Shopify.
Key metrics to monitor across both platforms:
- Sessions (GA4) vs. Conversion rate (Shopify)
- Bounce rate (GA4) vs. Add to cart rate (Shopify)
- Traffic sources (GA4) vs. Sales by source (Shopify)
- Device usage (GA4) vs. Mobile conversion rates (Shopify)
- User engagement (GA4) vs. Cart abandonment (Shopify)
Some of these KPIs are available on Shopify’s Analytics dashboard, while others are displayed on the GA4 dashboard. That way, you will need to switch between these two platforms to monitor all metrics. This isn’t likely to supply you with a holistic vision of how things are going on your Shopify store and why there are no sales.
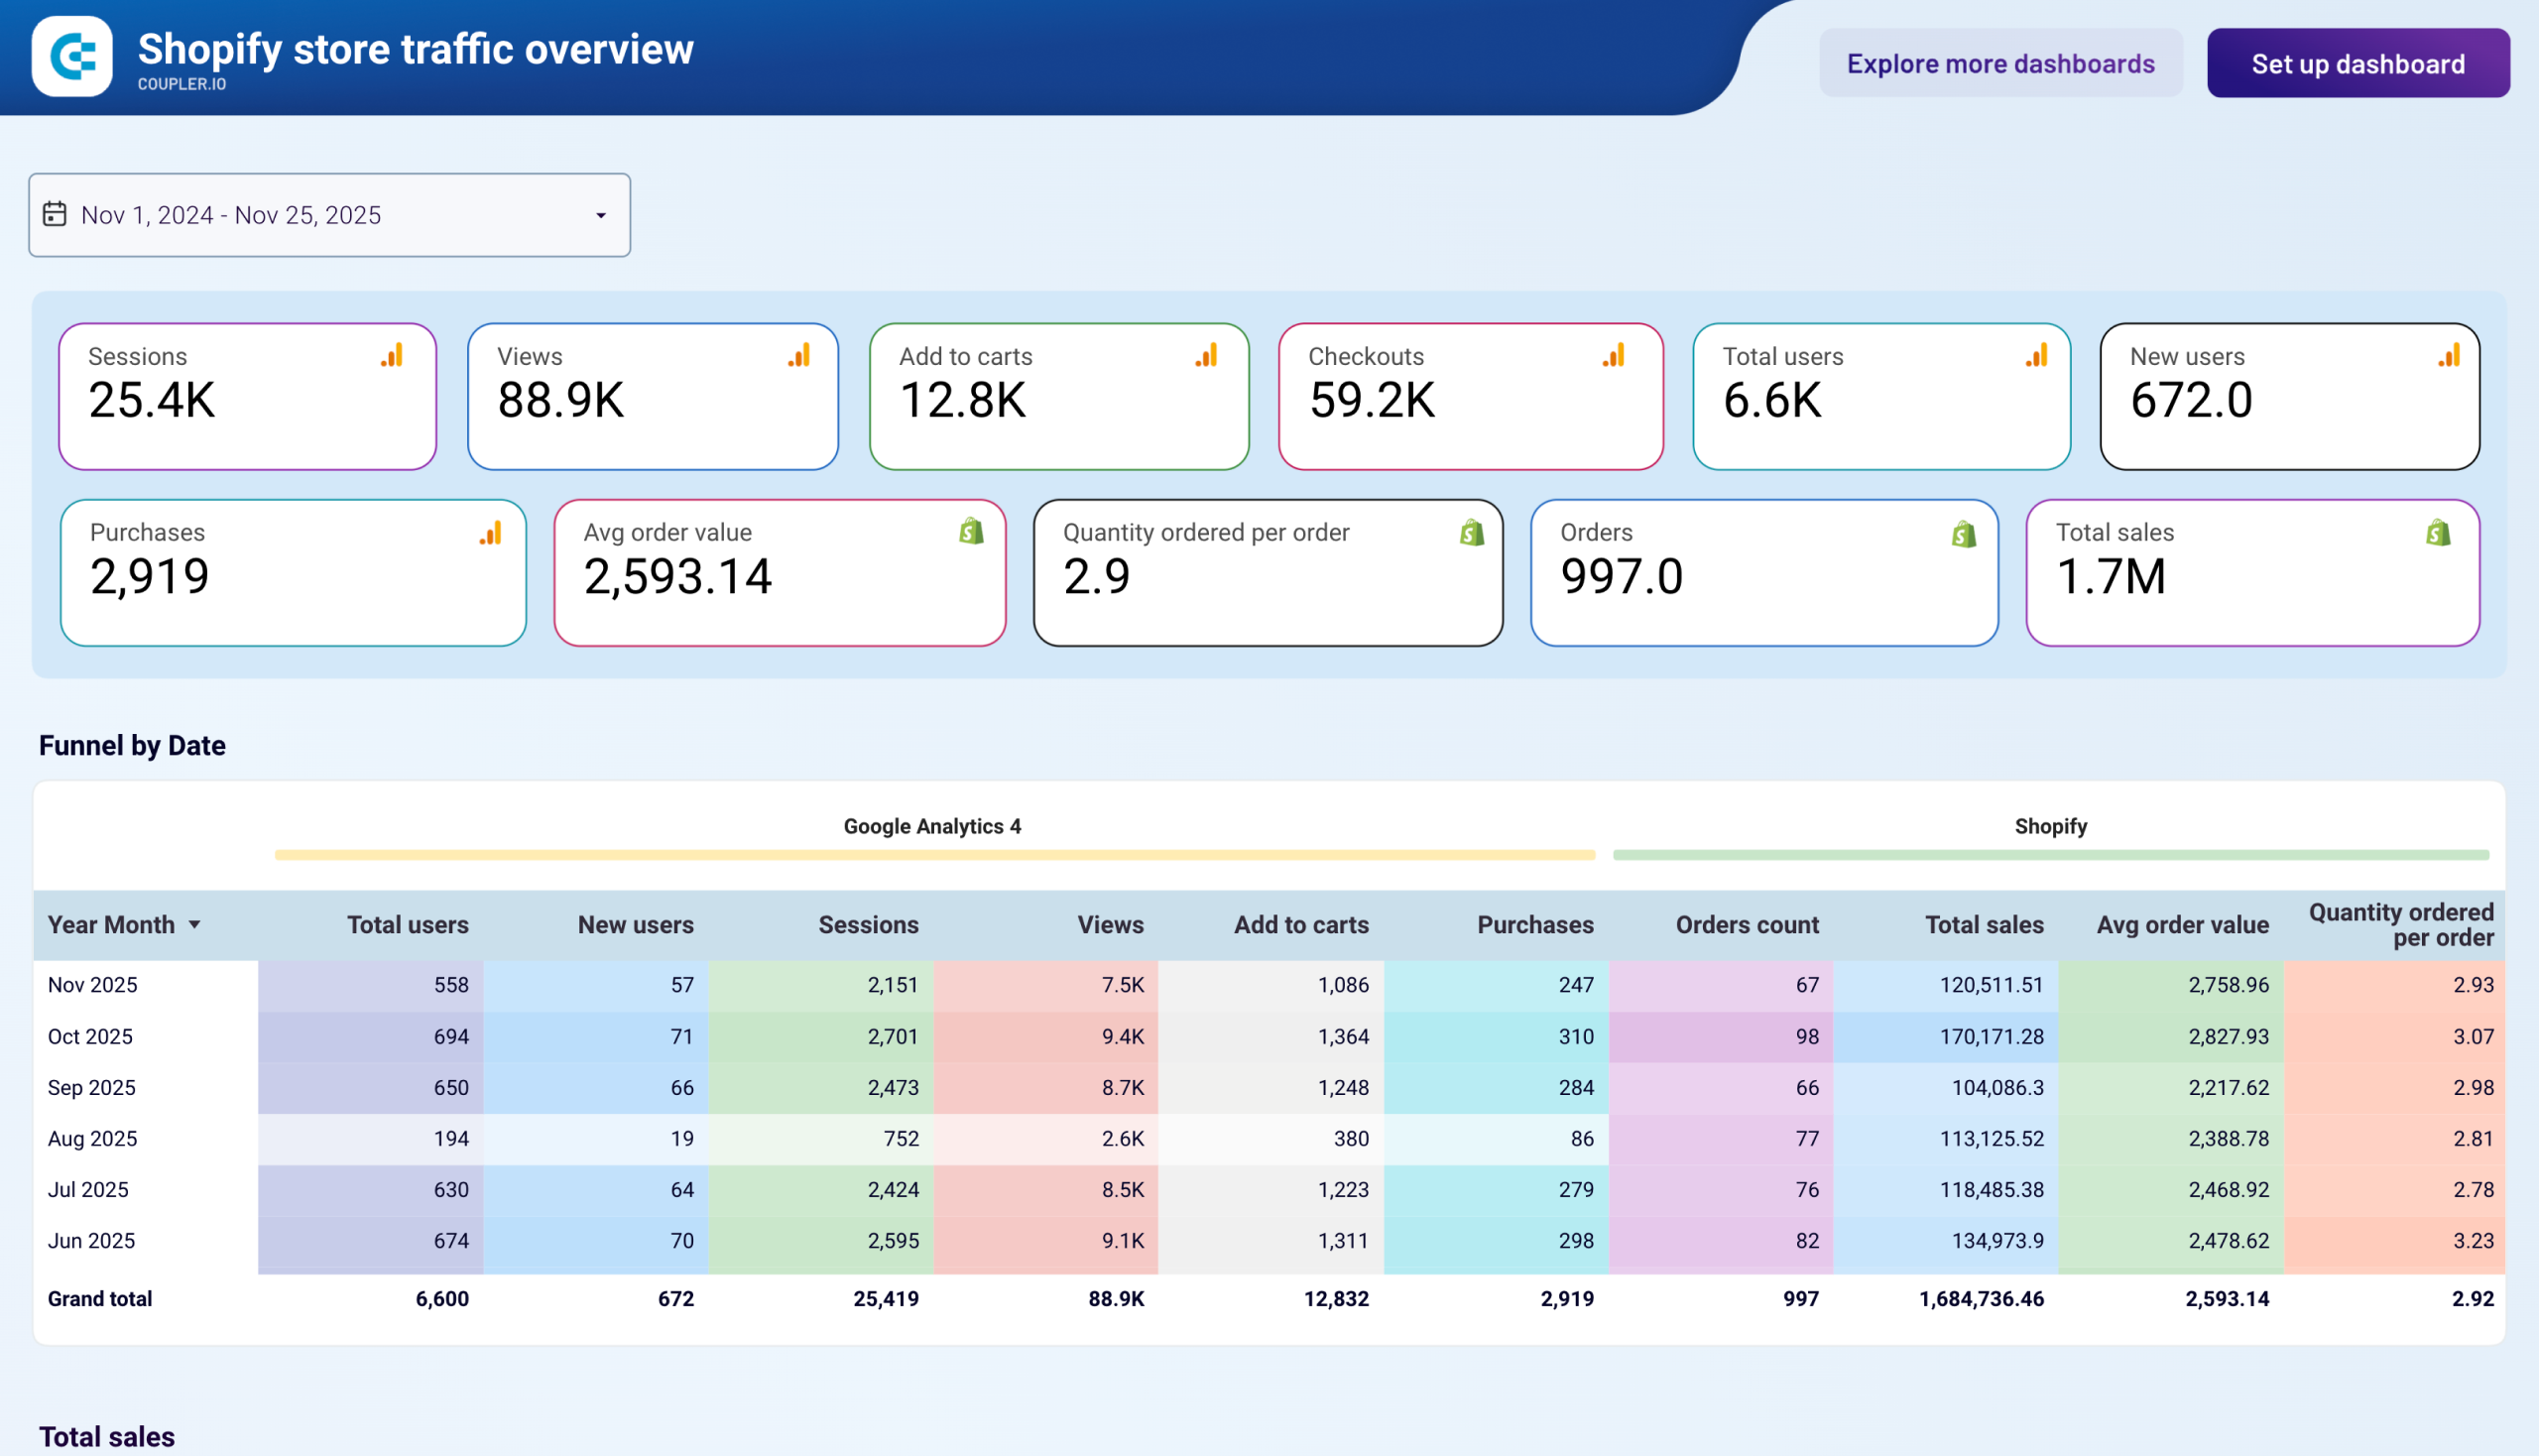
The Shopify store traffic overview dashboard by Coupler.io addresses this analytics gap by combining both GA4 and Shopify metrics in one workspace. Instead of switching between platforms, you get historical and real-time data with interactive visuals showing exactly why there’s high traffic but no sales.
Important: The dashboard requires GA4 to be connected to your Shopify store to work properly.
Quick diagnostic using this dashboard:
- Calculate the add-to-cart rate by dividing the add-to-cart number by Sessions. The average add-to-cart rate on Shopify is 4.6%. If this number is lower for you, it might be necessary to update the product description, improve the website design, update a CTA (call-to-action), and take other actions that would encourage potential customers to add items to the cart.


- Use data from the same table to calculate the cart abandonment rate using the formula:
(1 - (Total purchases / Total add to carts))*100%
This KPI is crucial in understanding why there is Shopify traffic but no sales. According to Shopify, the acceptable cart abandonment rate is around 70%. If this number is higher, it may indicate that there are hidden costs at checkout (high taxes, unexpected shipping fees), a lack of transparency, no items in stock, and so on.
The dashboard template is designed in Coupler.io and available for Google Sheets, Power BI, and Looker Studio. It is equipped with the Coupler.io connector that automates data load from GA4 and Shopify. Choose the version you prefer to get started in minutes.

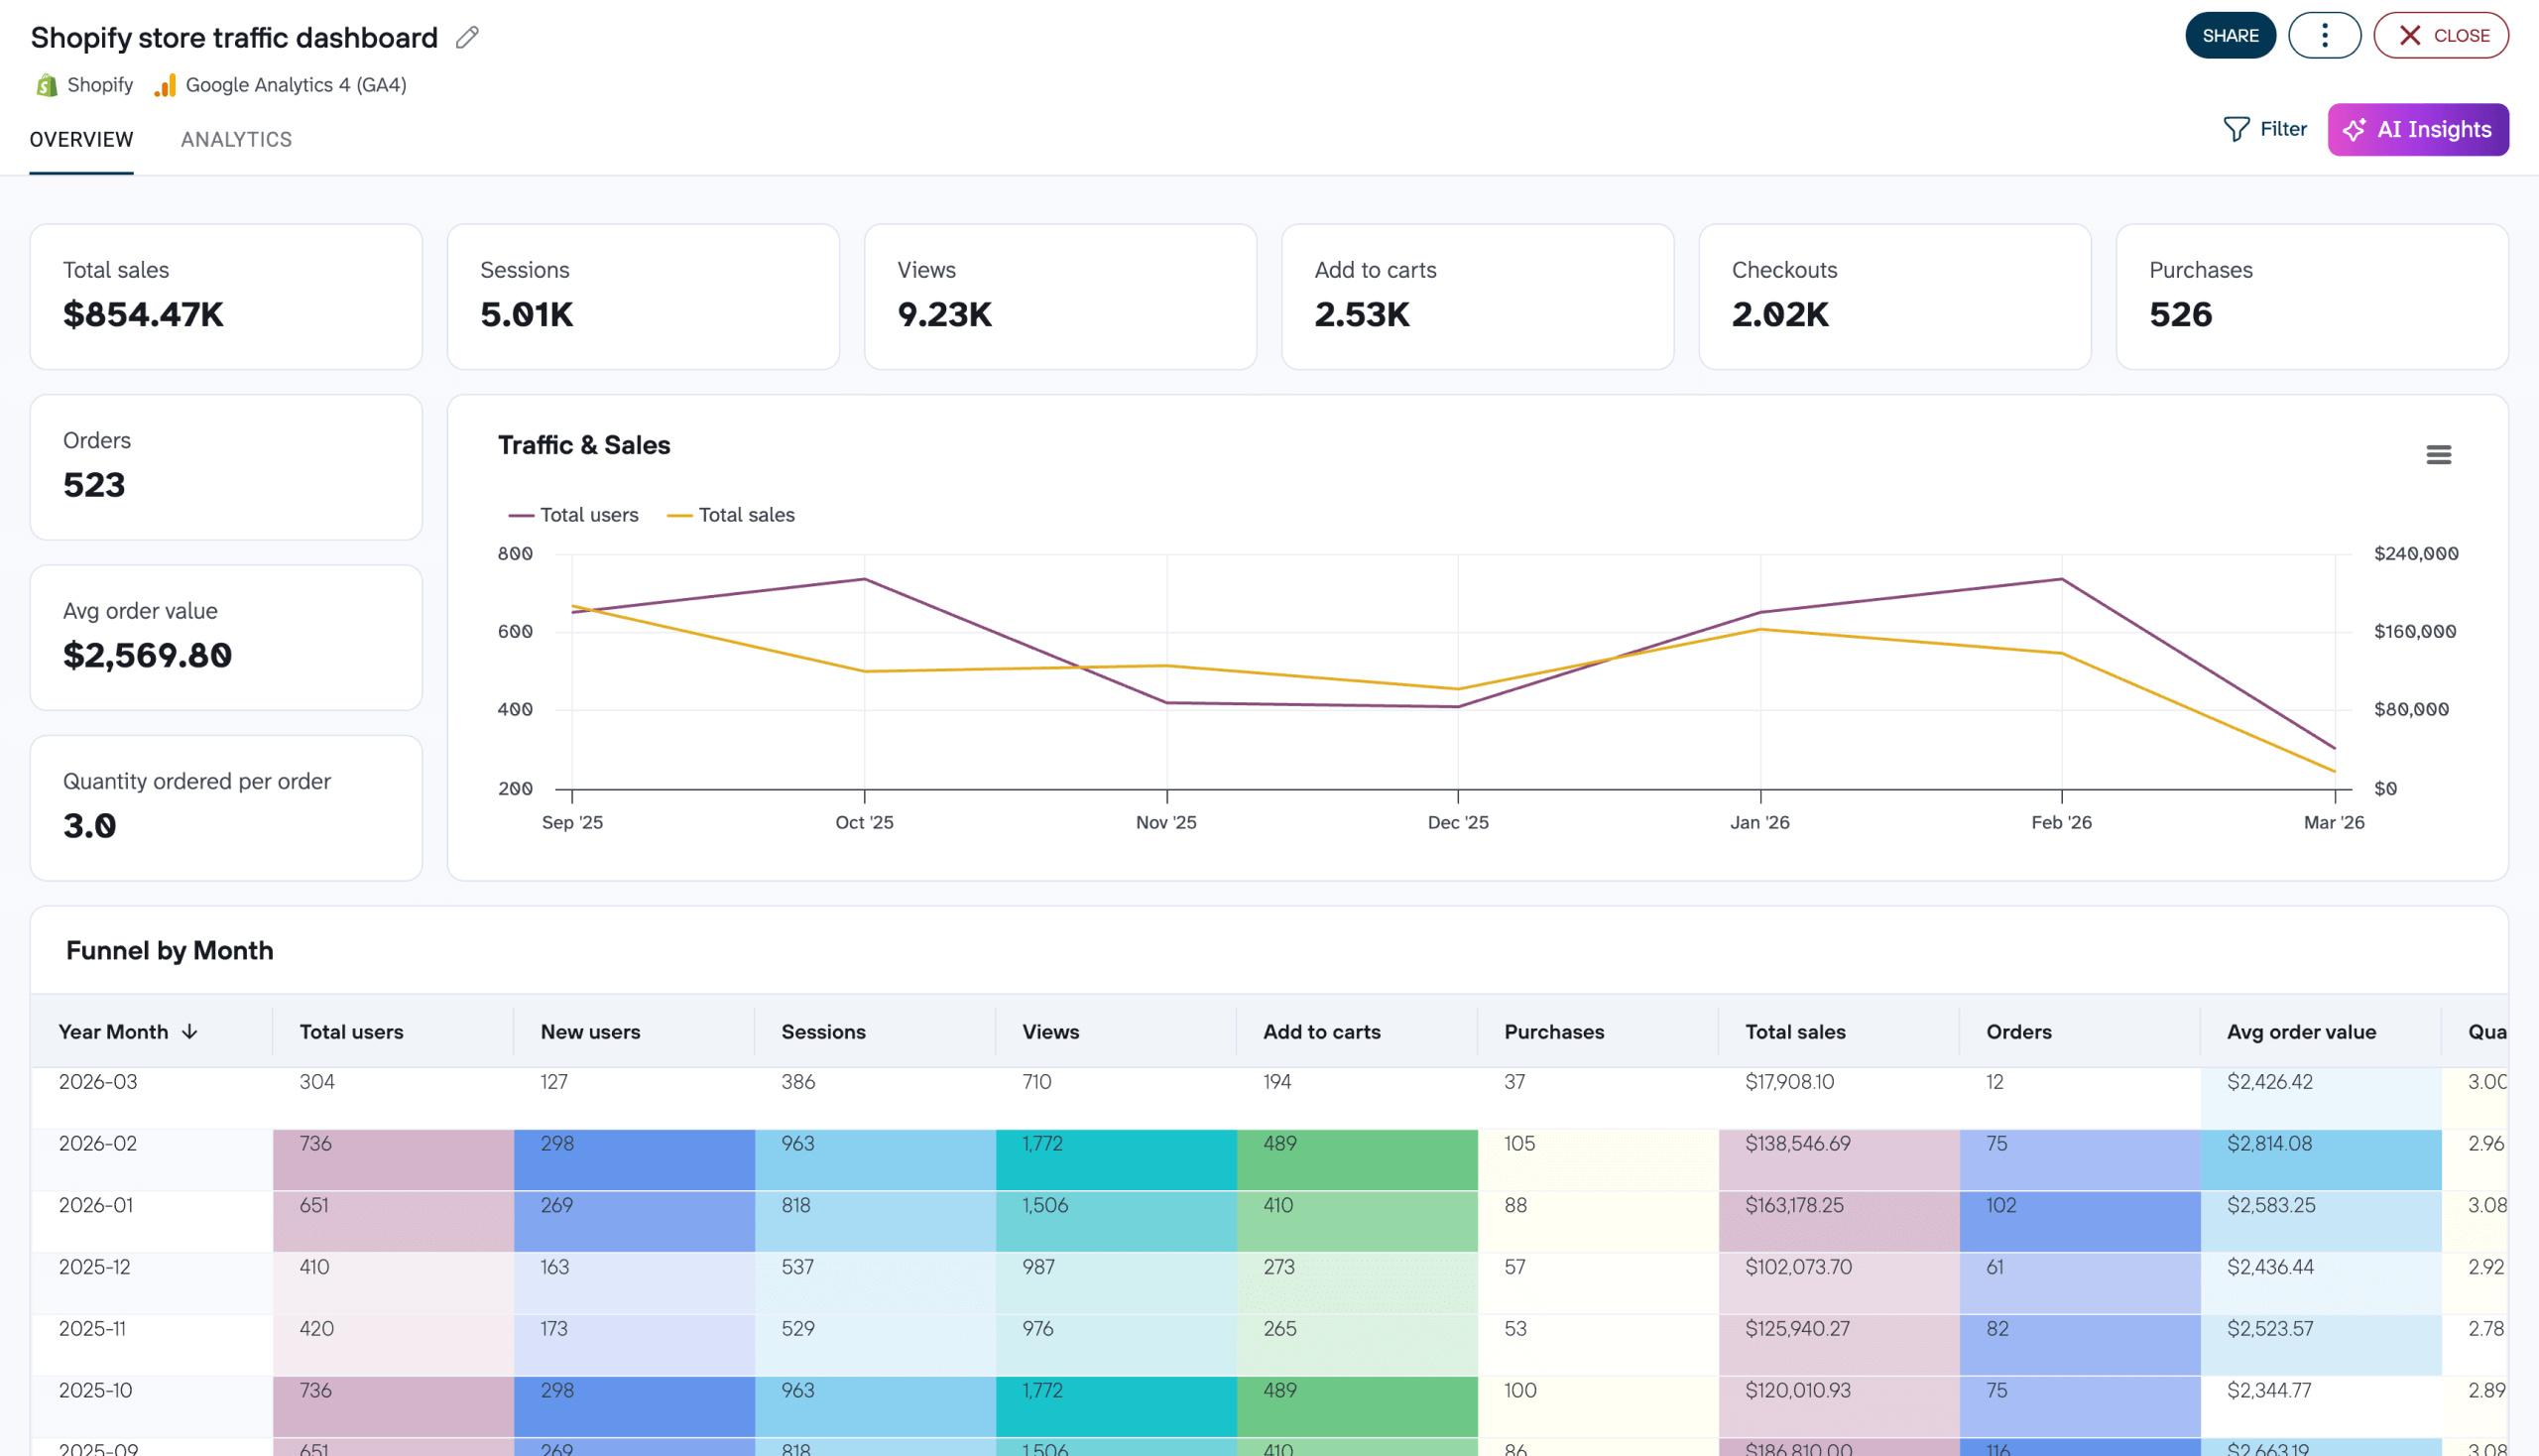
Shopify store traffic dashboard in Coupler.io
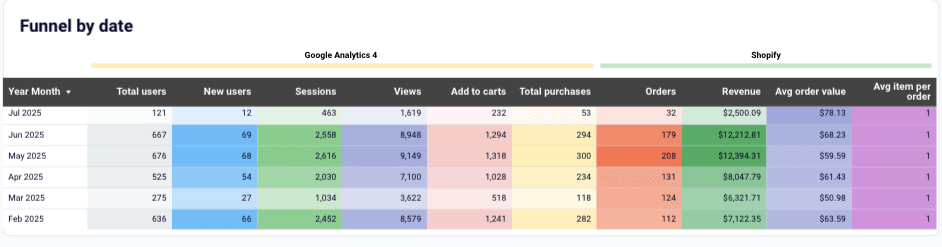
Connect Shopify and Google Analytics 4 to track your store’s full traffic-to-purchase funnel. Analyze visitor trends, conversion rates, top-selling products, geographic performance, and traffic sources to understand what drives sales and where drop-offs occur.


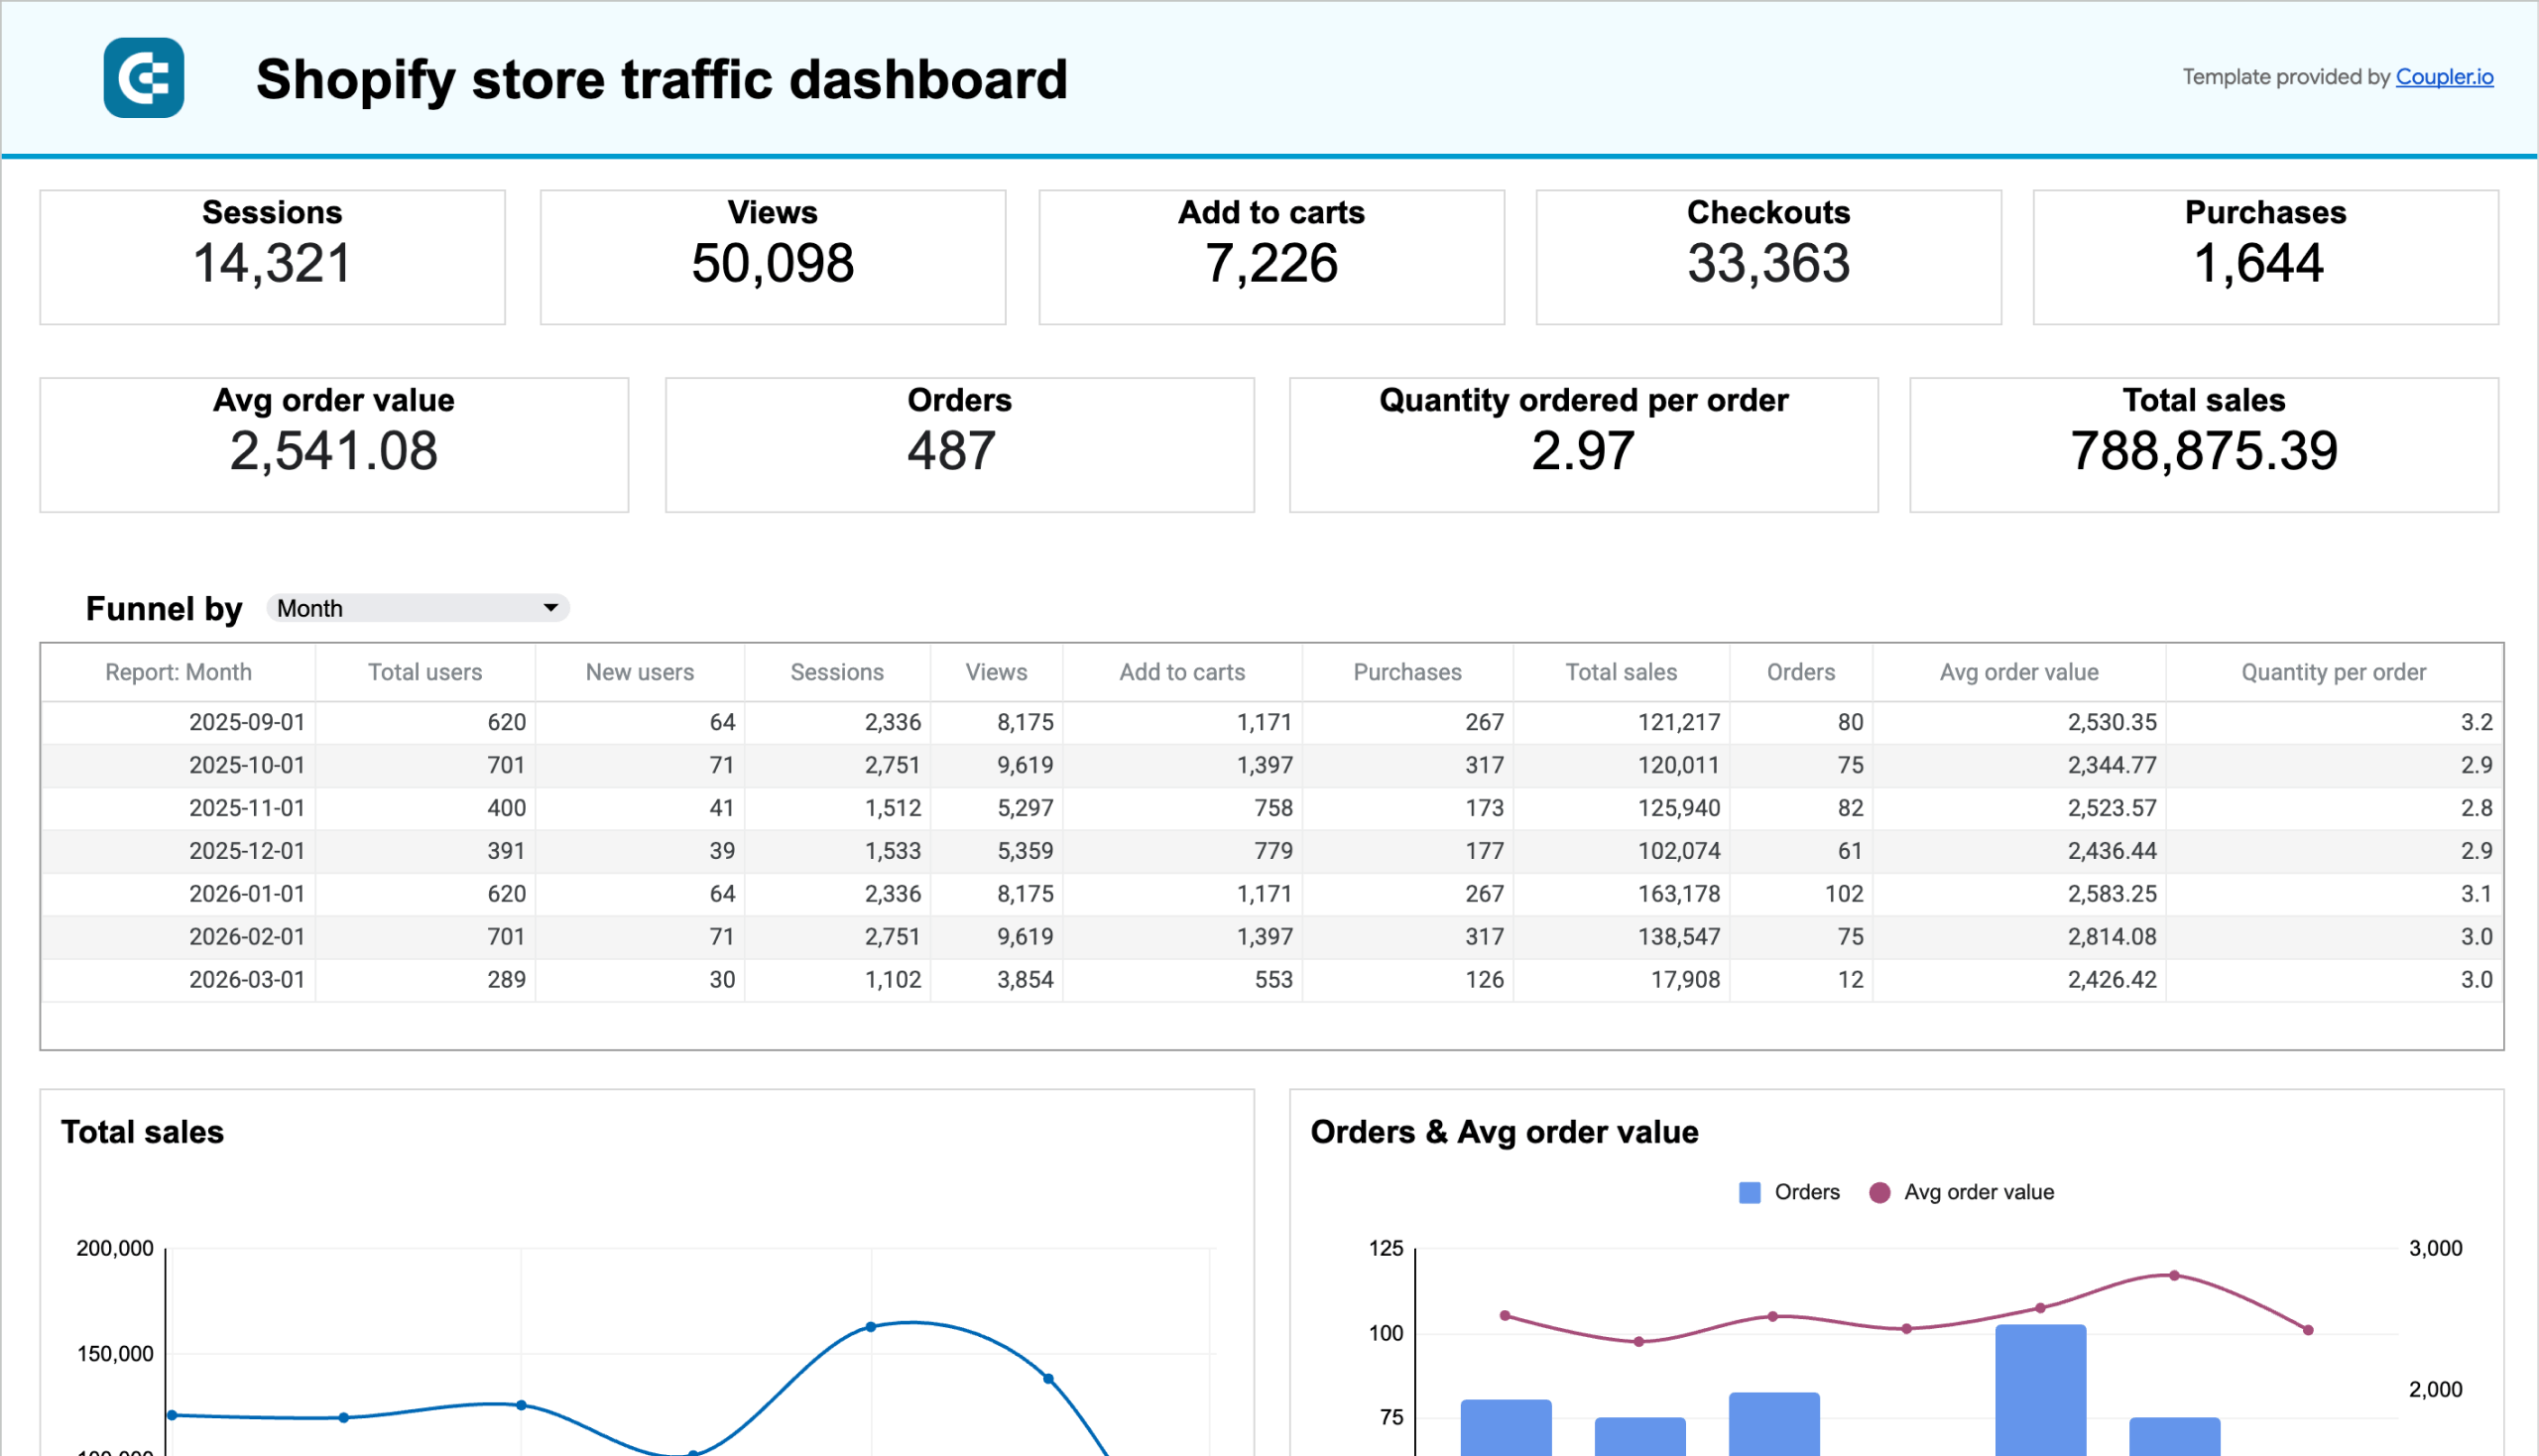
Shopify store traffic dashboard in Power BI
Analyze traffic and purchasing metrics for your Shopify store with this dashboard that consolidates performance data from Google Analytics 4 and Shopify.
Shopify store traffic dashboard in Looker Studio
Track your Shopify store’s customer journey from visit to purchase with this dashboard that combines data from Google Analytics 4 and Shopify.
Shopify store traffic dashboard in Google Sheets
Combine Shopify order data with Google Analytics 4 traffic insights to measure your store’s performance end-to-end. Track visitor acquisition, purchase trends, average order value, top products, supplier performance, and geographic sales distribution month over month.
“Why am I not getting sales on Shopify?” – The conversion funnel breakdown
Let’s dive deeper into the no-sales problem and uncover specific conversion barriers on your Shopify e-store.
Shopify traffic but no sales: Getting the wrong visitors
If your GA4 Traffic Acquisition report shows social media driving 60% of sessions but Shopify reveals these visitors have a 0.2% conversion rate, you’re attracting browsers, not buyers. This disconnect between GA4 engagement metrics and Shopify sales data indicates keyword and targeting issues.
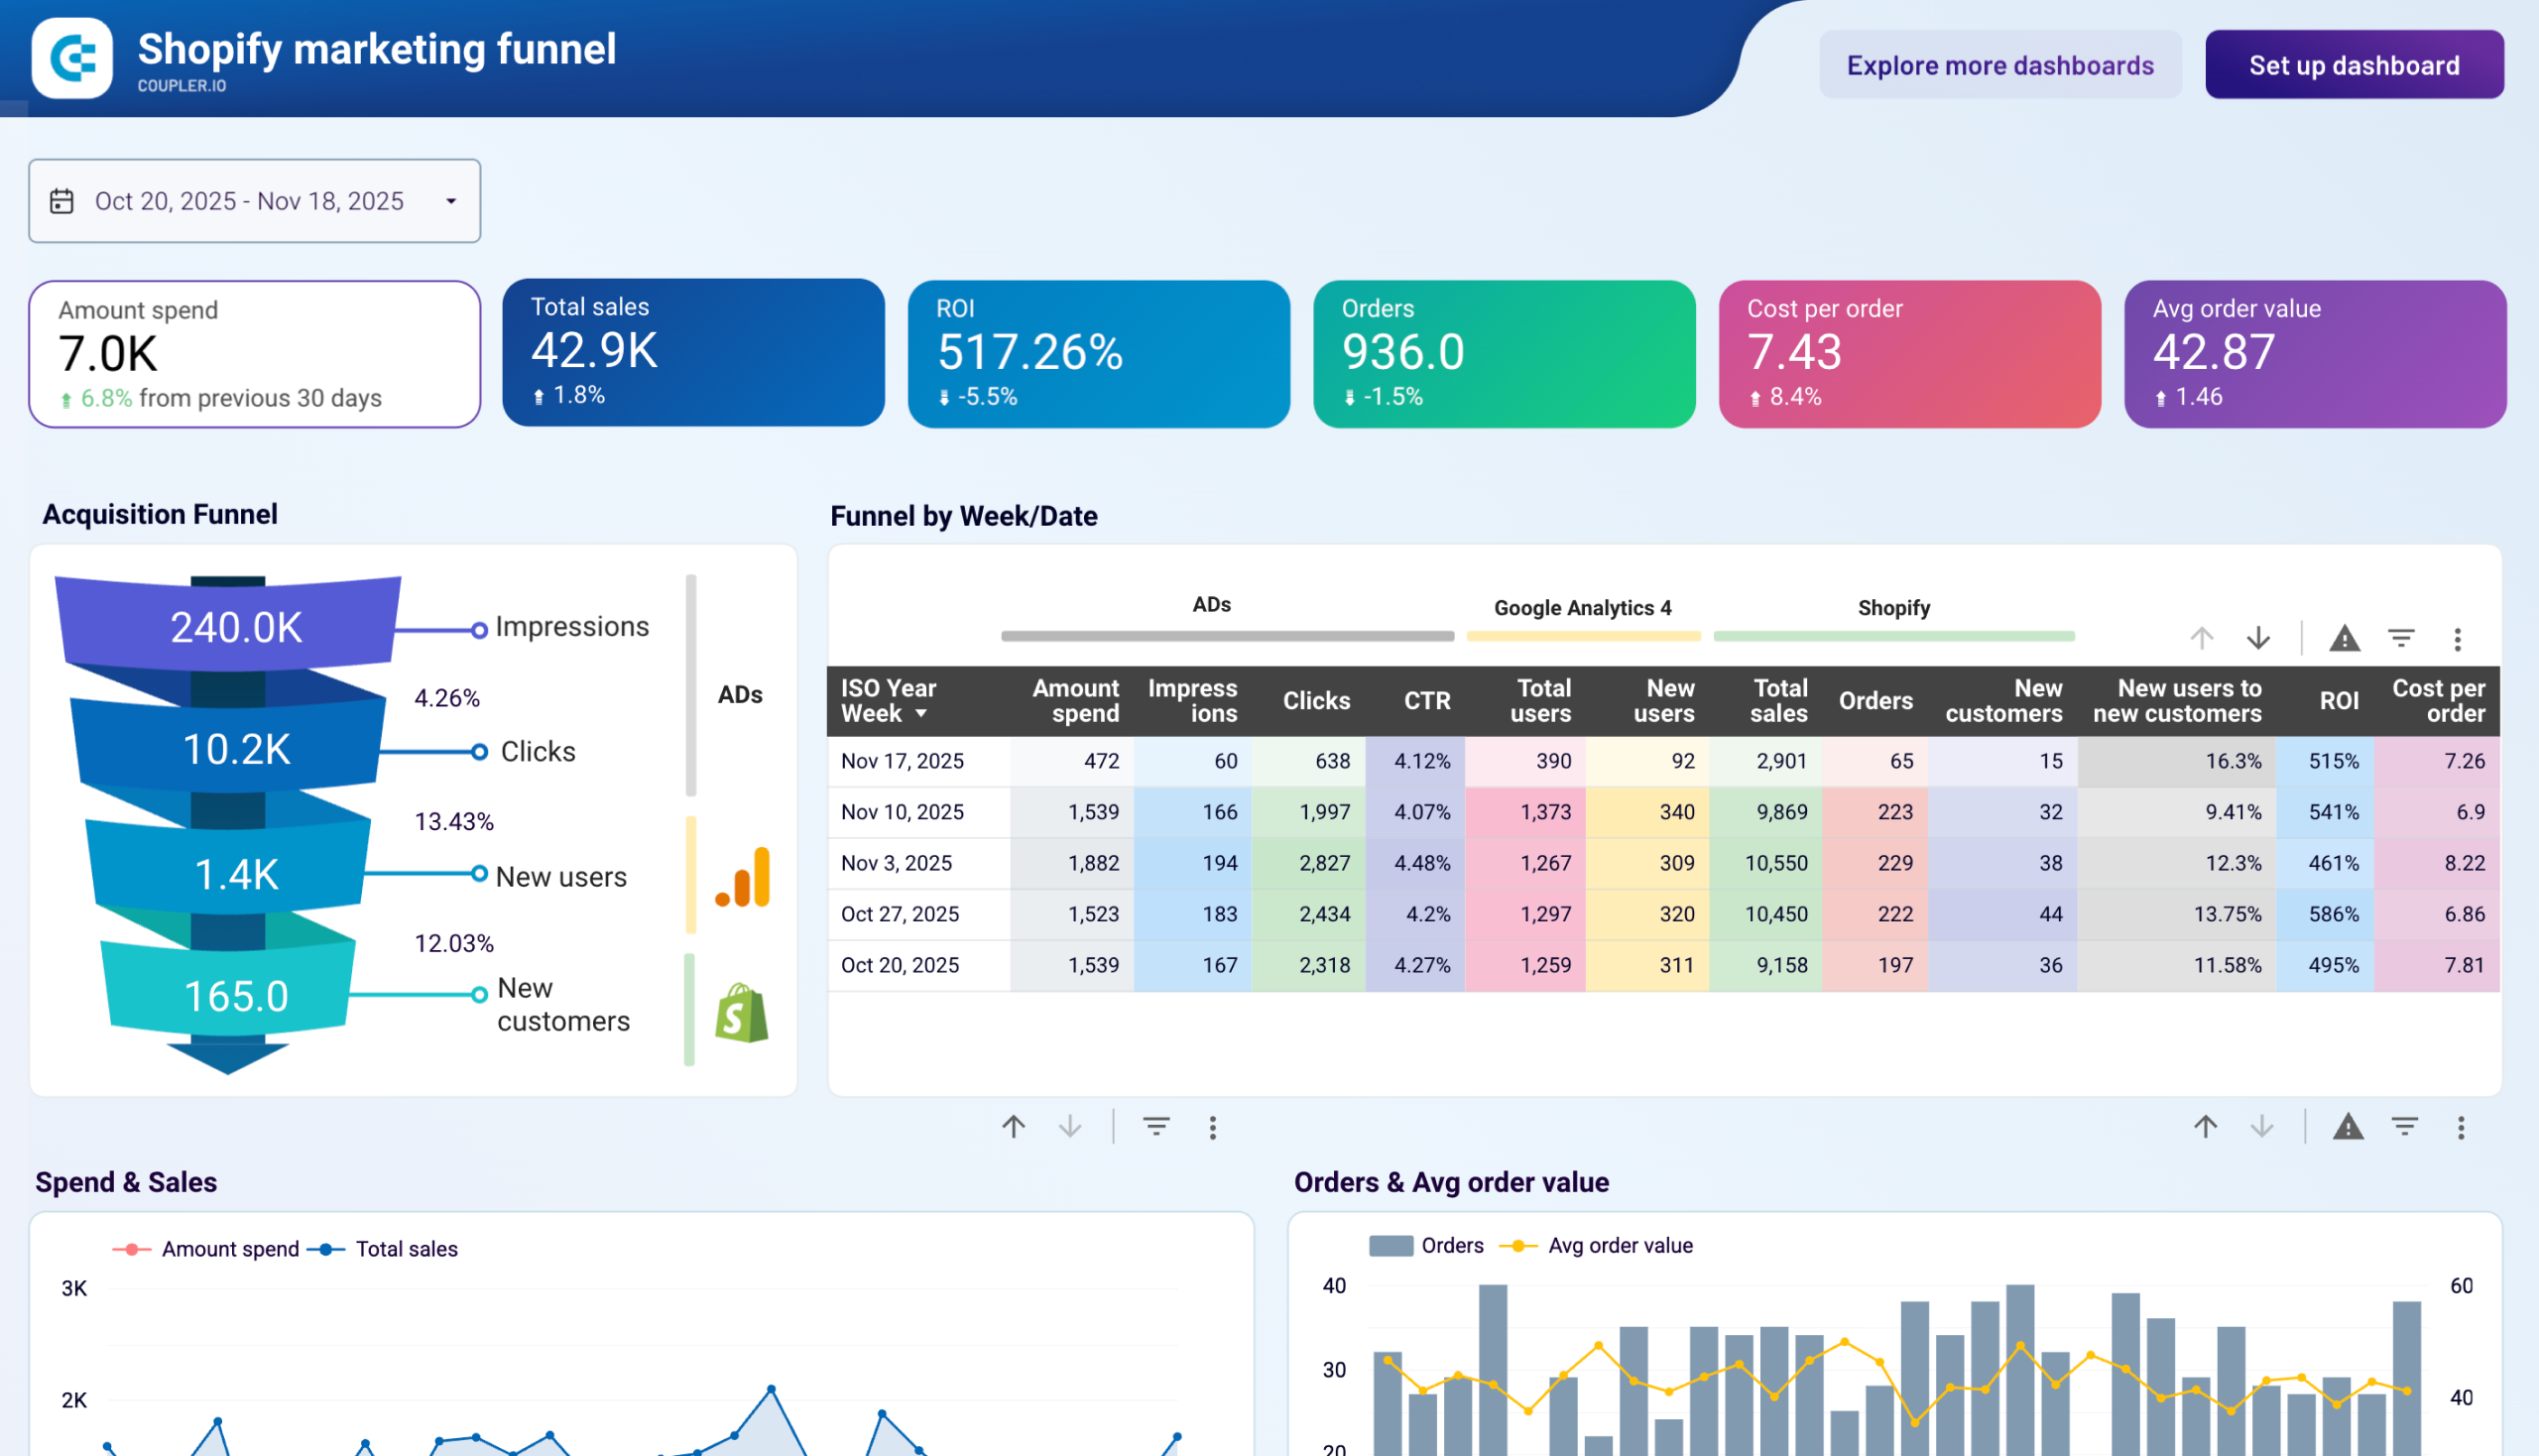
The Shopify marketing funnel analytics dashboard helps diagnose this problem by showing conversion rates by traffic source. It combines data from multiple ad platforms (TikTok Ads, Bing Ads, Google Ads, etc.) along with that from Shopify and GA4.
Shopify marketing funnel dashboard
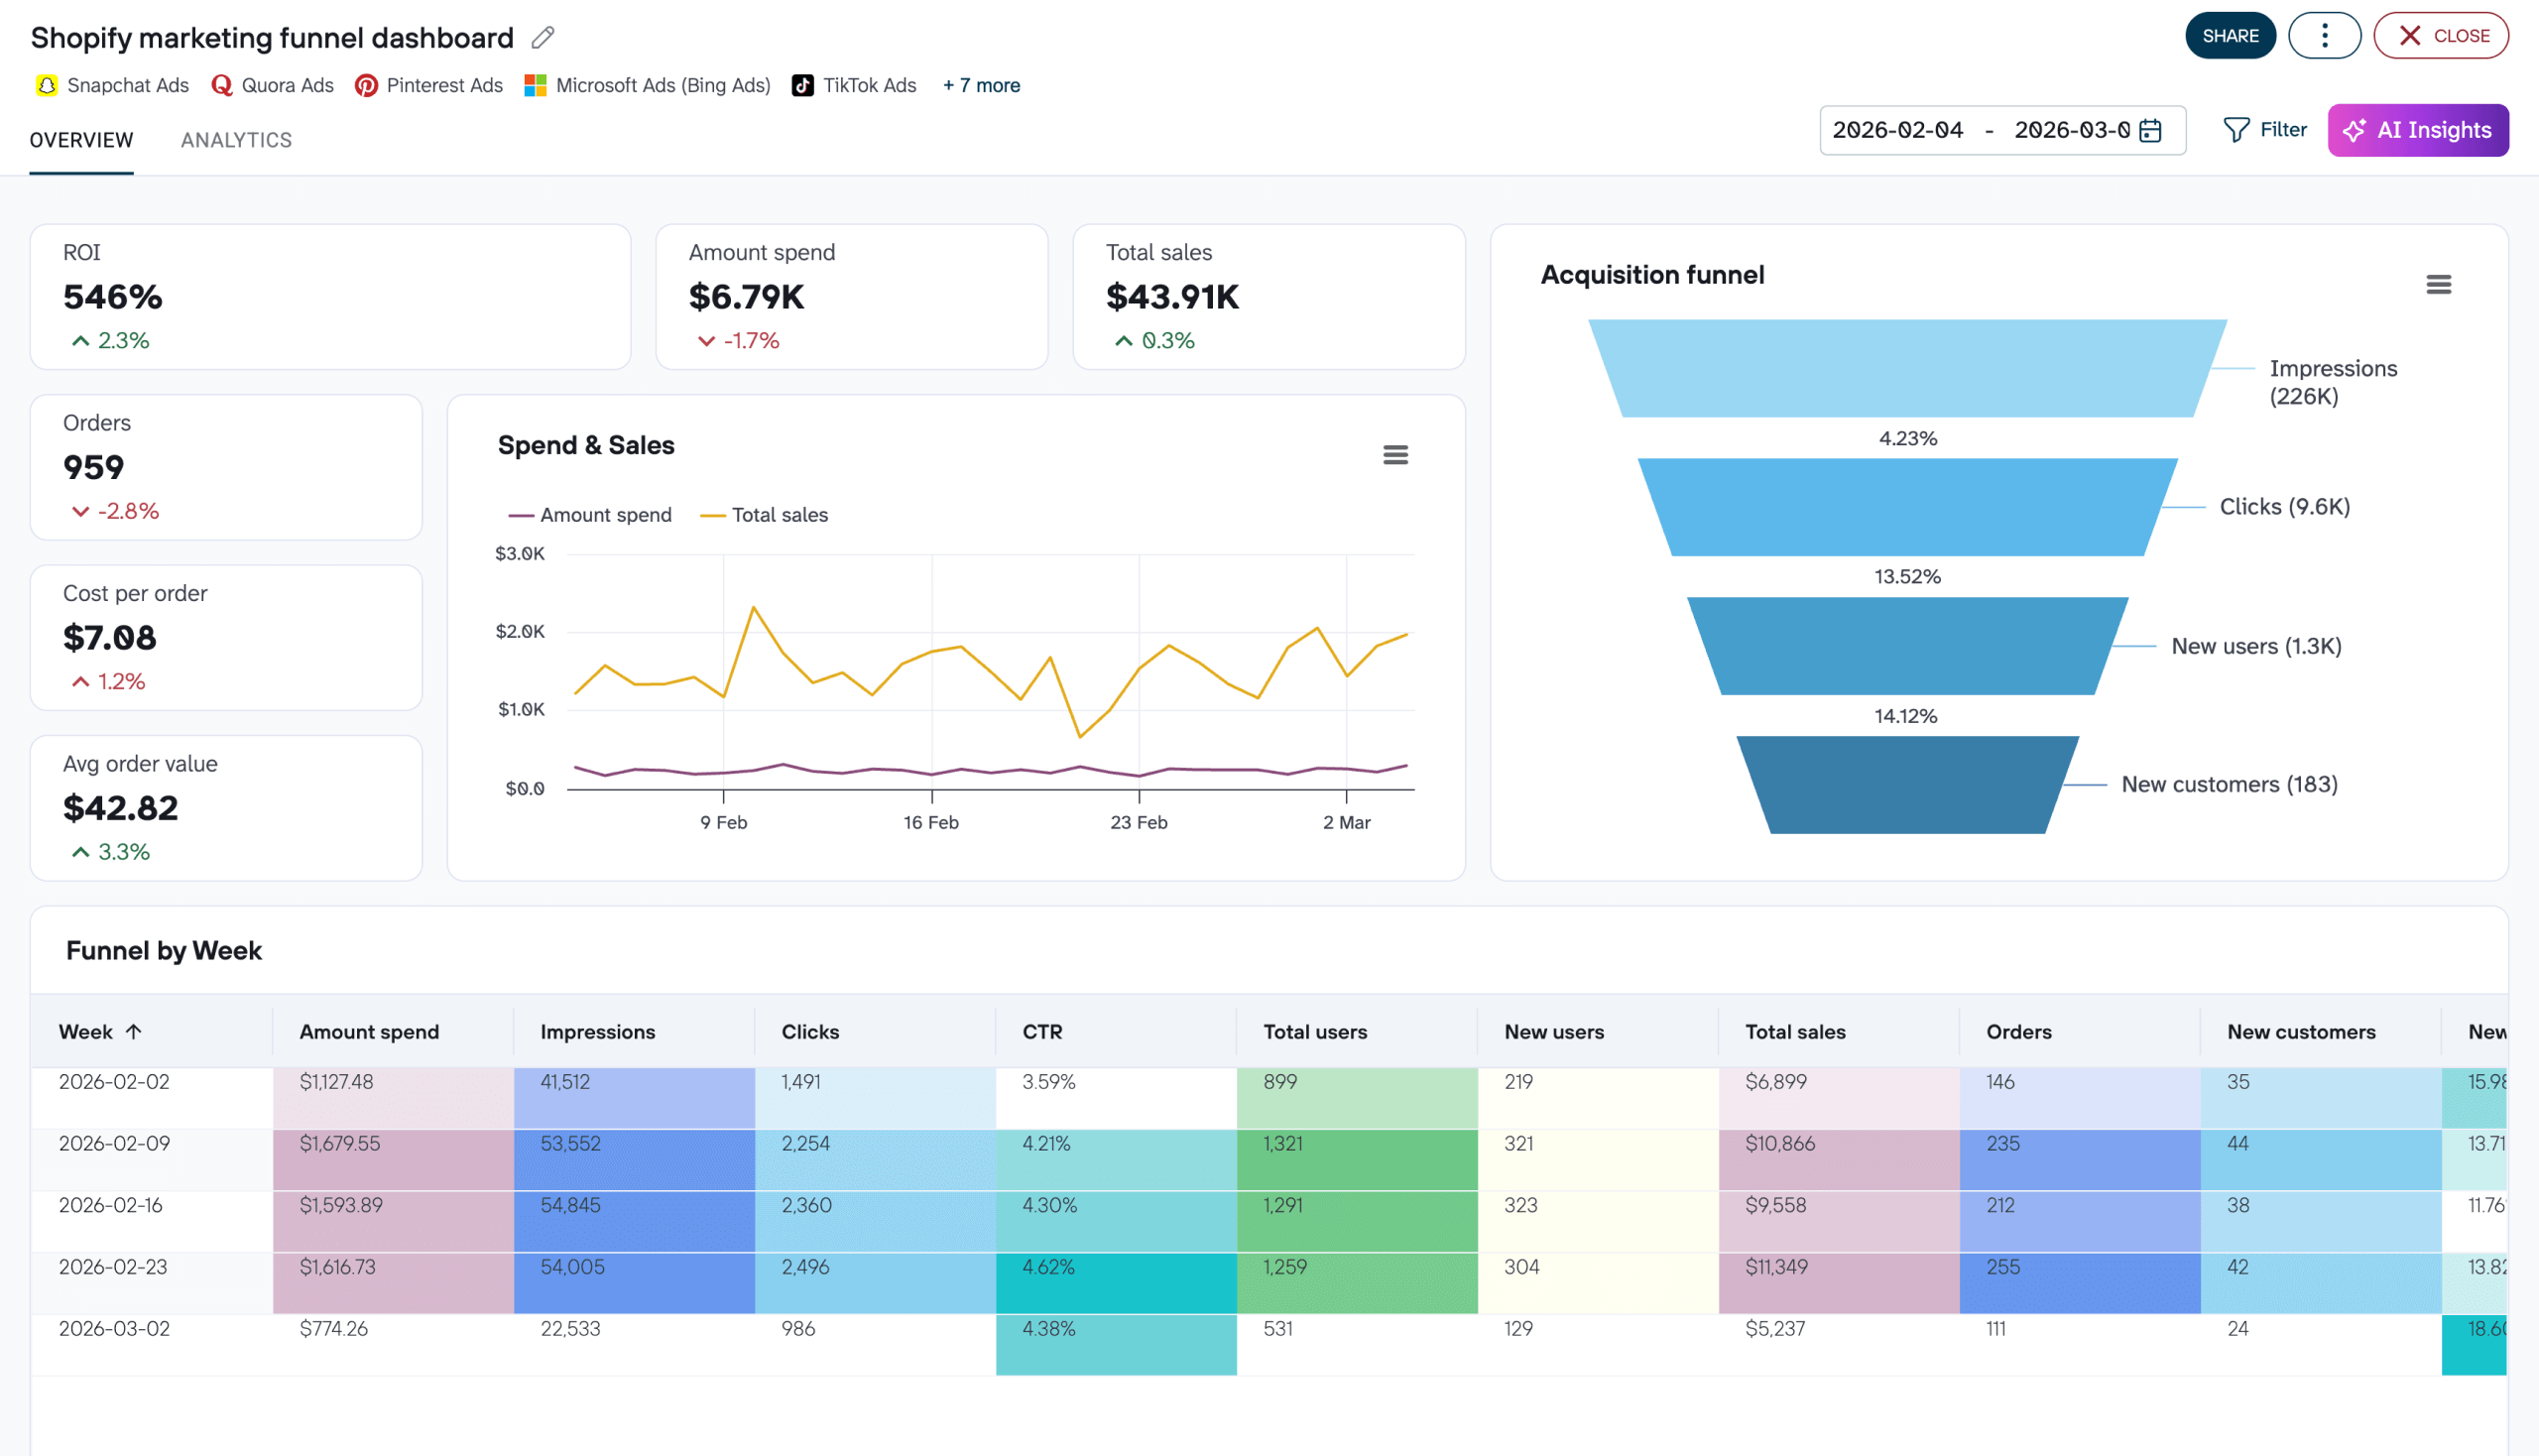
Shopify marketing funnel dashboard
Preview dashboardHow this dashboard solves the problem:
- Compare GA4 traffic volume with Shopify conversion rates by source
- Identify which channels bring engaged users vs. actual buyers
- Calculate ROI for each traffic source to optimize ad spend and receive guidance on how to get more sales on Shopify.
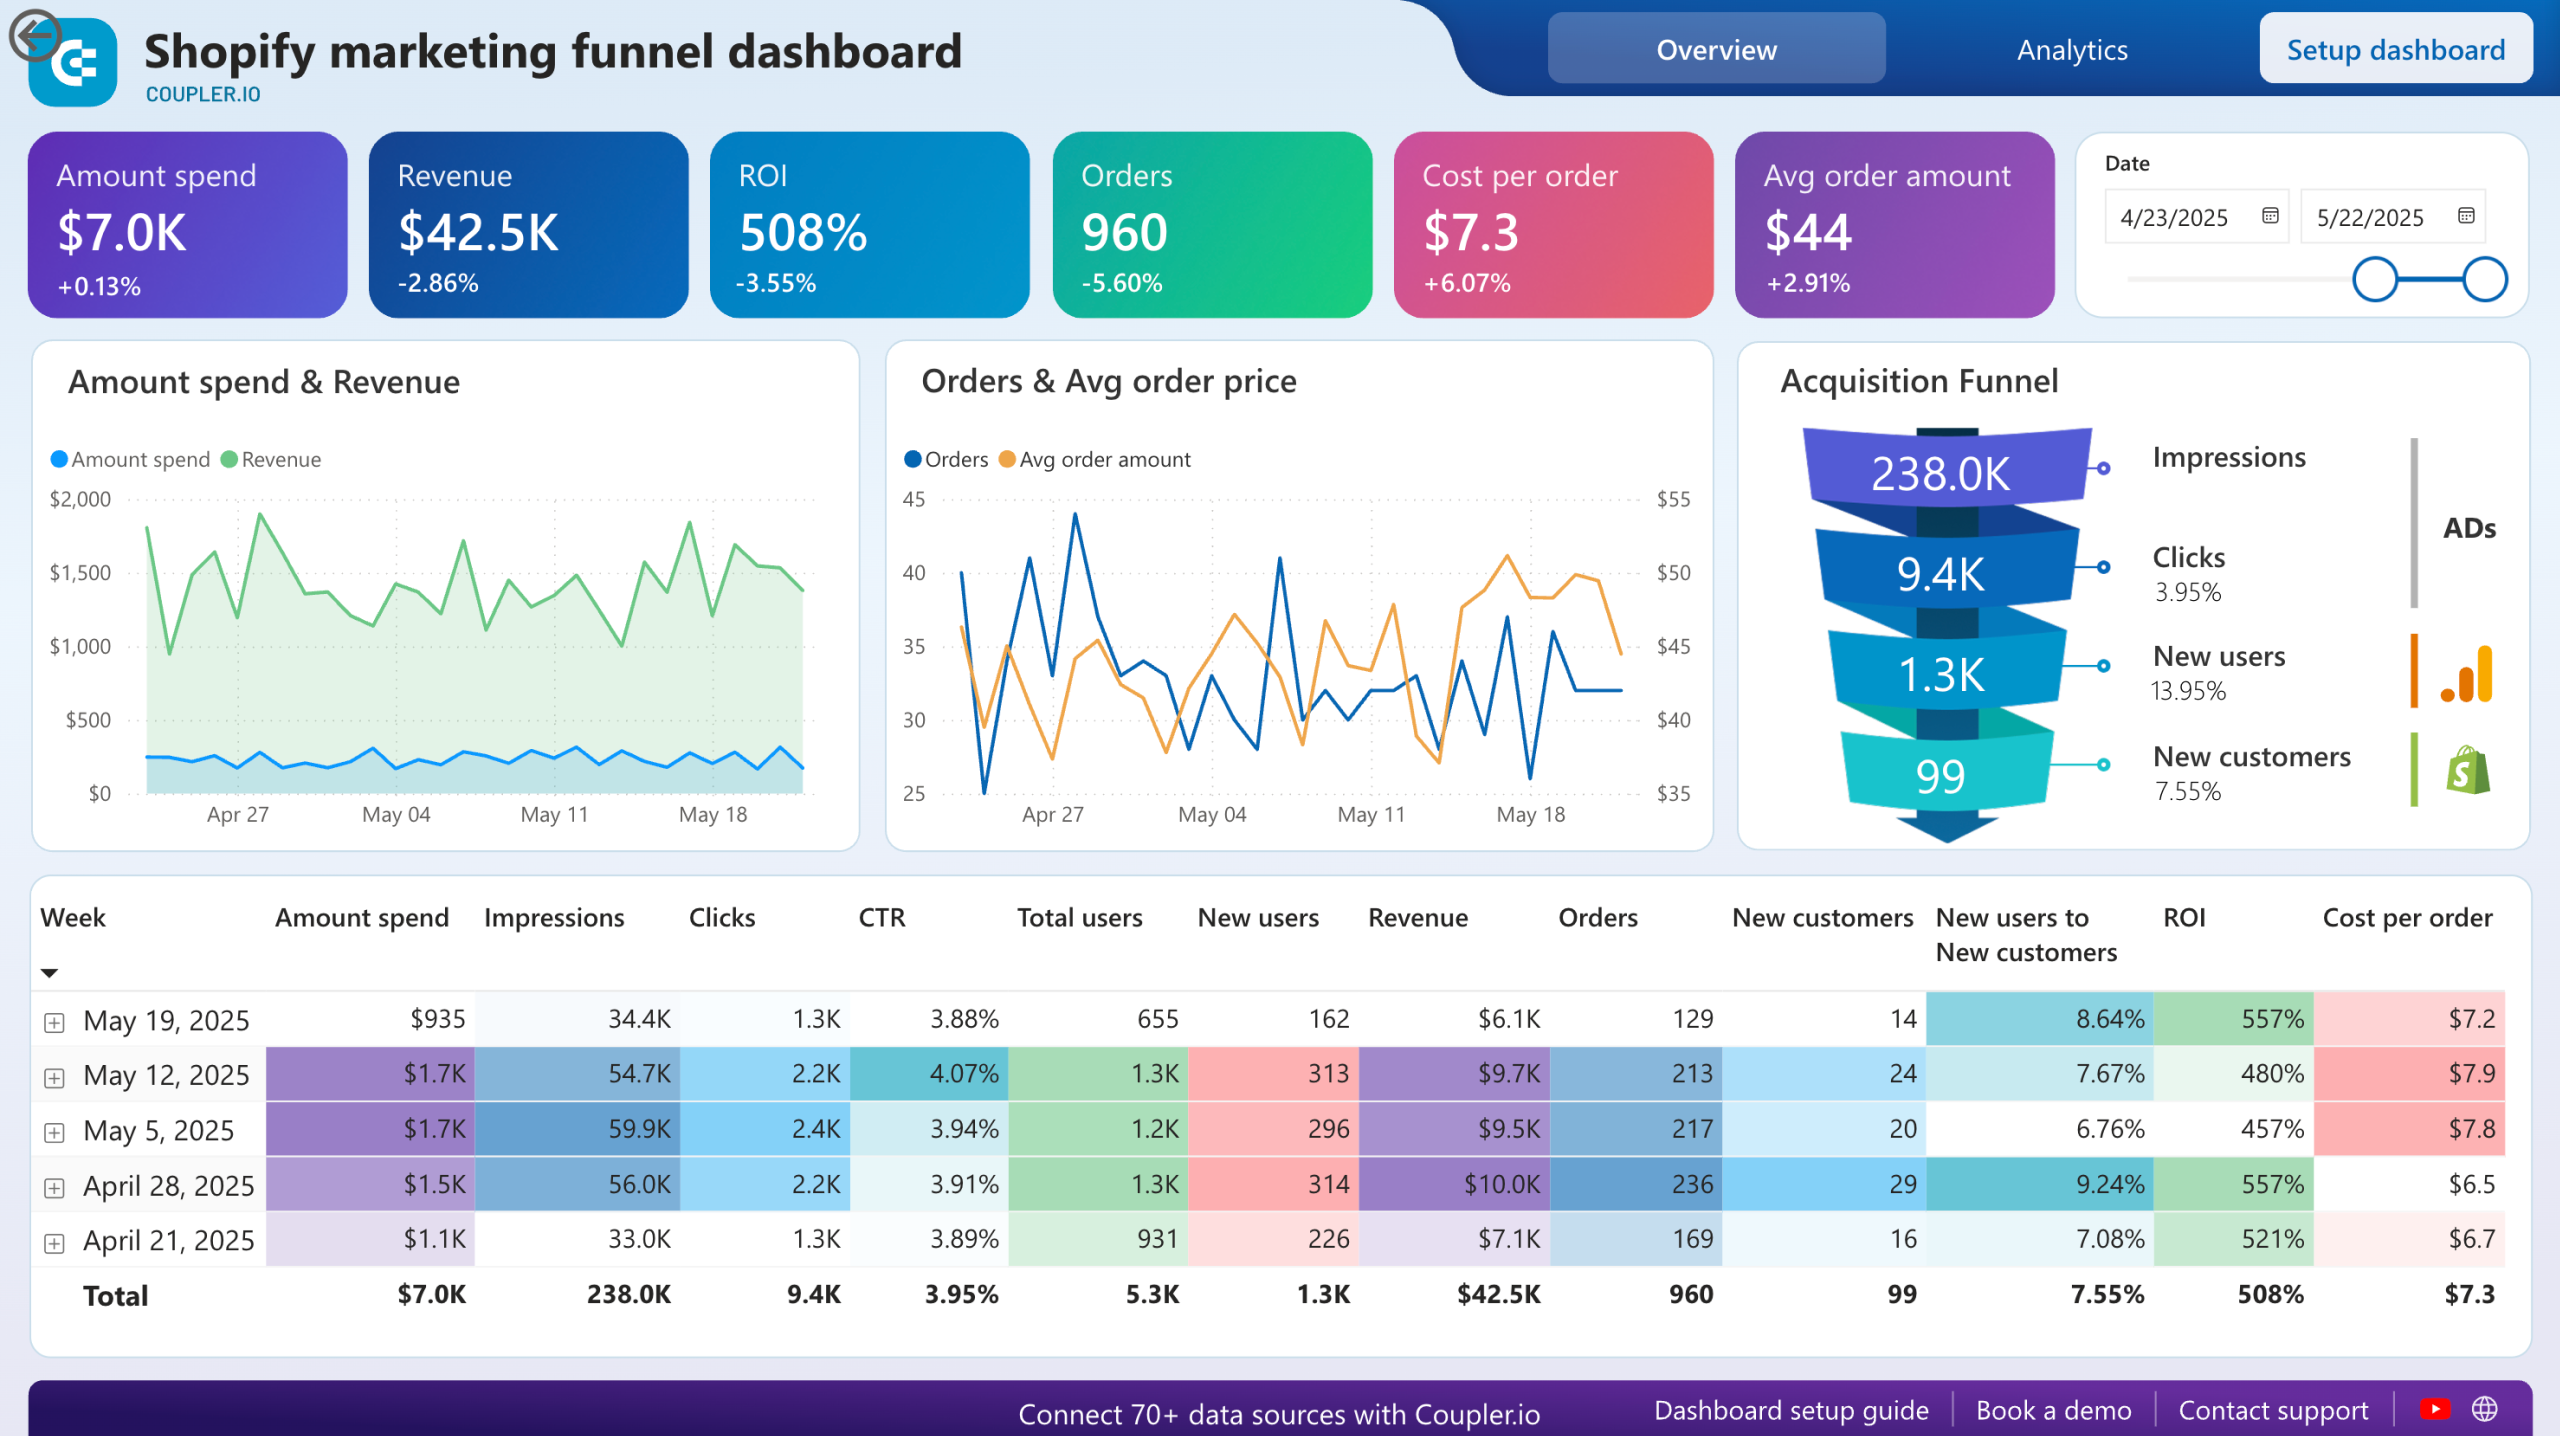
This Shopify sales funnel dashboard is equipped with pre-configured Coupler.io connectors that combine data from GA4, Shopify, and multiple ad platforms to show the complete customer journey from impression to purchase. The template is available in Coupler.io, Google Sheets, Looker Studio, and Power BI.
Shopify marketing funnel dashboard in Coupler.io
Combine data from Shopify, Google Analytics, and up to 10 ad platforms to measure your full marketing funnel — from impressions to orders. Track ROI, compare ad spend against sales revenue, and analyze cross-channel performance metrics daily and weekly.

Shopify marketing funnel dashboard in Power BI
Examine the customer journey from advertising exposure to purchase completion with integrated data from your Shopify store, advertising platforms, and analytics tools.
Shopify marketing funnel analytics dashboard in Looker Studio
Analyze the performance of the traffic to your Shopify store using data from advertising platforms and Google Analytics 4, all consolidated on a single dashboard.
Shopify marketing funnel analytics dashboard in Google Sheets
Visualize the complete customer journey from advertising exposure to purchase completion with integrated data from Shopify, advertising platforms, and Google Analytics 4. Monitor acquisition costs, conversion rates, and ROI across all marketing channels.
Landing page conversion killers
High traffic but no sales Shopify? Your GA4 shows high engagement (2+ pages per session, 45+ seconds time on page), but Shopify shows low add-to-cart rates, you have landing page issues. Use the Shopify traffic overview dashboard to calculate your add-to-cart rate and compare it to the 4.6% industry average. For this, divide the Add to cart metric by Sessions.
Is the add-to-cart rate below the industry average?
If the answer is ‘yes’, it might be signaling that users find it difficult to interact with your website for a number of reasons.
- Slow page load speed. GA4 Core Web Vitals show loading issues while Shopify shows high bounce rates. To check this, access online web page speed checkers and see how long it takes a page to load. If the obtained number is above average, it’s worth involving SEO and technical specialists to optimize the website loading times through a range of back-end operations.
- Unclear value proposition. GA4 shows short session durations while Shopify shows low engagement. If the average time on site is low, this might signify traffic quality issues. Users often struggle to understand the purpose of your products or services. To address this problem, conduct a series of polls and interviews to determine what your target audience thinks. That way, you will be able to shape an ICP (ideal customer profile) to drive high-quality traffic to your website, engaging the right audience that is interested in your products.
- Confusing user interface. GA4 shows 70% mobile traffic, but Shopify shows 0.5% mobile conversion. If your website experiences high bounce rates, it’s likely that it has a vague structure, a non-ergonomic design, and difficult-to-read text. That way, visitors don’t stay on such a website for long. What’s more, if a page isn’t optimized for mobile or tablet view, visitors will not be able to proceed with further actions on it. Therefore, put in some effort to refine your website’s UI/UX design to make it more appealing and user-friendly.
Product page optimization failures
The core reasons for no sales and minimal add-to-carts for product pages are the same as those for the landing page. However, the former might evidence additional reasons for no conversions.
- Insufficient product information and photos. If the description is too short and incomplete, lacks information on available sizes or colors, and features poor-quality product images, a user will likely drop off such a page. That’s why conducting a comprehensive audit of your product pages can help improve Shopify sales.
- Lack of reviews. Even if you have just started an e-commerce business, it’s highly recommended to take care of product reviews. Their absence renders visitors suspicious and provokes a lack of trust towards your brand. Insufficient feedback is among the top reasons for low conversion rates.
- Missing trust signals. You should provide basic information about your business, such as location, contact details, registration number, and so on. It’s also highly recommended to clearly state the return/refund policy as well as customer support options. The lack of these elements results in a low trustworthiness level among your website visitors.
Checkout process friction
GA4 might show users reaching checkout pages, but if Shopify shows high cart abandonment (above 70% according to Shopify), you have checkout issues.
Let’s get back to the Shopify traffic overview dashboard and calculate the cart abandonment rate using the following formula:
(1 - (Total purchases / Total add to carts))*100%.

If your rate is higher, the possible reasons include:
- High shipping costs. Check whether the couriers you collaborate with offer competitive prices in the market. Decide whether you’d like to cooperate with other companies that offer more affordable shipping options.
- Unexpected tax rates. An extra tax is often applied at the checkout for international orders. Some customers might decide not to proceed with payment for that reason. Therefore, you should include a warning that clearly states the possibility of additional taxes being applied.
- Limited payment options. While Shopify Payments, Stripe, and PayPal are popular gateways, they are not available in every country. Therefore, users might decide to drop off if they don’t see their preferred method. Make sure to include as many payment options as possible on your website.
- Complicated checkout process. If the checkout process is too lengthy with many steps or requires obligatory registration on the website, this may cause many visitors to bounce out of it. Include a guest checkout option to simplify the checkout process and increase sales on Shopify.
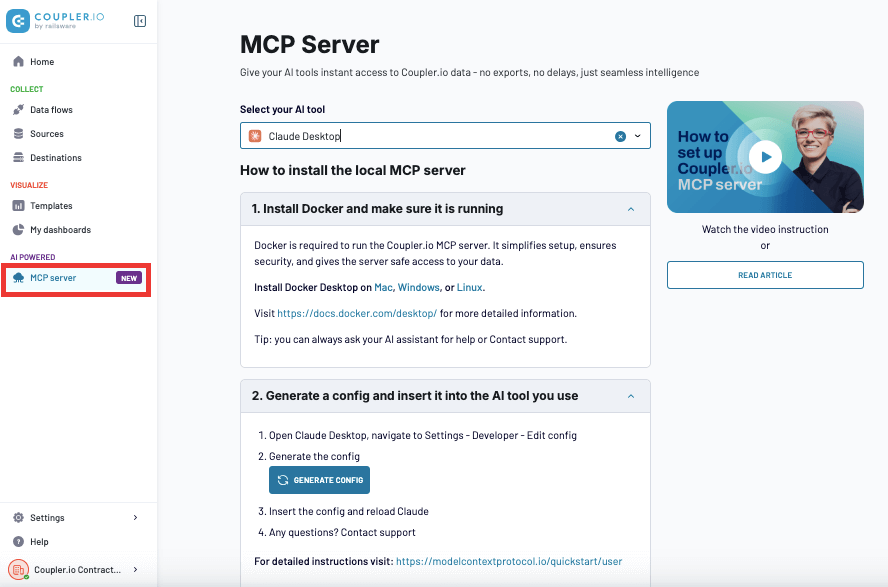
Ask AI for help with data analysis
While dashboards simplify analysis, AI can optimize it further. Coupler.io MCP server lets you ask Claude to analyze your GA4 and Shopify data directly.

Instead of manually calculating metrics or finding bottlenecks, ask Claude:
"Compare my GA4 bounce rates with Shopify conversion rates by device"
"Which GA4 traffic sources have high engagement but low Shopify sales?"
"What's my cart abandonment rate by traffic source and which have the highest drop-off?"
Claude will analyze the requested data and share insights with you in natural language. Check out how you can set up and use the Coupler.io MCP server and power your sales analytics with AI.

How to increase sales on Shopify: Converting your existing traffic
Getting page visits means that your website gains attention, and people are interested in your products. As mentioned before, high traffic doesn’t guarantee high sales. If most users bounce out, it means that your website needs some refinement.
Mobile conversion optimization
According to U.S. Statistics, around 76% of American adults prefer online shopping via mobile. Businesses that don’t optimize their e-commerce websites for mobile and tablet devices tend to lose three-fourths of potential buyers.
Adapting an e-store to various screens is known as responsive design. To make your e-commerce online shop optimized for smartphones, follow the steps below.
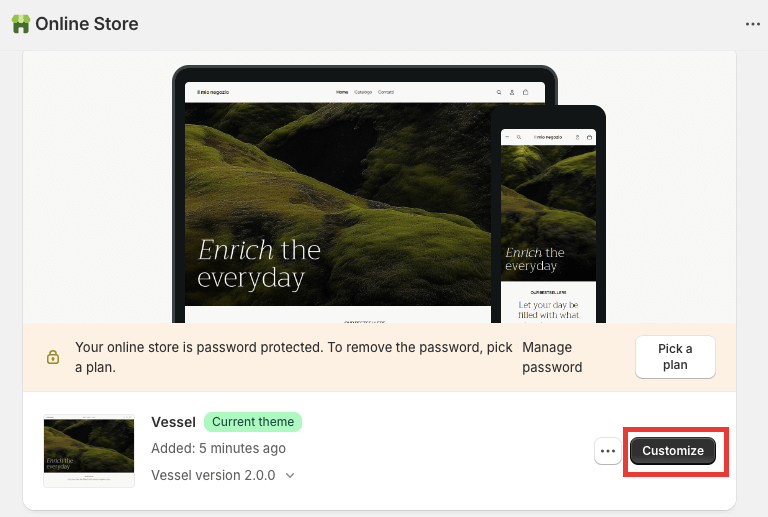
- Log in to your Shopify Admin panel.
- Go to the Online Store tab and select Theme.

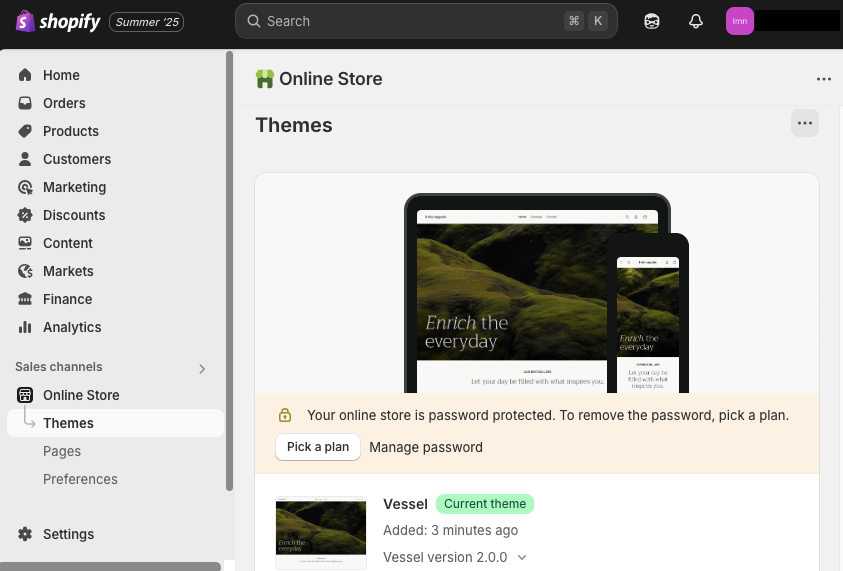
- Next to your current theme selection, click Customize.

- Click on the mobile icon in the upper panel of the screen to see how your store appears on mobile devices.

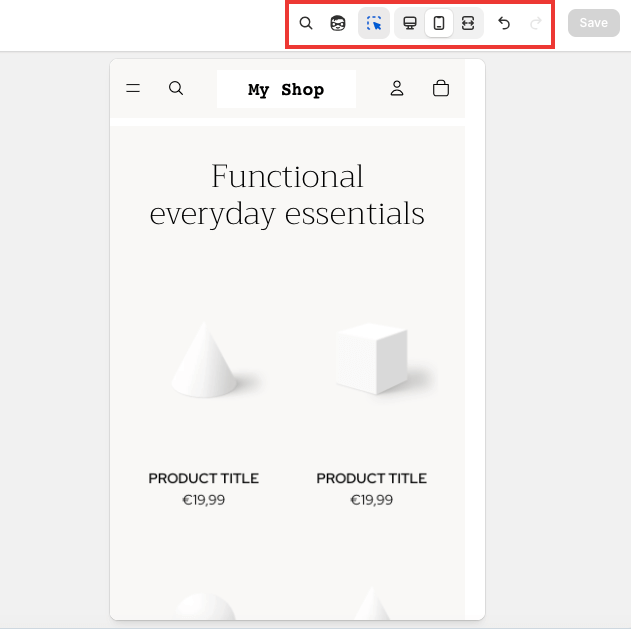
If the product items overlap with each other or the text font is too large, feel free to adjust that. Shopify lets shop owners modify, add, and remove page elements, experiment with style, adjust internal settings of each block, etc.
After having applied modifications related to responsive design, test how your e-commerce website appears on your smartphone. Go through the buyer journey on your own and make sure that the process is smooth. Pay attention to the checkout stage and verify that the information is displayed correctly and all the payment options are available.
Checkout optimization
Traffic is excellent, add-to-cart rates are impressive, but still, no sales? It means that many users drop out at the checkout. To streamline the process and enhance customer experience at this stage, it’s worth adjusting several aspects.
Checkout form
According to Shopify’s best practices, the checkout process should be quick and easy. One-page checkout contains all order-related information at hand without overwhelming users. Thus, it’s much more user-friendly than the multi-page checkout process.
To improve the checkout experience, proceed as follows:
- In your Shopify store, go to the Settings -> Checkout.

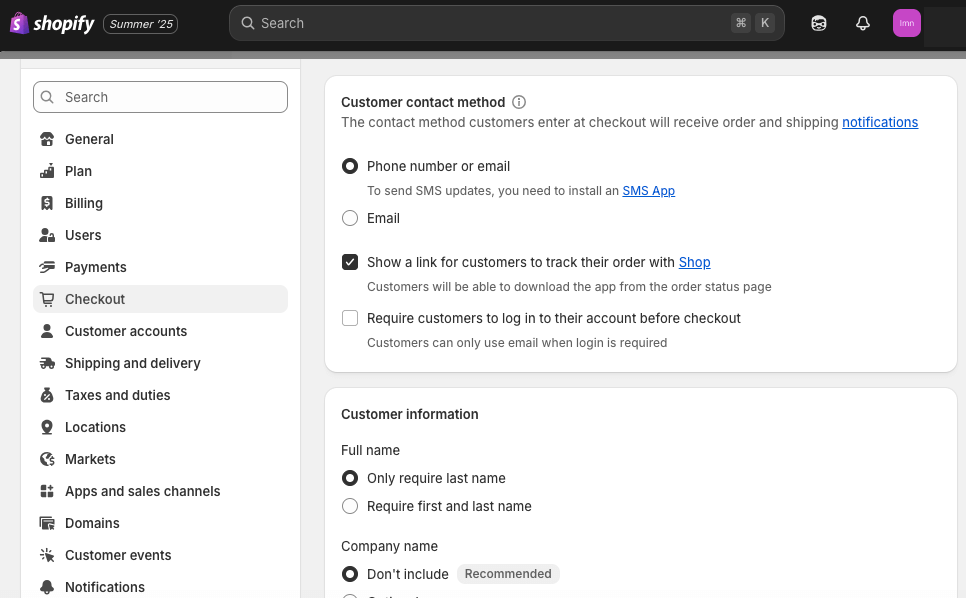
- Make sure that the Phone number or email option is selected. It provides visitors with the opportunity to select their preferred contact method.
- Verify whether the Require customer to log in … option is NOT selected. According to the recent survey data, around 23% of users abandoned a website because they had to create an account.

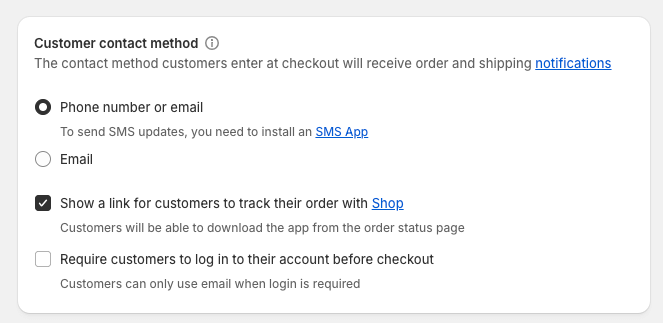
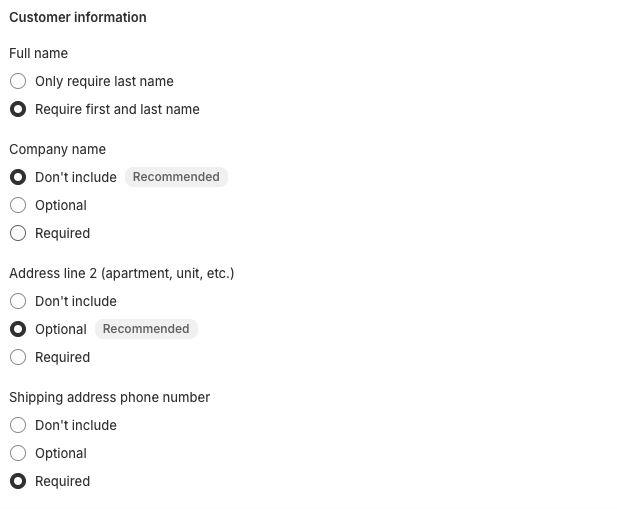
- Check the customer information collection settings. Make sure to select the recommended options to improve customer experience and reduce abandoned carts.

- Adjust other checkout settings, if needed.
Payment options
The more payment options an e-commerce store has, the better. According to PPRO, 42% of US consumers don’t proceed with a purchase if their favorite payment method isn’t available.
- In your Shopify store, go to the Settings -> Payment.

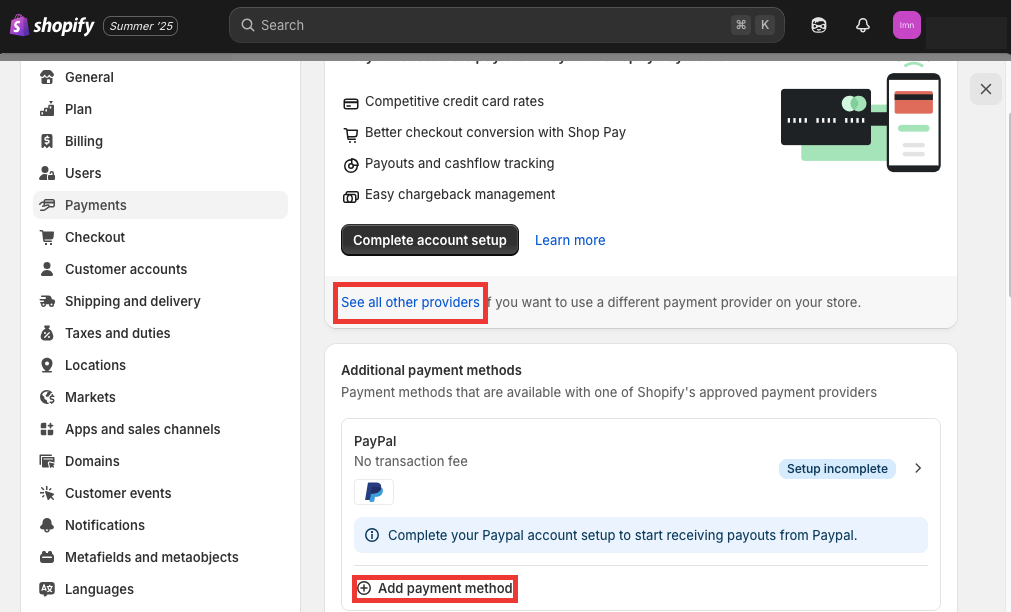
- By default, the Shopify Payments gateway is enabled. However, it’s not available everywhere – check supported countries for Shopify Payments.
- To add additional payment options, click Add payment method under the Additional payment methods section.
- To set another payment gateway as default instead of Shopify Payments, click See all other providers. Click on the payment gateway that interests you to check more details about it (supported cards, security settings, fees, etc.).

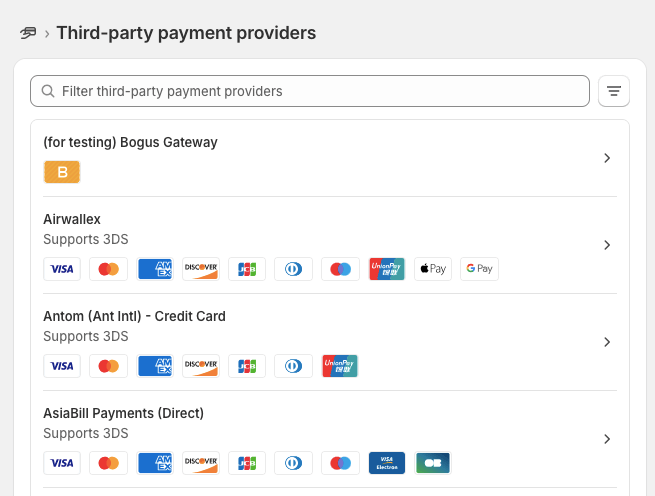
PayPal, Stripe, Adyen, Square, Worldpay, Apple Pay, credit cards, and some others are among the most popular payment gateways. To determine which one aligns with your business goals and resonates with your audience, read a detailed overview of payment gateways by Shopify.
Shipping methods
According to Baymand Institute research, 39% of users abandon their cart due to unexpected costs (including those associated with shipping), while 19% decide not to proceed with a purchase because of slow delivery times. These statistics are painful for those who sell physical products. If you are among those, let’s explore how it’s possible to mitigate the impact of shipping costs and delivery times on customer purchase decisions.
- Embed the shipping costs in the product price. This strategy will be effective for e-stores that operate within a specific region that has fixed shipping costs. This approach may not be suitable for companies that operate globally, as delivery spending will vary depending on the customer’s country.
- Offer free shipping. This type of promotion will also be suitable for those e-shops that operate locally. You can also apply it to orders whose amount exceeds $X, for instance.
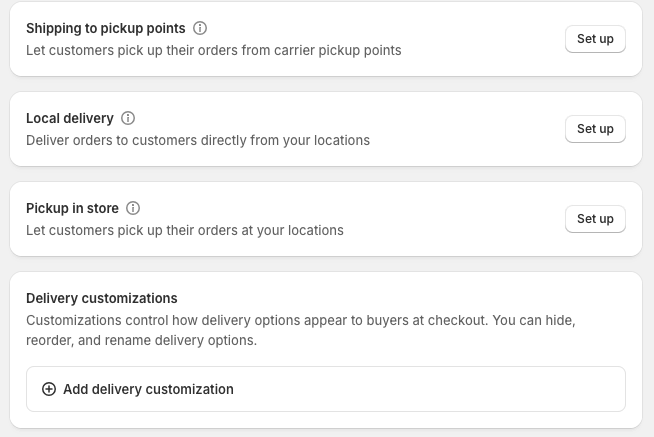
- Adjust shipping rates on Shopify. Go to the Settings -> Shipment and Delivery from the Shopify admin panel and configure the shipment options there. Adjust the rates, add couriers, enable the possibility to pick up orders in brick-and-mortar locations, and so on.

Tax calculation
As mentioned previously, two out of five users decide to abandon a cart if they come across unexpected costs (shipping, taxes, fees, etc.). Therefore, it’s better to ensure transparency regarding your products and eliminate any hidden costs that might deteriorate the buyer experience on your e-commerce website.
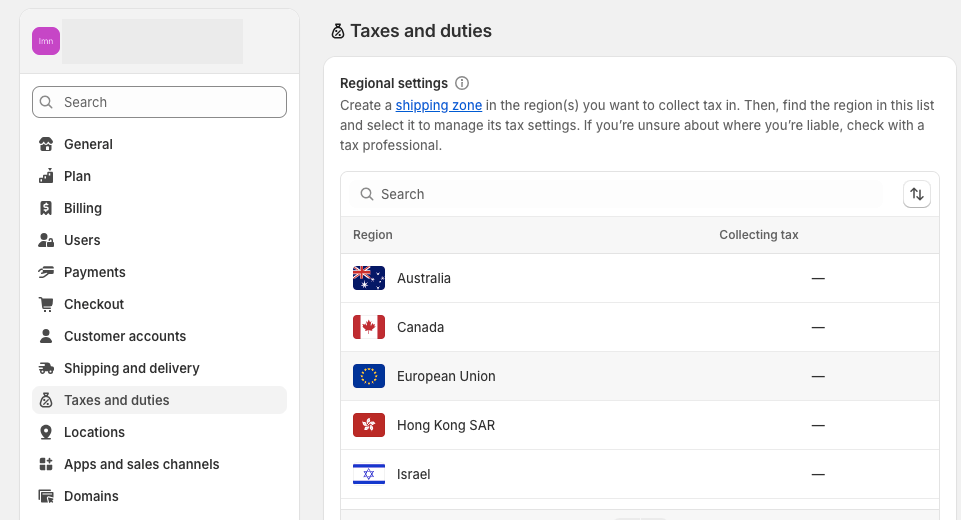
As a seller, you might need to charge taxes on sales and create monthly, quarterly, or yearly reports for your government fiscal services. Luckily, Shopify can automatically handle tax calculations since it has regional tax rates embedded and updated. However, you may also override them if needed.
All information and settings related to regional taxes are available in the Settings -> Taxes and duties within your Shopify admin panel.

The information about taxes is displayed to users at checkout. To make the taxation policy more transparent, create a dedicated web page on your e-store that provides all necessary tax-related information to visitors.
Trust and credibility enhancement
The website’s trustworthiness is one of the key factors that impact conversion rates. Making the website as credible as possible is particularly essential for startups and newly established businesses.
- Include contact information. Provide your company’s registration address in the website footer and the Contact Us page. Add links to your business profiles on social media there as well.
- Display security badges. Quality seals, certifications, and charity affiliations tell users that making a purchase on your web store is safe. The most common security badges include logos of payment processors (Visa, Mastercard, PayPal) and security certifications (SSL, Norton). According to recent research, around 17% of cart abandonments occur due to concerns about online security.
- Home and About Us pages optimization. Describe your business and introduce your team members on these pages. Add a link to your company’s LinkedIn profile.
- Clear policies. Elaborate on your privacy and refund policies with legal professionals. Afterwards, publish them on the dedicated pages of your website. Shopify automatically includes the Privacy Policy page in the e-commerce store, but you can adjust the text on it at any time.

Advanced conversion strategies when your Shopify store not converting
Personalization and recommendations
Currently, Shopify doesn’t offer built-in mechanisms and AI-based widgets for personalized recommendations, emails, and content suggestions. Therefore, consider additional tools on the Shopify App Store to tailor the user experience to each individual visitor.
Wiser
Wiser features a set of cross-sell and upsell widgets that display intelligent product suggestions for each customer. Such recommendations are available not only at the checkout but on the homepage, product pages, cart, and even on the post-purchase stage. This AI-powered engineer suggests “related products” or “frequently bought together” based on customer browsing behavior, which positively impacts buying decisions.
This engine supports English, French, German, Japanese, and Chinese languages. What’s more, you can use it for free if the number of your monthly orders on the e-store is under 50.
LimeSpot
LimeSpot is another AI-based tool that enables businesses to increase sales and conversion. It builds AI bundle upsell offers and upsell product suggestions across your website, from the homepage to post-purchase. LimeSpot is available only in English and can be used for free if the number of online orders on your Shopify store doesn’t exceed 10.
Klaviyo
Klaviyo is a well-known marketing automation platform tailored explicitly for B2C e-commerce businesses. The Shopify App Store offers the Klaviyo application, which integrates and synchronizes data between these two platforms. Such a combination allows you to benefit from web activity, tags, and other data collected on Shopify for email personalization in Klaviyo.
Consider the Klaviyo & Shopify dashboard by Coupler.io to gain a combined overview of your email marketing funnel performance and online store KPIs within a unified space.

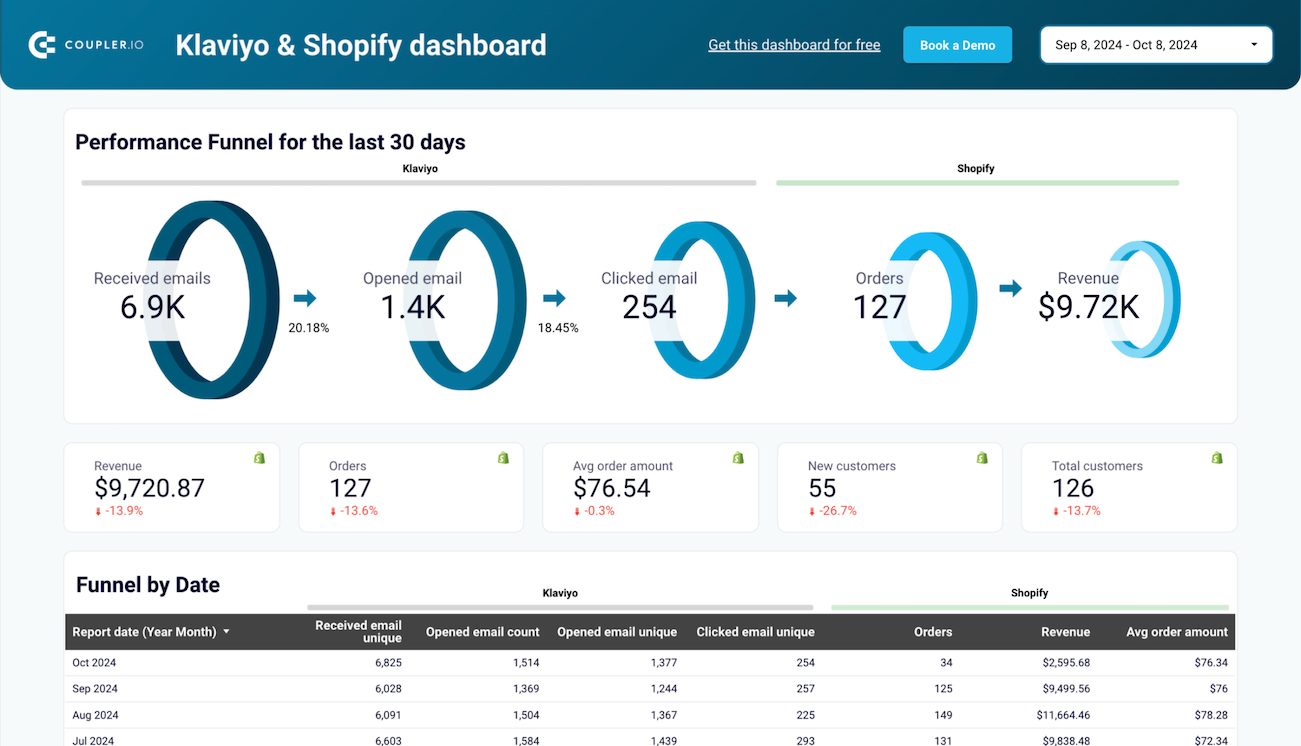
Klaviyo email campaign performance dashboard for Shopify store
Track the performance of your Klaviyo email campaigns and their direct impact on Shopify store orders in one comprehensive dashboard.
A/B testing your way to higher conversions
One of the widely used techniques for website optimization and subsequent conversion growth is A/B testing. It’s also known as split testing, which compares two versions of the same webpage, each of which is shown to a different portion of your audience. Its aim is to detect which of the two versions drives better engagement and conversion rates.
Since this method is more advanced than the previously mentioned ones, we’d also suggest additional apps available on the Shopify App Store.
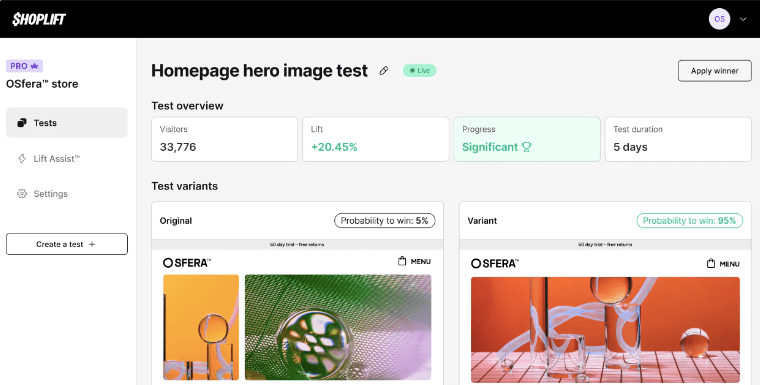
Shoplift
Shoplift is designed to make A/B testing easy through a quick preparation of split tests, which can be launched directly within your Shopify theme. A significant advantage of this tool is that it enables businesses to run A/B tests without requiring developer resources. It also handles audience segmentation and advanced analytics for AOV, CVR, and other key metrics effectively.

ABconvert
ABconvert helps businesses conduct split tests that target various aspects of their store, including prices, shipping rates, checkout, content layout, and more. This tool provides real-time analytics that enable you to monitor test results in real-time. Based on this data, you may reshape your e-commerce store development strategy.

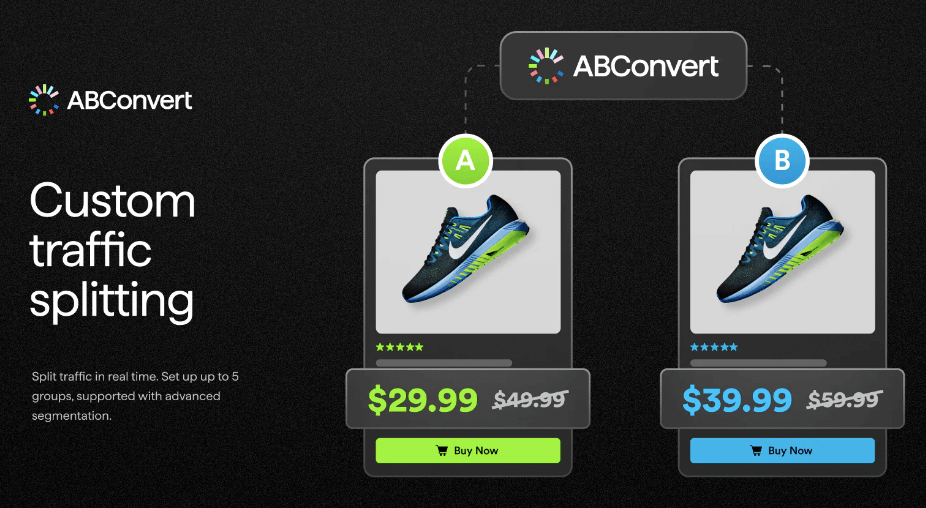
With this tool, you can also experiment with CTAs to discover which ones users click on. Also, feel free to test prices and shipping rates for different regions to see their impact on conversions.
Retargeting your traffic
Another option to convert your traffic into purchases is to launch a retargeting campaign. It will address those users who had contact with your Shopify e-store in some way.
Note that this method is only effective if you have already launched ad campaigns to promote your website.
Example 1
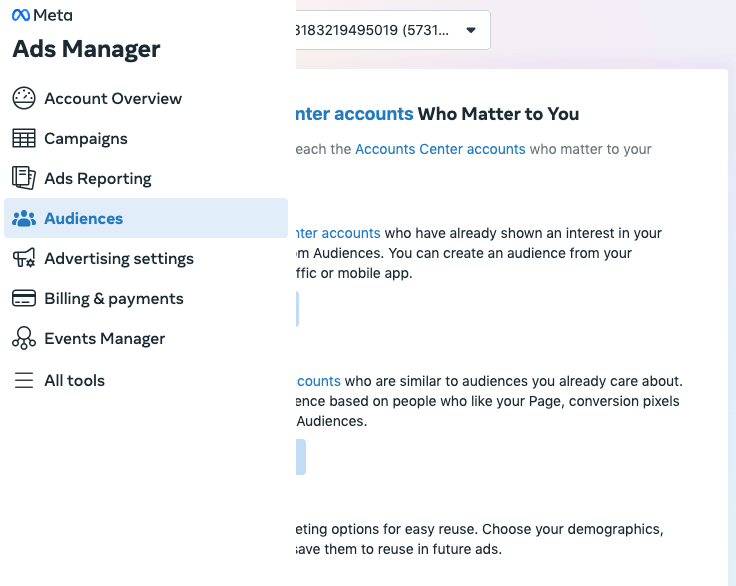
Whichever platform you use (Facebook, TikTok, Google Ads, etc.), it provides the possibility to create a custom audience. Let’s have a look at the Facebook Ads example:
- Go to your Facebook Ad Manager account.
- Go to the Audience tab.

- Click Create a custom audience.

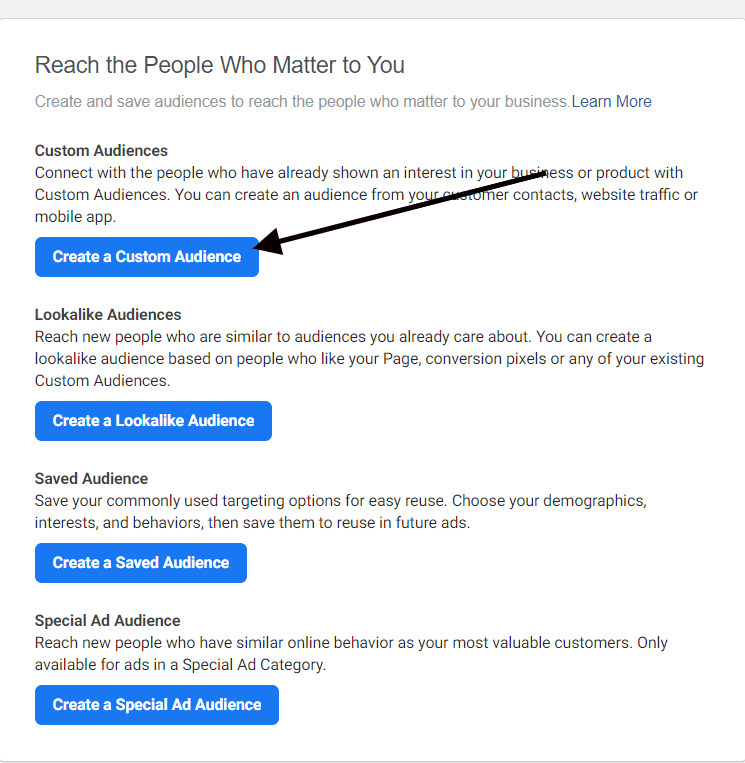
- Select Website and click Next.

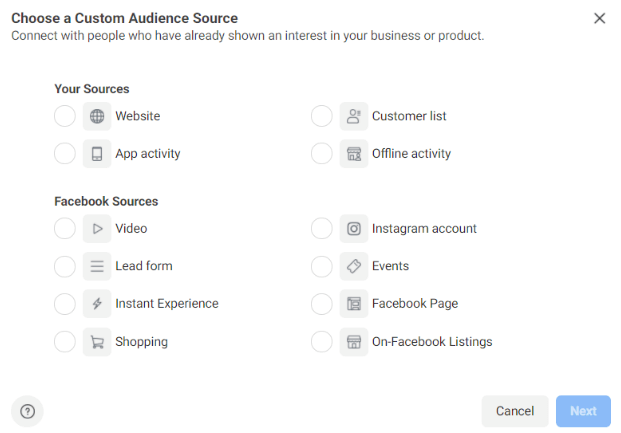
- Choose People who visited specific pages and mention product pages, checkout, etc.
- Specify the time window.
Then, create a new campaign with the Sales and Traffic objective and select the recently created audience for retargeting. Opt for dynamic product ads using Catalog + Retargeting (Dynamic Product Ads).
Example 2
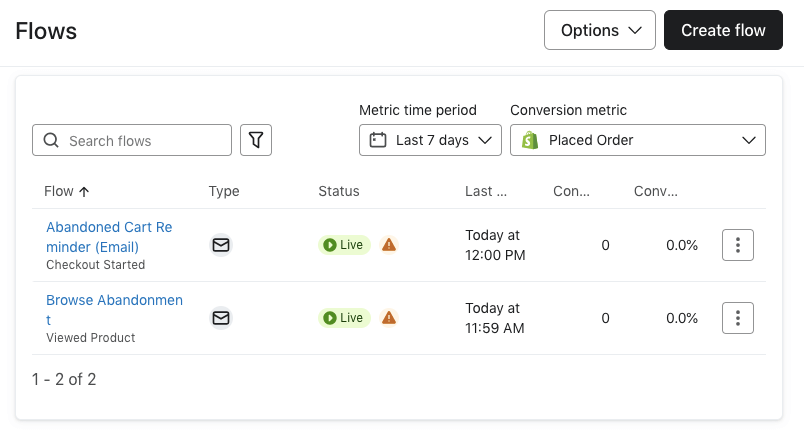
In the previous section, we demonstrated how to integrate Klaviyo and Shopify and track their combined performance. To be able to launch an email retargeting campaign, make sure to switch on the following settings on the Klaviyo side:
- Log in to your Klaviyo account.
- Go to the Integrations tab and select Shopify. Click on the three dots (… ) icon to open the context menu and select Edit integration.

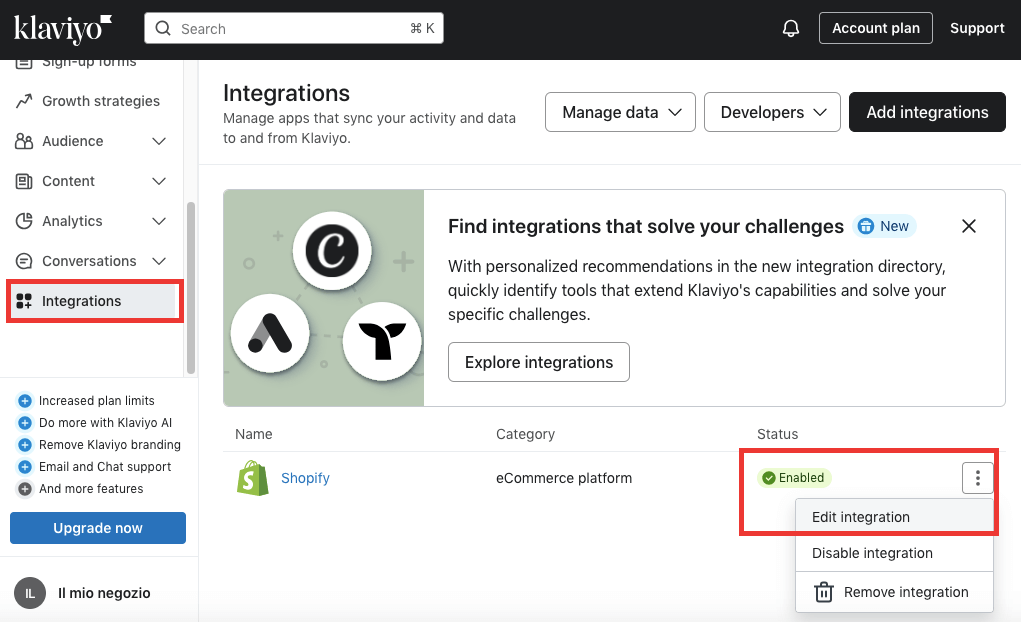
- Enable Add Viewed Product tracking and Track behaviour events options to allow Klaviyo to track user behavior on your e-commerce website.

- Go to the Flow tab and select the preferred flow.

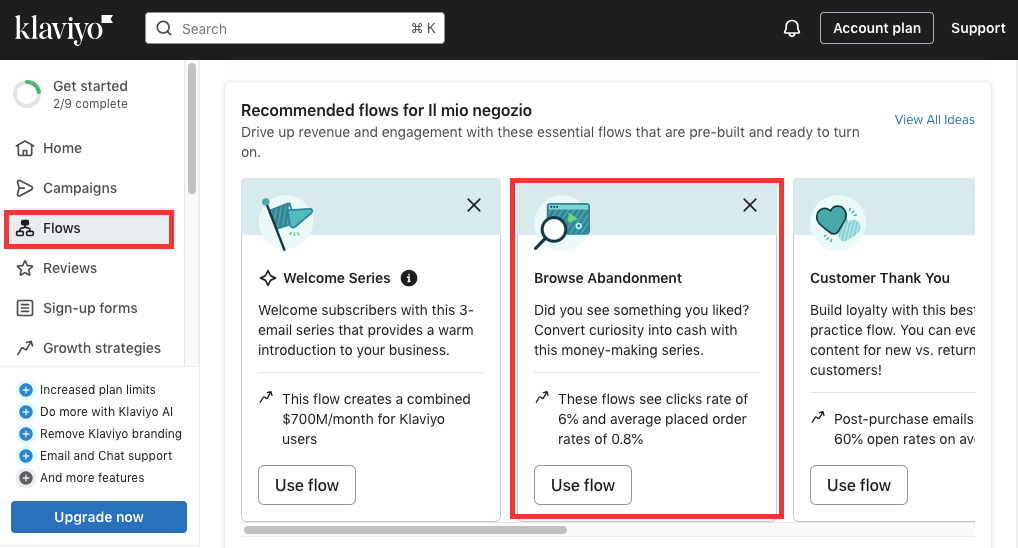
- The system already has a template flow for the chosen category. Feel free to adjust the settings and add or remove elements as needed. Once ready, click Review and turn on.

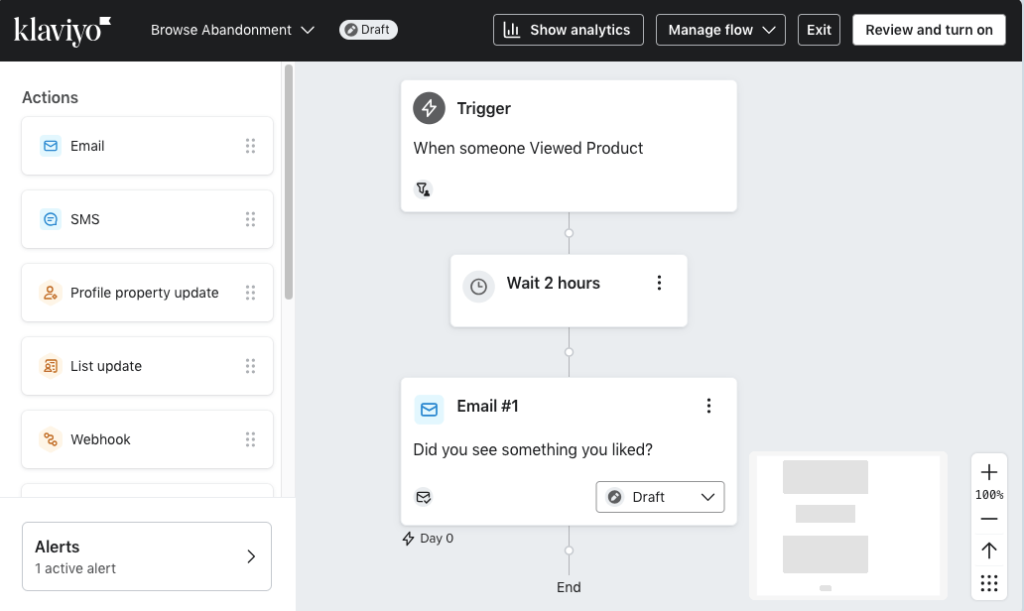
- Once the flow is live, you will be able to track the conversion metrics from your Klaviyo account.

Measuring and monitoring improvements over time
At this point, you might ask, “How long does it take to get sales on Shopify?”
After starting retargeting campaigns, adjusting your website design, and simplifying the checkout process, no doubt that your first sales are around the corner. Track your optimization progress using comprehensive dashboards by Coupler.io that combine GA4 and Shopify data.
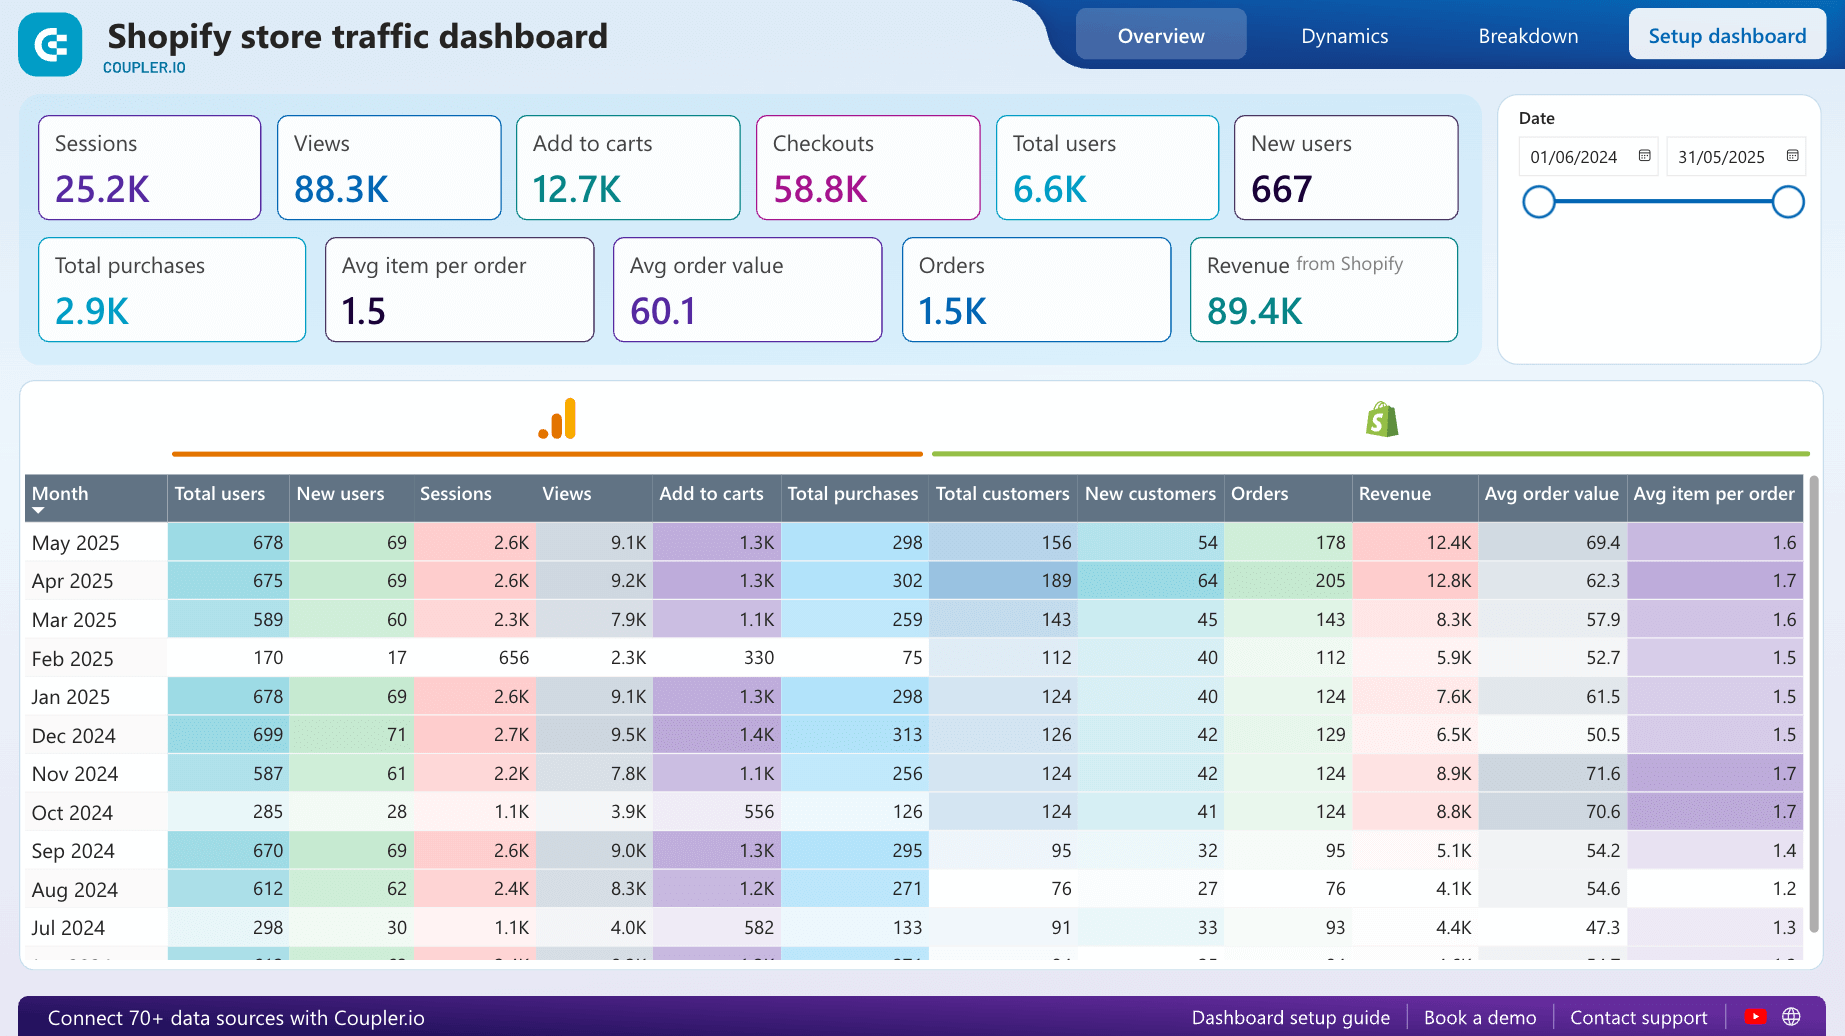
Shopify store traffic dashboard
This dashboard shows all key metrics from GA4 and Shopify. That way, you can compare traffic metrics, orders, and conversion rates of the current month with the previous ones to explore and analyze the impact of your optimization efforts.

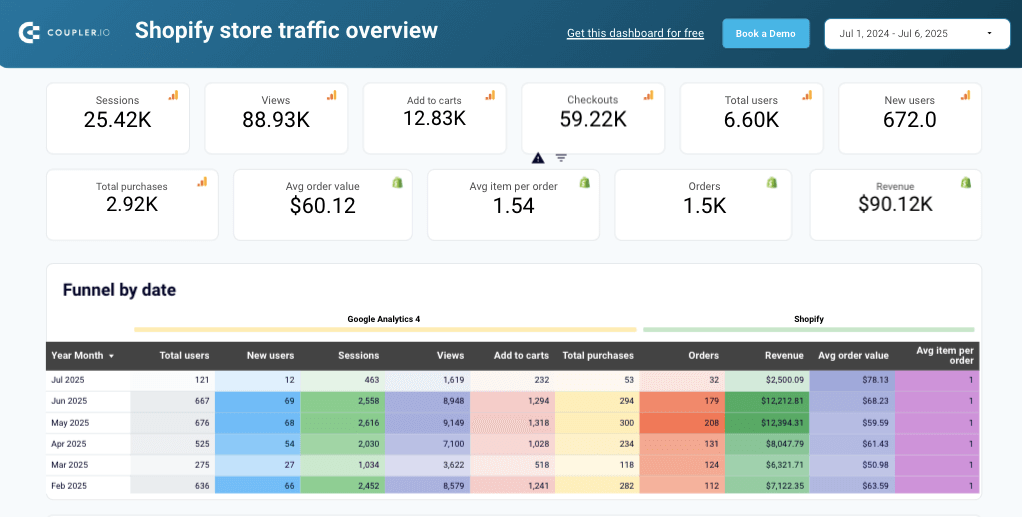
Things you can do with this dashboard:
- Discover drop-off points. Calculate the add-to-cart rate and cart abandonment rate to figure out at which stage of the buyer’s journey most website visitors drop. If the obtained numbers are below the industry average, refer to the recommendations and suggestions on website optimization provided above.
- Outline trends. Spot seasonal purchasing habits on your e-commerce website. Use this data to optimize your supply chain and make data-driven decisions on ad campaigns.
- Explore geo-based statistics. See users from which countries generate the most revenue. This information can help you refine your ad campaigns, improve inventory management, and develop localization strategies.
How to use it:
The Shopify store traffic overview dashboard is one of the most popular Shopify templates for Looker Studio. At the same time, it is also available for use in Power BI. It’s easy to start using it – just follow the step-by-step instructions in the Readme tab, accompanied by the video guide. The entire setup process requires no complex configurations since Coupler.io provides a no-code, intuitive interface with smart tips on the go.
Shopify store traffic dashboard in Power BI
Analyze traffic and purchasing metrics for your Shopify store with this dashboard that consolidates performance data from Google Analytics 4 and Shopify.

Shopify store traffic dashboard in Looker Studio
Track your Shopify store’s customer journey from visit to purchase with this dashboard that combines data from Google Analytics 4 and Shopify.
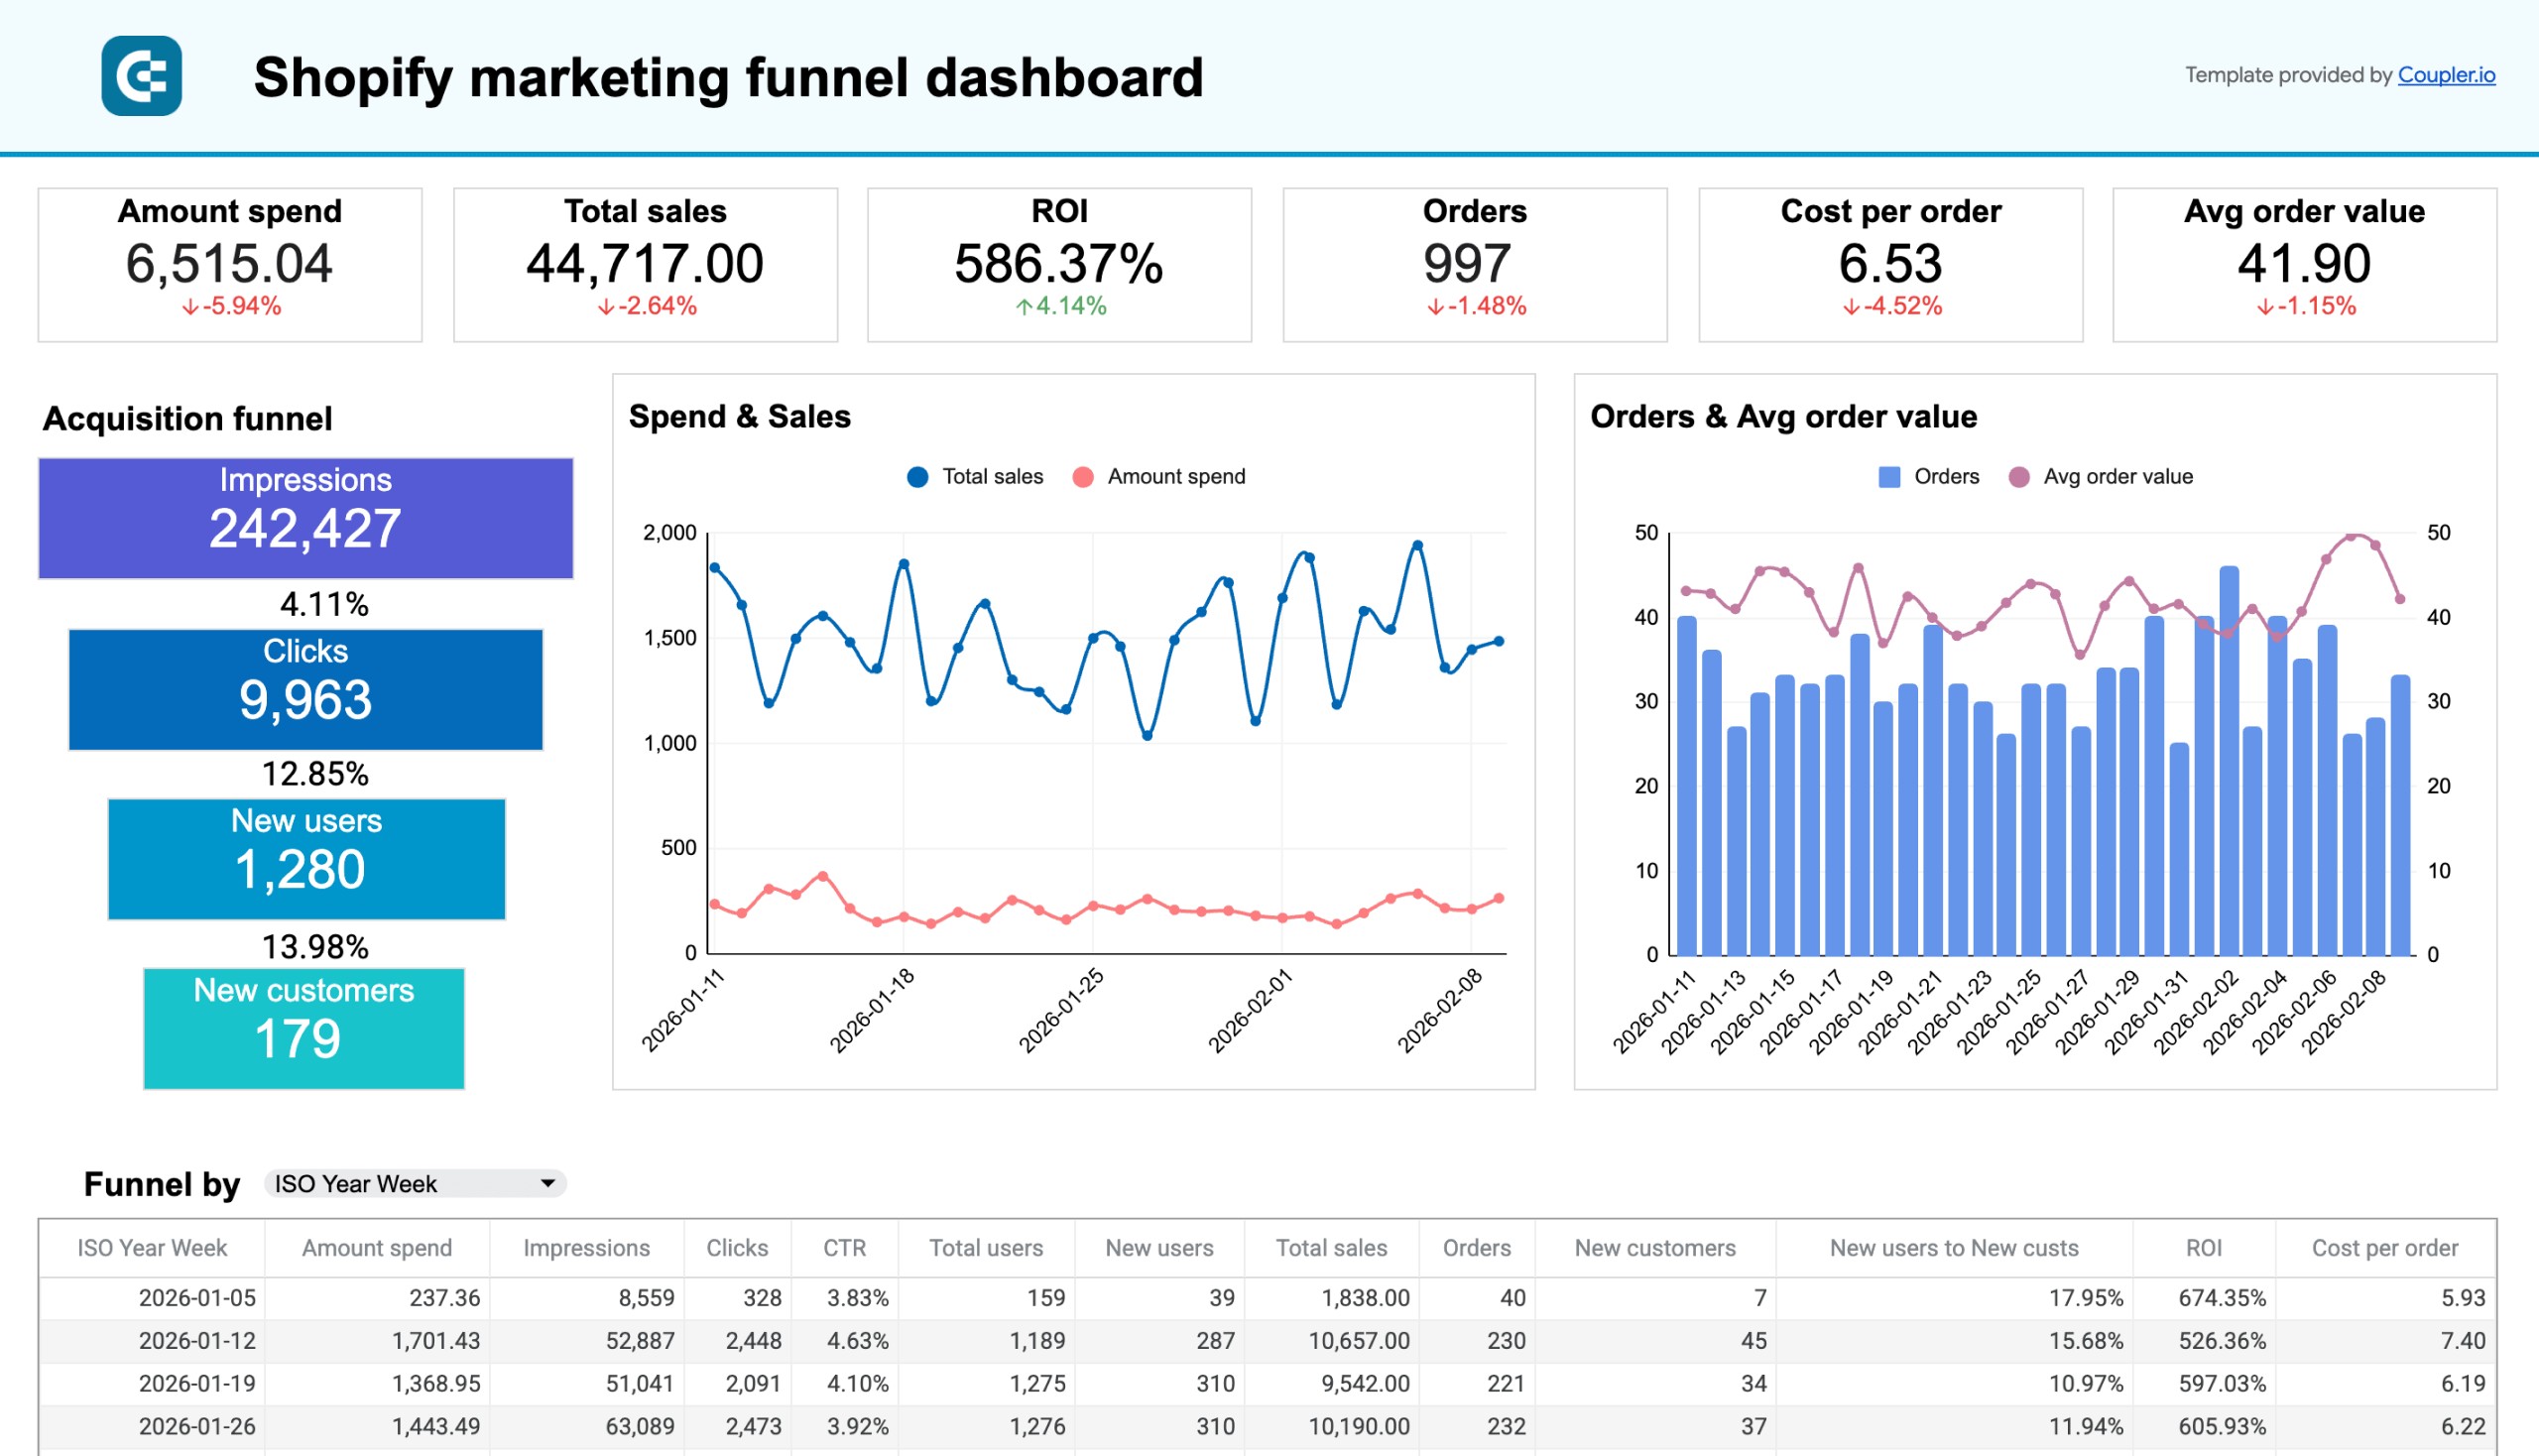
Shopify marketing funnel analytics dashboard
This template will help you detect those marketing channels that have positively contributed to your acquisition efforts. It will be particularly useful for those businesses that run ad campaigns across channels.

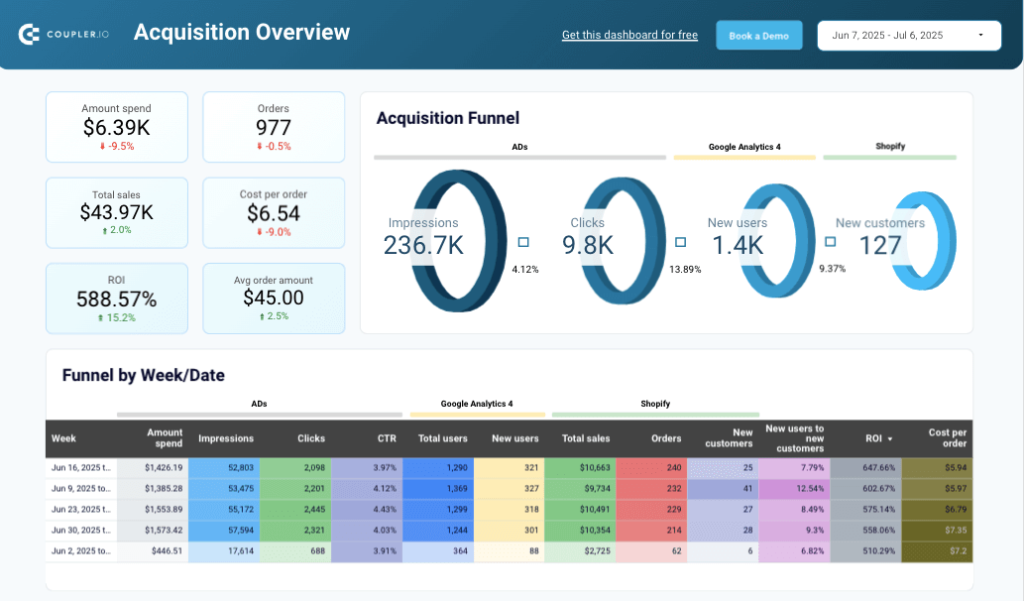
What you can do with this dashboard:
- Track the buyer journey. Monitor the marketing funnel through which users get acquainte with your website and browse it. Explore such metrics as impressions, clicks, website visitors, and new customers and see how these numbers change across funnel.
- Analyze weekly funnel results. Find the key metrics, from impressions to new customers, for each week. Compare the weekly KPIs to understand the health of your e-store and evaluate the sales increase efforts.
- Compare ad channels. Get a complete overview of all marketing platforms’ performance you use for advertising in a unified view. Juxtapose the results for each ad source to define the most efficient ones.
- Juxtapose spend and revenue data. See how investment in advertising correlated with the return on it. Decide which ad sources are the most effective to allocate your promotional campaign budget accordingly.
How to use it:
This Shopify reporting dashboard template comes in two versions: for Power BI and Google Looker Studio. Both of them have pre-configured data connectors developed by Coupler.io. They allow you to extract data automatically from Shopify, GA4, and ad platforms, and keep the dashboard updated regularly thanks to scheduling options.
Shopify marketing funnel dashboard in Power BI
Examine the customer journey from advertising exposure to purchase completion with integrated data from your Shopify store, advertising platforms, and analytics tools.


Shopify marketing funnel analytics dashboard in Looker Studio
Analyze the performance of the traffic to your Shopify store using data from advertising platforms and Google Analytics 4, all consolidated on a single dashboard.
Klaviyo & Shopify dashboard
This reporting template excellently displays the combined effort of Shopify and Klaviyo in email marketing performance. It simplifies the analytics, providing you with all the necessary data on email campaign results in one place.

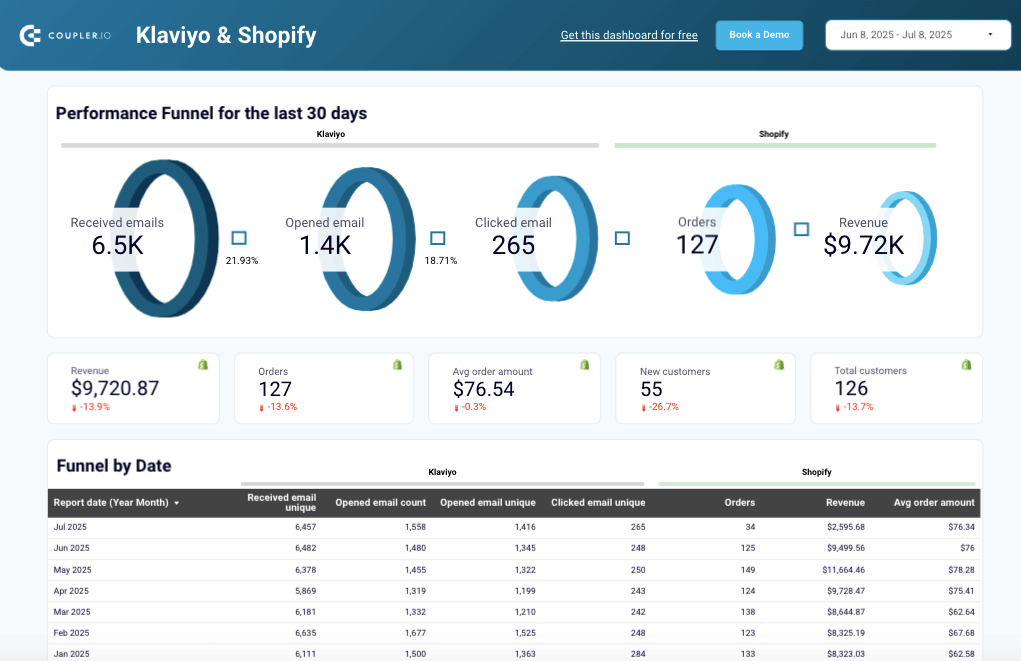
Things to do with this dashboard:
- Analyze your email marketing funnel. Explore the customer’s journey from receiving an email to placing an order. Calculate the email marketing conversion rates before and after Shopify Klaviyo integration, and analyze the integration effectiveness.
- Compare KPIs. Confront the open email rate and clicks for each month. Decide whether the metrics were improved after connecting Klaviyo to Shopify for email personalization.
- Discover top-selling items. See which products are the most and least popular on your e-commerce store. Maintain sufficient inventory levels for popular items to prevent customers from encountering product shortages and abandoning their shopping carts.
- Explore weekly email performance. Discover when most emails were clicked and orders placed. Outline seasonal patterns and adjust your promotional campaigns and stock supply accordingly.
How to use it:
This reporting template is available for Google Looker Studio. In the Readme tab of this dashboard, you will find video and text instructions on how to create the template copy and configure it. Note that it comes with pre-built connectors to Klaviyo and Shopify, enabling automated data extraction with the possibility of recurring updates to the dashboard.
Klaviyo email campaign performance dashboard for Shopify store
Track the performance of your Klaviyo email campaigns and their direct impact on Shopify store orders in one comprehensive dashboard.
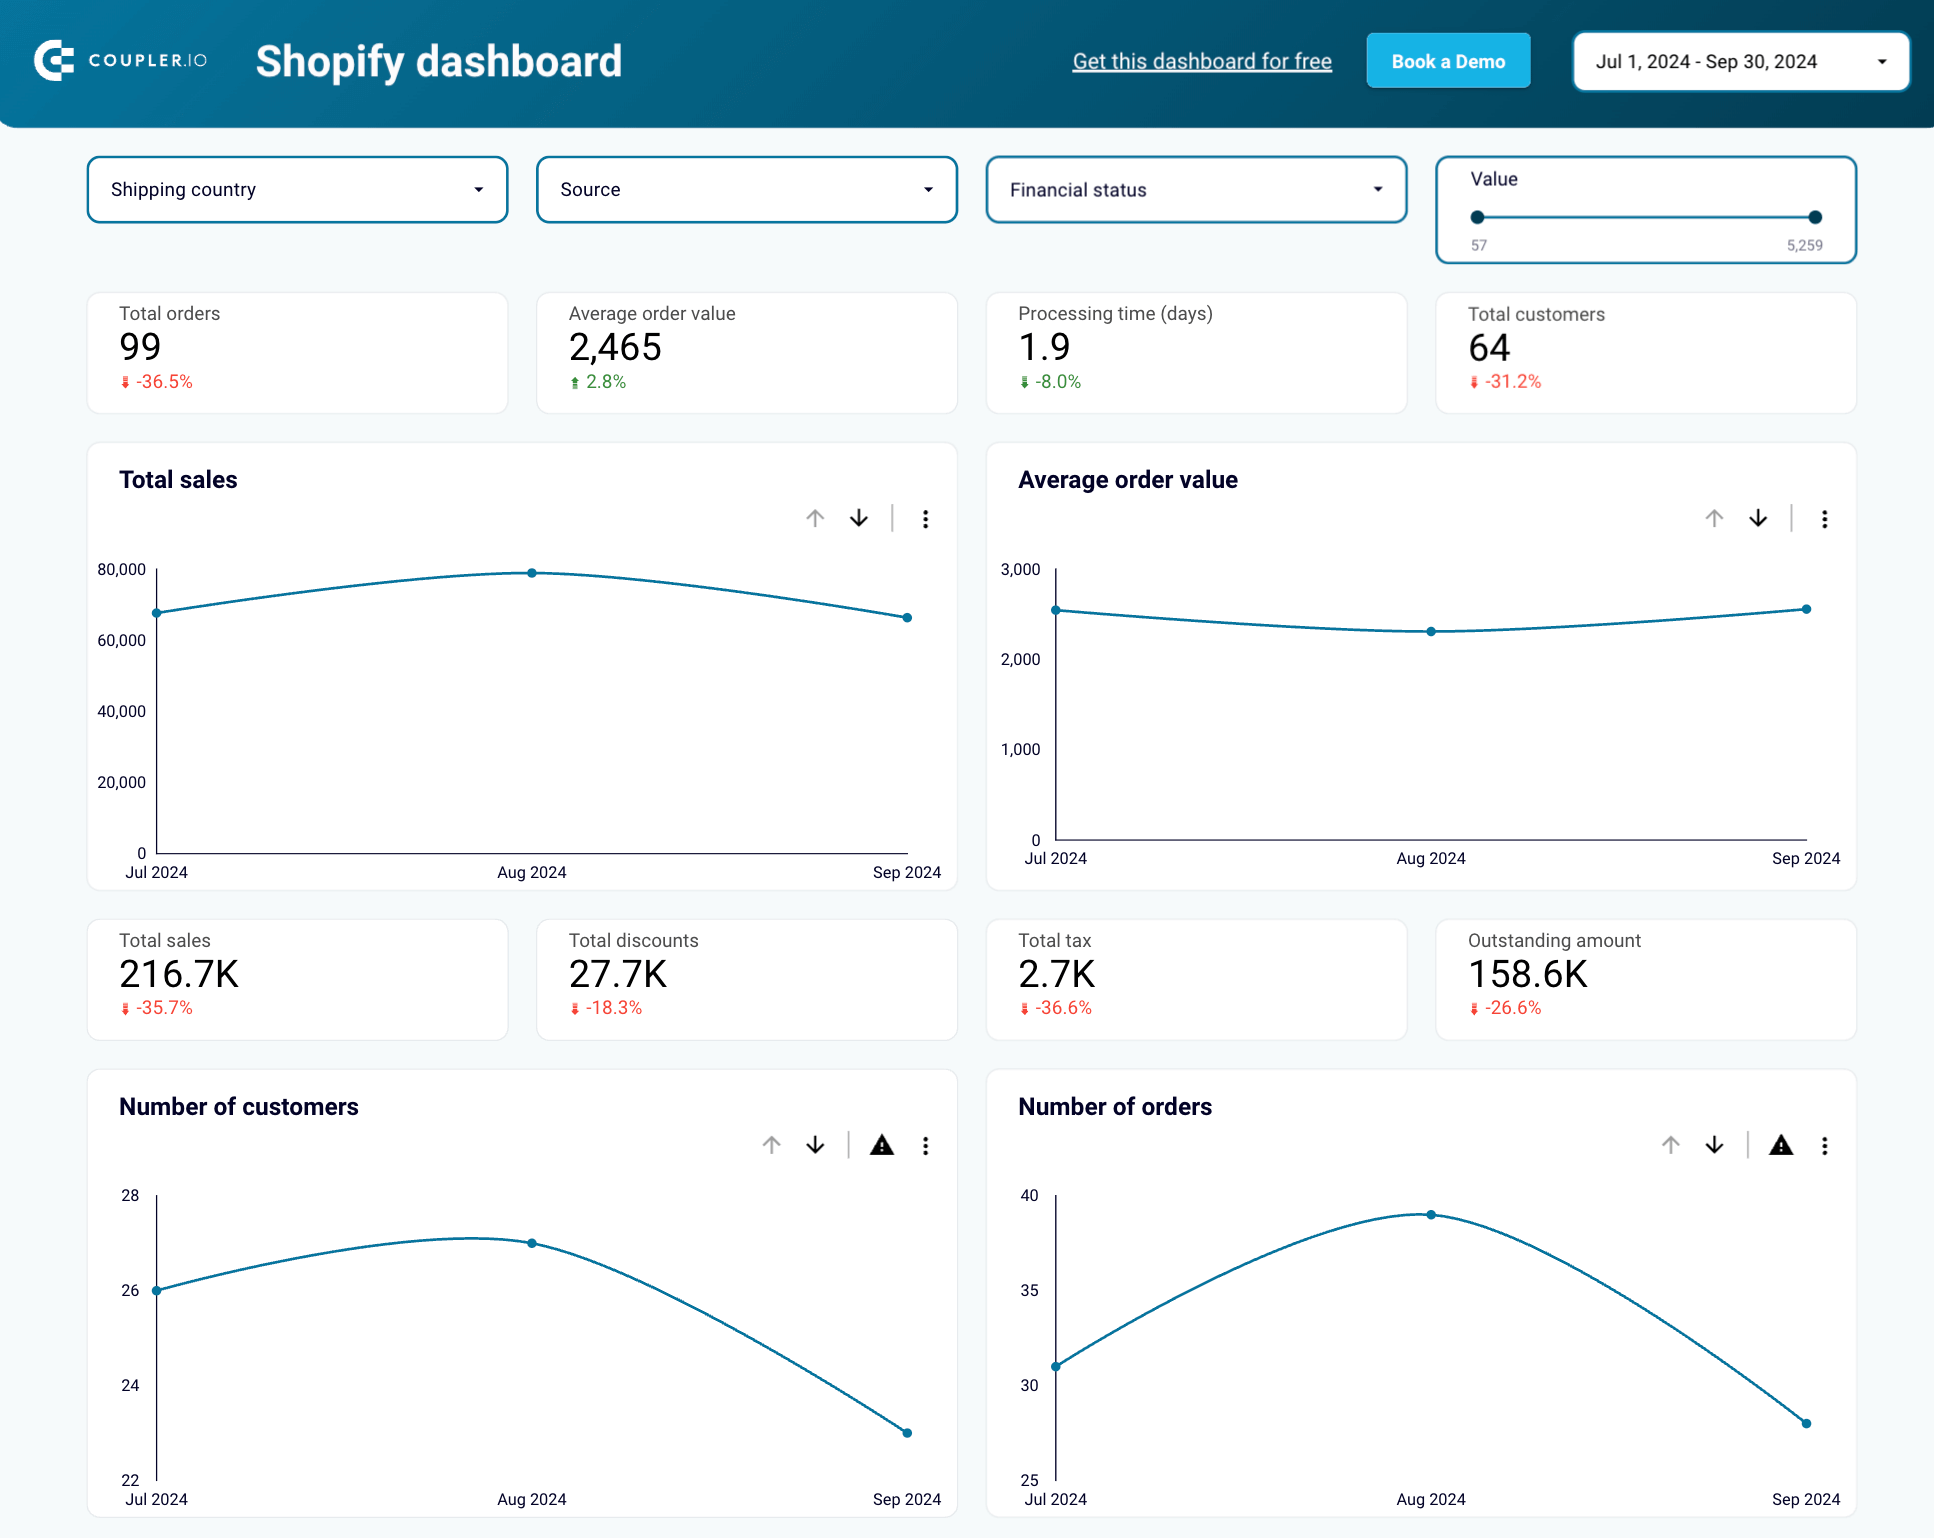
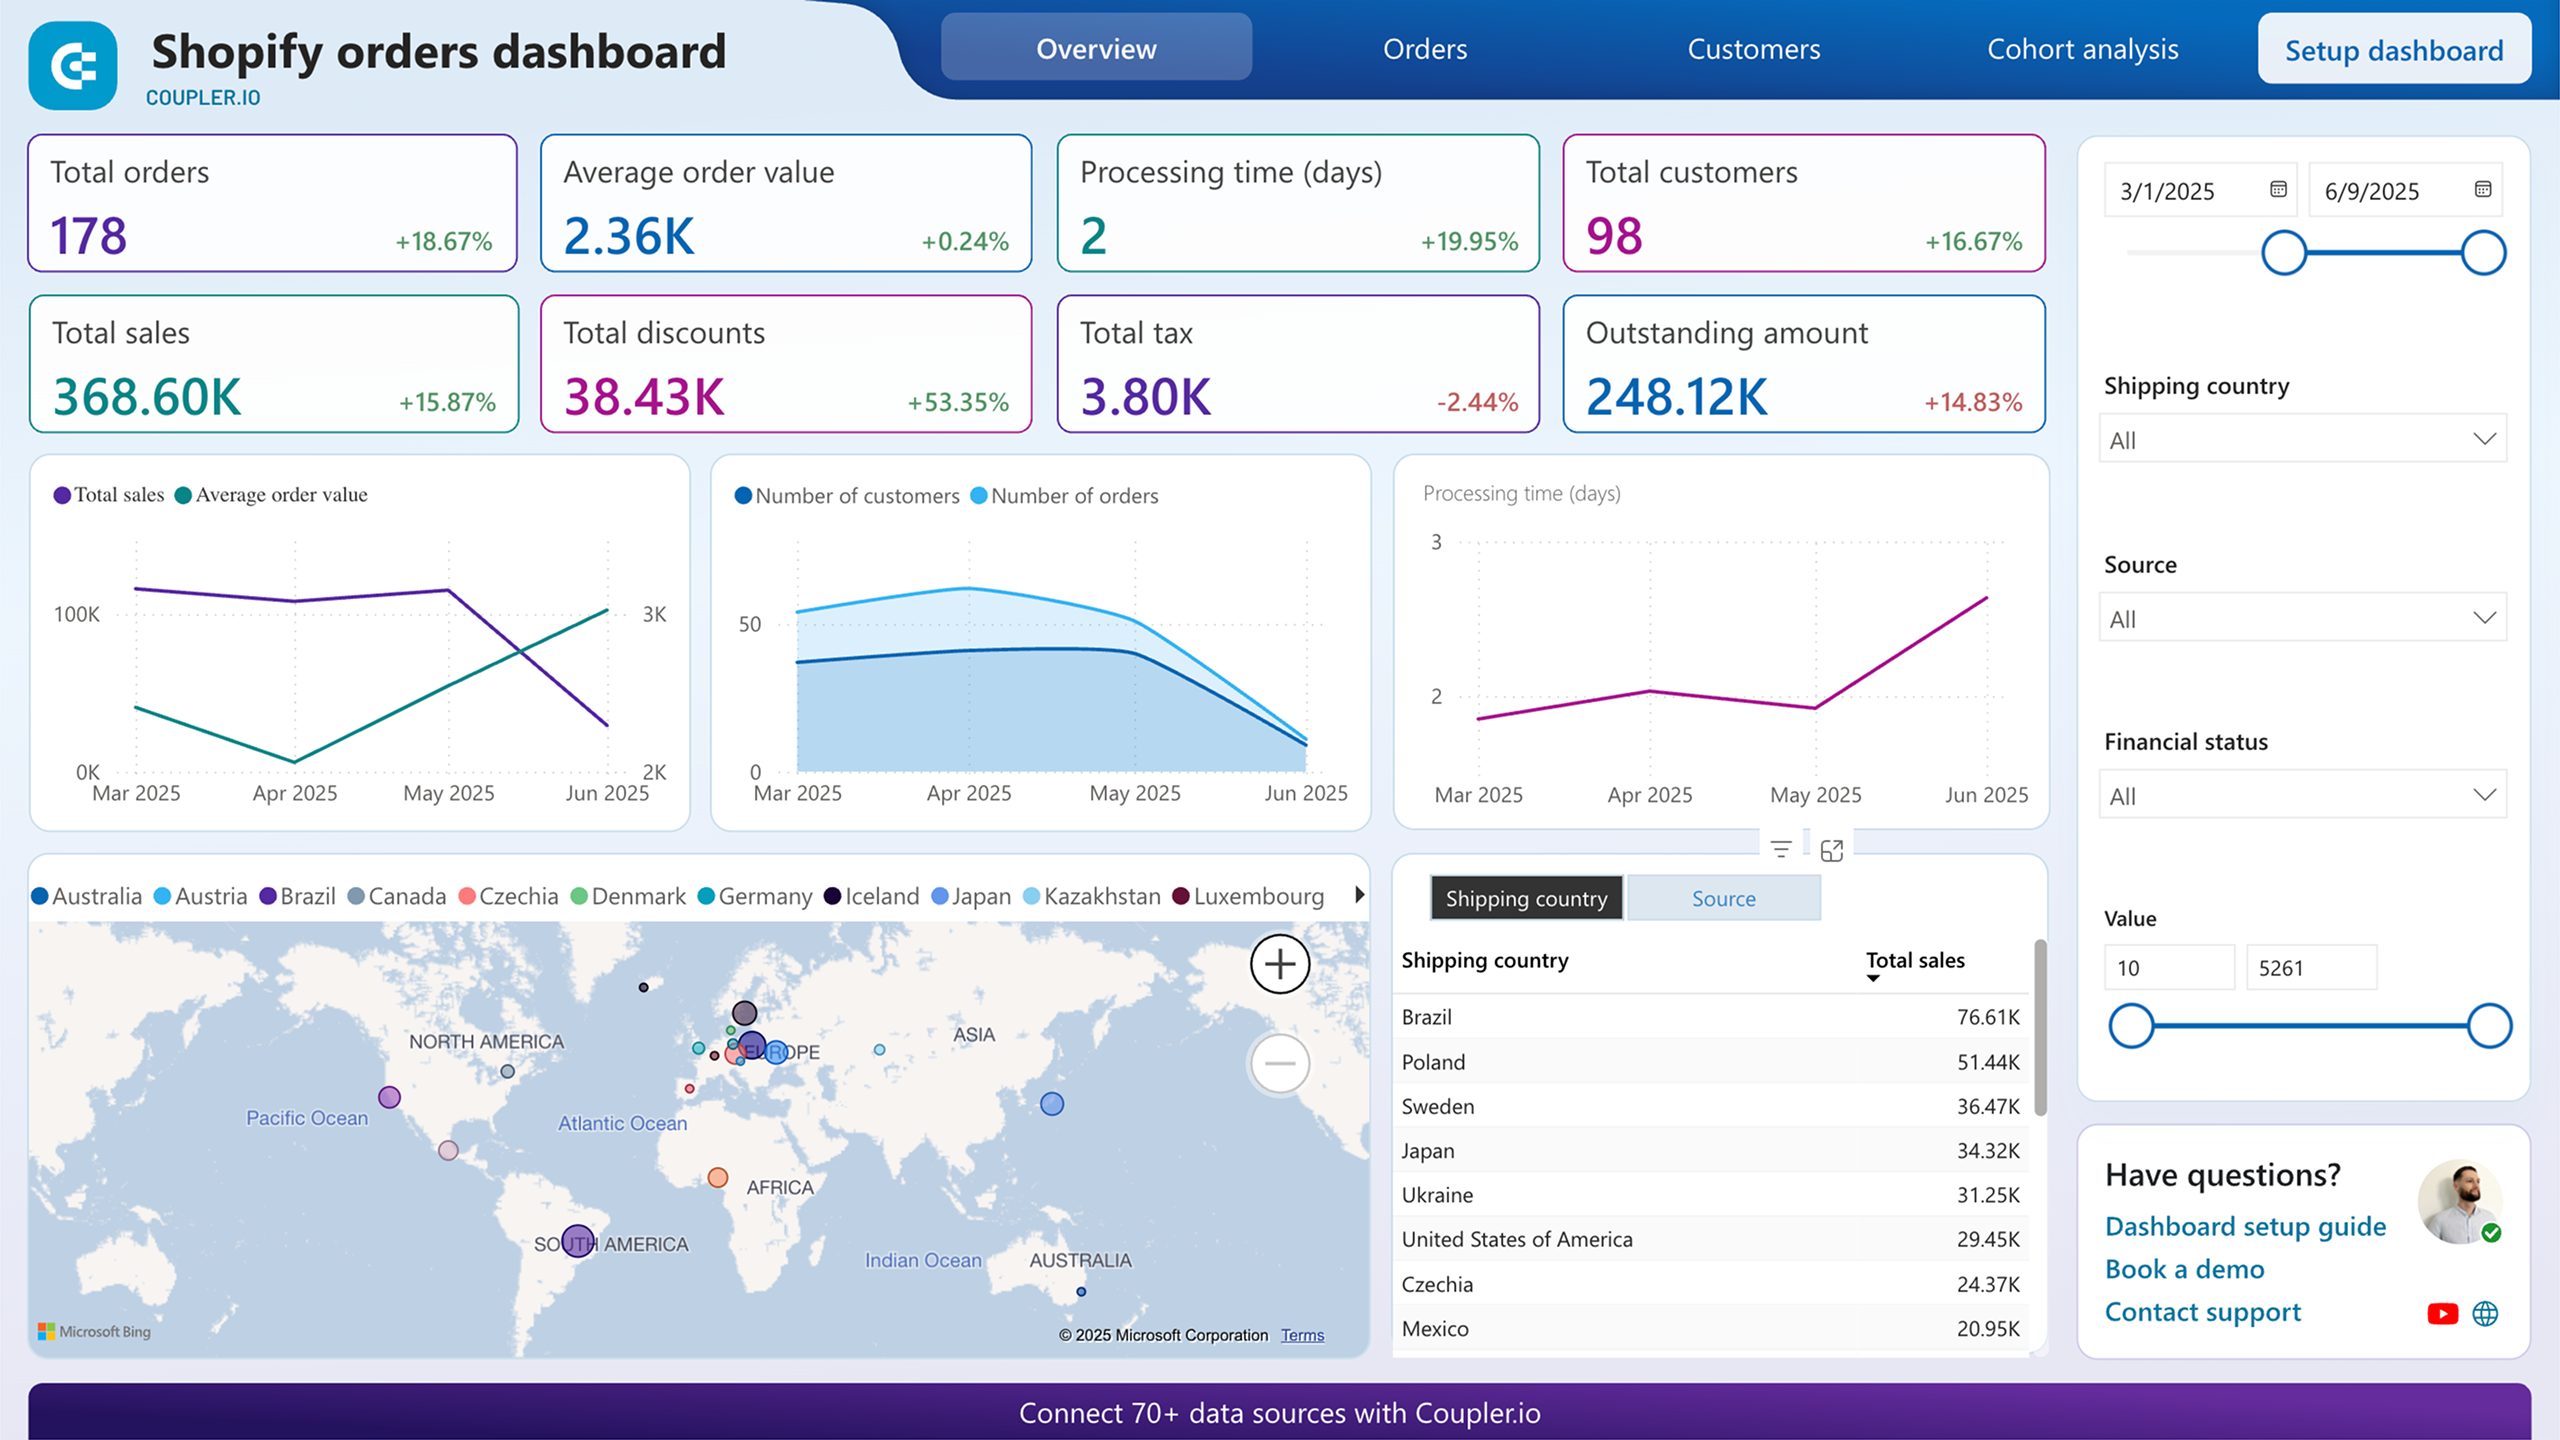
Shopify order dashboard
Once your e-commerce store starts to get orders, feel free to use this dashboard in your analytics workflow. It displays all your order-related information in an interactive form, supplying you with insights on the countries with the highest sales, sources that bring the most customers, and sales statistics over time. With this data at hand, you can further adjust your ad marketing strategy and boost sales.
What to do with this dashboard:
- Evaluate sales results. Track average order values, revenue, and refunds to understand the common sales dynamics.
- Discover top-selling items. Find out the most popular products and services among your audience. Use this information to properly organize inventory stocks and plan promotional campaigns.
- Spot popular countries. Discover countries with the highest number of sales. Use this data to optimize your supply chain, find more affordable options by couriers, elaborate on location strategies, etc.
- Perform cohort analysis. Explore sales among new and returning customers. Develop customer retention programs to increase the average customer lifetime value (CLV).
How to use it:
This store performance dashboard is available for Power BI, Looker Studio, and Google Sheets. It also comes integrated in the Coupler.io app with multiple filtering options. This version of a template also has a built-in AI helper that provides key findings, trends, and recommendations in natural language.

Shopify orders dashboard in Coupler.io
Monitor your e-commerce order flow with comprehensive insights into sales patterns, customer behavior, and fulfillment metrics.

Shopify orders dashboard in Looker Studio
Access the performance of your Shopify ecommerce store and uncover critical insights into how to manage your orders effectively.

Shopify orders dashboard in Power BI
Track order volumes, payment statuses, and shipping performance with detailed visualizations of your Shopify store’s transaction data.
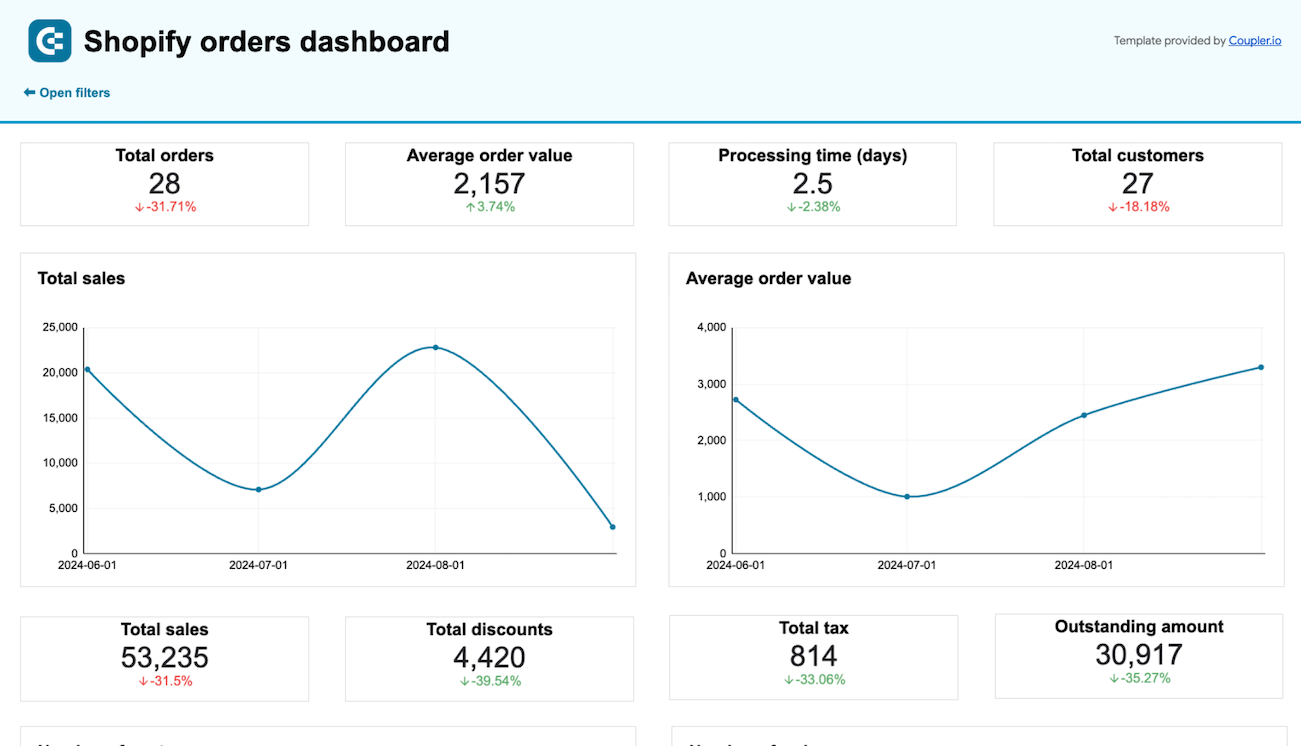
Shopify orders dashboard in Google Sheets
Monitor your Shopify store’s orders to efficiently manage sales, shipping, inventory, and identify customer trends.
Given that Coupler.io dashboards supply you with both historical and recent Shopify store performance data, consider them as a solution for ongoing monitoring of your online shop. Take advantage of its scheduling capabilities to update the report as frequently as every 15 minutes.
Turning your traffic into revenue
High GA4 traffic but low conversion rate on Shopify means that your e-commerce store bumps into sales barriers, such as:
- Wrong audience targeting (good GA4 engagement, poor Shopify sales)
- Product page issues (GA4 shows page views, Shopify shows low cart additions)
- Checkout problems (GA4 shows checkout visits, Shopify shows high abandonment)
- Mobile experience gaps (GA4 shows mobile traffic, Shopify shows desktop-only sales)
- Trust and credibility issues
- Hidden costs and poor payment options
The good news: Having GA4 traffic is the hardest part. Converting existing visitors is more cost-effective than acquiring new ones.
To optimize conversions, analyze KPIs across both GA4 and Shopify. Since traffic and sales data live in separate platforms, Coupler.io dashboards provide unified reporting that combines GA4 insights with Shopify performance metrics.
Using these integrated analytics helps you choose the right optimization approach – whether it’s improving mobile experience, streamlining checkout, or enhancing product information. This data-driven approach to conversion optimization delivers better long-term results than simply driving more traffic.